Article Text

Abstract
Objectives To compare shear-wave speed (SWS) measured by ultrasound-based point shear-wave elastography (pSWE) and MR elastography (MRE) on phantoms with a known shear modulus, and to assess method validity and variability.
Methods 5 homogeneous phantoms of different stiffnesses were made. Shear modulus was measured by a rheometer, and this value was used as the standard. 10 SWS measurements were obtained at 4 different depths with 1.0–4.5 MHz convex (4C1) and 4.0–9.0 MHz linear (9L4) transducers using pSWE. MRE was carried out once per phantom, and SWSs at 5 different depths were obtained. These SWSs were then compared with those from a rheometer using linear regression analyses.
Results SWSs obtained with both pSWE as well as MRE had a strong correlation with those obtained by a rheometer (R2>0.97). The relative difference in SWS between the procedures was from −25.2% to 25.6% for all phantoms, and from −8.1% to 6.9% when the softest and hardest phantoms were excluded. Depth dependency was noted in the 9L4 transducer of pSWE and MRE.
Conclusions SWSs from pSWE and MRE showed a good correlation with a rheometer-determined SWS. Although based on phantom studies, SWSs obtained with these methods are not always equivalent, the measurement can be thought of as reliable and these SWSs were reasonably close to each other for the middle range of stiffness within the measurable range.
- elastography
- shear wave
- rheometer
- acoustic radiation force impulse
This is an Open Access article distributed in accordance with the Creative Commons Attribution Non Commercial (CC BY-NC 4.0) license, which permits others to distribute, remix, adapt, build upon this work non-commercially, and license their derivative works on different terms, provided the original work is properly cited and the use is non-commercial. See: http://creativecommons.org/licenses/by-nc/4.0/
Statistics from Altmetric.com
Strengths and limitations of this study
To the best of our knowledge, this is the first study comparing shear-wave speed measured by ultrasound-based point shear-wave elastography (pSWE) and MR elastography (MRE) with a rheometer on calibrated phantoms.
This study demonstrates to what extent pSWE and MRE agree and their measurement variation with phantoms, which is important for clinicians using these modalities in in vivo studies.
Our study was limited to a single ultrasound elastography system and a single MRE system with phantoms with small viscosity, unlike more variable human tissue.
Introduction
Physicians have long used palpation of tissue elasticity to evaluate pathophysiological states, such as liver cirrhosis, lymph node swelling, and thyroid or breast masses. This evaluation of tissue stiffness, however, is dependent on physician experience and sensory capacity, and is essentially subjective. As an alternative to palpation, two non-invasive methods, ultrasound elastography (USE) and MR elastography (MRE), have been developed and are used clinically for evaluation of organ stiffness.1–5
Of the several types of USE, ultrasound (US)-based transient elastography (TE) and shear-wave elastography (SWE) enable quantitative measurement of tissue stiffness. TE is one-dimensional, is performed using a dedicated machine and an anatomic B-mode image is not displayed. This technique is widely available and has been validated in numerous centres worldwide.3 ,5–7 On the other hand, SWE can be performed with a standard ultrasonography device and involves the use of acoustic radiation force impulse (ARFI) technology. In SWE, an ARFI pulse is used to generate shear waves with measurable speed, allowing calculation of the shear-wave speed (SWS) of a specific lesion.3 ,8 There are two methods for SWE: point SWE (pSWE) which provides only single point measurement, and two-dimensional colour-coded SWE (2D SWE), which displays 2D colour velocity maps and allows for multiple measurements to be obtained.6 ,7 SWE has been used in a number of organs, including the breast, thyroid, liver, kidney, spleen, pancreas and lymph nodes.1 ,2 ,9
Concerning MRE, since a single MRE technique is being adopted for clinical implementation by the major MR scanner manufacturers, MRE provides reproducible results with minimal impact secondary to operator skill in comparison with US. However, hardware and software availability remains comparably limited.6 ,7
Recently, the importance of quantitative analysis for imaging biomarkers has been recognised, with efforts ongoing to improve value and practicality by reducing variability across devices, patients and time.10 SWS was selected as the primary US biomarker via the Quantitative Imaging Biomarker Alliance (QIBA) founded by the Radiological Society of North America. Bias and variance in SWS measurement between several different US systems have been reported.11–13 Although the measurement specifications of these devices should be provided by the manufacturers, they have not been released. Quantitative mutual validation between USE and MRE remains challenging, as for the tissue stiffness determined by these methods to be used as biomarkers for disease, they must be equivalent across modalities. As TE has been available for longer, more data and discussion of the cross-validation of TE and MRE in phantom or in vivo can be identified.14–17 However, few articles make a direct comparison between SWE and MRE, and many are confined to in vivo studies. 18–20 SWE and MRE correlated well in these studies, but stiffness and SWS are dissimilar, with large discrepancies seen in stiff livers in particular. Prior to reliable usage in vivo, agreement between SWE and MRE methodologies must be derived in vitro using calibrated phantoms. At the time of writing, there appears to be no direct quantitative comparison between pSWE and MRE using calibrated phantoms.
The purpose of this study is to compare SWS measured by pSWE and MRE on phantoms with a known shear modulus, and to assess the validity of these measurements. Depth-dependent bias of those methods and the repeatability of pSWE will also be determined.
Materials and methods
Phantom
Five rectangular parallelepiped phantoms (9×13×13 cm) with different stiffness were made, mimicking living tissues. These were acrylamide-based homogeneous phantoms containing graphite particles. A shear modulus for each phantom was measured by a rheometer (ARES-LS1, TA Instruments), using a frequency of 100 rad/s, and having a sample diameter of 25 mm and sample thickness of 1 mm.
A complex shear modulus of viscoelastic material G* is given by 1where G’ is the storage modulus and G” is the loss modulus. If one assumes the Voigt model, a complex shear modulus is given by
 2where μ is the elasticity (shear modulus), η is the viscosity and ω is the angular frequency. Storage modulus can thus be represented by (1) and (2):
 3When the loss modulus is very low, the storage modulus of phantom is considered not to be especially dependent on frequency.
When G’’ is close to zero, the relation between elasticity and SWS (Vs) is given by 4where ρ is the material density, calculated by dividing the weight of each phantom by its volume. Storage modulus can then be represented by (3) and (4):
 5MRE reported the stiffness in a complex shear modulus (kilopascals), whereas SWE reported it in either SWS (metres per second) or Young's modulus (kilopascals). Young's modulus is related to the shear modulus by a factor of three in living tissue. So as to avoid unnecessary complexity, we used SWS calculated by equation (5) to compare the stiffness values measured by USE and MRE in this study.
Point SWE
An Acuson S2000 (Siemens Healthcare, Erlangen, Germany) with 1.0–4.5 MHz convex (4C1) and 4.0–9.0 MHz linear (9L4) transducers was used. SWS measurement was obtained with pSWE using ARFI technology, a virtual touch quantification (VTQ) software. VTQ specifications of each transducer are shown in online supplementary table A. Since the hardest phantom of 4.86 m/s was outside the measurement range for the 4C1 transducer, it was measured only with the 9L4 transducer. SWS was measured by fixing the transducer mechanically to the phantom with a pressure of 10±0.5 kPa, a value obtained by reference to the pressure of clinical examination. The room temperature was maintained at 20°C. In each phantom, SWS of a single region of interest (ROI) was measured at four different depths: 2.0, 4.0, 6.0 and 8.0 cm with the 4C1 transducer, and 1.0, 2.0, 3.0 and 4.0 cm with the 9L4 transducer, according to their measurable depth range. The measurements were repeated 10 times at each depth, and the mean value and SD of the SWS were calculated. When SWS measurement was unreliable or out of range, SWS is displayed as ‘xx.x m/s’ on this system. When such measurement error occurred in more than 50% of measurements, these data were abandoned.
supplementary table A
MR elastography
MRI was performed using a Signa HDx 3.0 T (GE Healthcare), with an eight channel head coil and pneumatic driver. MR room temperature was similarly maintained at 20°C. A spin-echo echo planar imaging MRE sequence was used. Imaging parameters were as follows: TR=448 ms, TE=47.2 ms, field-of-view=19.2×19.2 cm2, voxel size=3.0×3.0×3.0 mm3, imaging matrix=64×64, vibration and motion-sensitising gradient (MSG) frequency=125 Hz, MSG cycle=2, phase offset=4 and readout direction=R-L. MRE was carried out once for each phantom. The storage modulus was calculated using the three-dimensional integral-type reconstruction formula (ITRF)21 and spatiotemporal directional filtering.22 Support size of the test function using ITRF was 3, 5 or 7, which was set to half of the propagation wave length.
Although the stiffness in MRE is usually reported as a complex shear modulus in kilopascals, we transformed the storage map to an SWS map using equation (5) for comparison between pSWE, MRE and a rheometer, with stiffness reported in metres per second. ROI size was set to 6×6 mm2, approximating the ROI size of VTQ, containing four pixels each. ROI was set at 2.0, 3.0, 4.0, 5.0 and 6.0 cm depth from the passive pneumatic driver on the velocity map (figure 1). Mean and SD in each ROI were calculated.
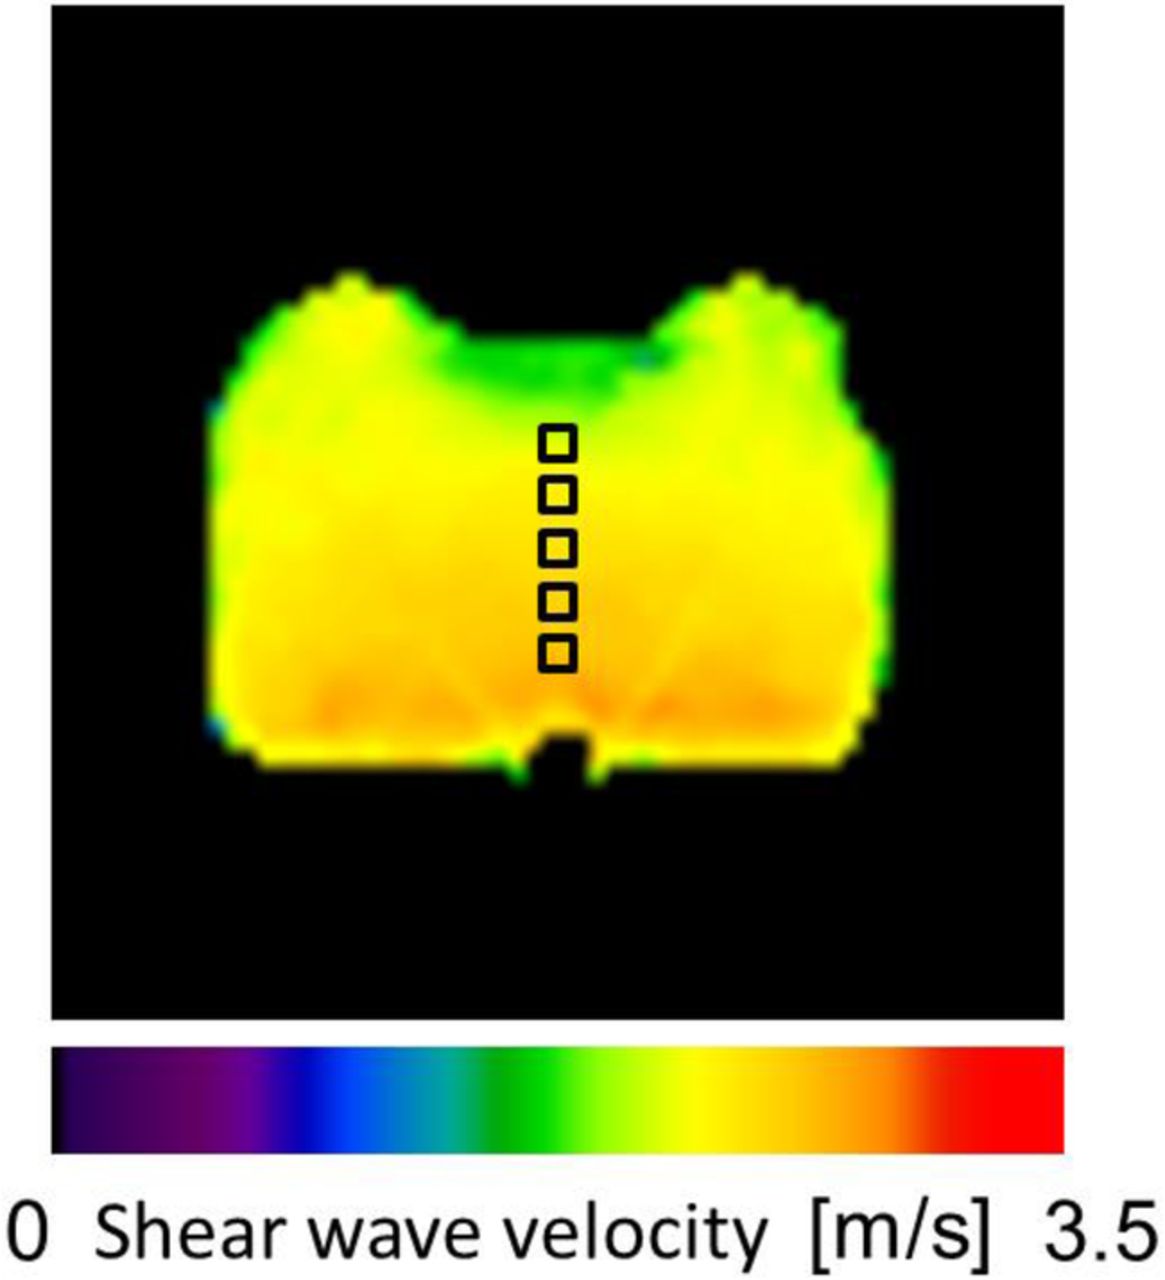
Velocity map with MRE of a phantom of SWS=2.23 m/s (storage modulus=5.2 kPa). ROI was set at 2.0, 3.0, 4.0, 5.0 and 6.0 cm depth. Depth dependence of SWS is demonstrated.MRE, MR elastography; ROI, region of interest; SWS, shear-wave speed.
Statistical analysis
All stiffnesses for pSWE, MRE and a rheometer were expressed as SWS (m/s) for the sake of comparison. SWS obtained with pSWE and MRE were compared with that of a rheometer using linear regression analyses. The relative difference was calculated as follows: 100×(SWSpSWE(9L4)−SWSpSWE(4C1))/SWSmean of pSWE(9L4/4C1) (%), 100×(SWSpSWE(4C1 or 9L4)−SWSMRE)/SWSmean of pSWE/MRE (%). Repeatability of the pSWE measurements was assessed with a one-way, single-measure intraclass correlation coefficient (ICC). For analysis of the relationship between depth and SWS, the SWS ratio was used, calculated by dividing each SWS by the rheometer-determined SWS in each phantom. One-way analysis of variance (ANOVA) and Tukey's range test for post hoc were used to detect statistical differences between SWS ratios among different depths. Statistical analyses were carried out using the SPSS V.20.0 software package (SPSS , Chicago, Illinois, USA), with a p value <0.05 being considered statistically significant.
Results
Phantoms
On rheometer measurement, the storage moduli of each phantom were 2.1, 5.2, 9.7, 13.3 and 25.0 kPa, with loss moduli of 0.15, 0.17, 0.30, 0.47 and 0.60 kPa, respectively. The mean loss moduli of each phantom was 3.9% (range 2.4–7.1%) of the storage moduli, and was small enough to be considered negligible. Using equation (5), the SWS of each phantom was calculated as 1.41, 2.23, 3.01, 3.56 and 4.86 m/s.
Data acquisition of pSWE
In pSWE, measurement error occurred at a depth of 1.0 cm with the 9L4 transducer and at 2.0 cm with the 4C1 transducer, and these depths were abandoned. Depths 2.0, 3.0 and 4.0 cm with the 9L4 transducer and 4.0, 6.0 and 8.0 cm with the 4C1 transducer were included for analysis.
Correlation with rheometer measurement
We used data measured at a depth of 4 cm for comparison, at which SWS was successfully obtained for both transducers in pSWE, as well as MRE, with the exception of the 4C1 transducer at 25.0 kPa (4.86 m/s), which was outside the measurement range.
Both SWSs obtained with pSWE (4C1 and 9L4) and MRE had a strong correlation with that of the rheometer (coefficient of determination R2=0.998, 0.999 and 0.979, respectively, figure 2). The slopes of linear regression best-fit line were 1.1 and 1.2 for pSWE (4C1 and 9L4), respectively, as opposed to 0.77 for MRE. The relative difference of SWS between the 9L4 and 4C1 transducers, and between pSWE and MRE, was from −25.2% to 25.6% for all phantoms, and from −8.1% to 6.9% when the softest and hardest phantoms were excluded (table 1).
Relative difference (%) between SWS obtained with pSWE (9L4 and 4C1 transducer) and MRE of each phantom at a 4 cm depth
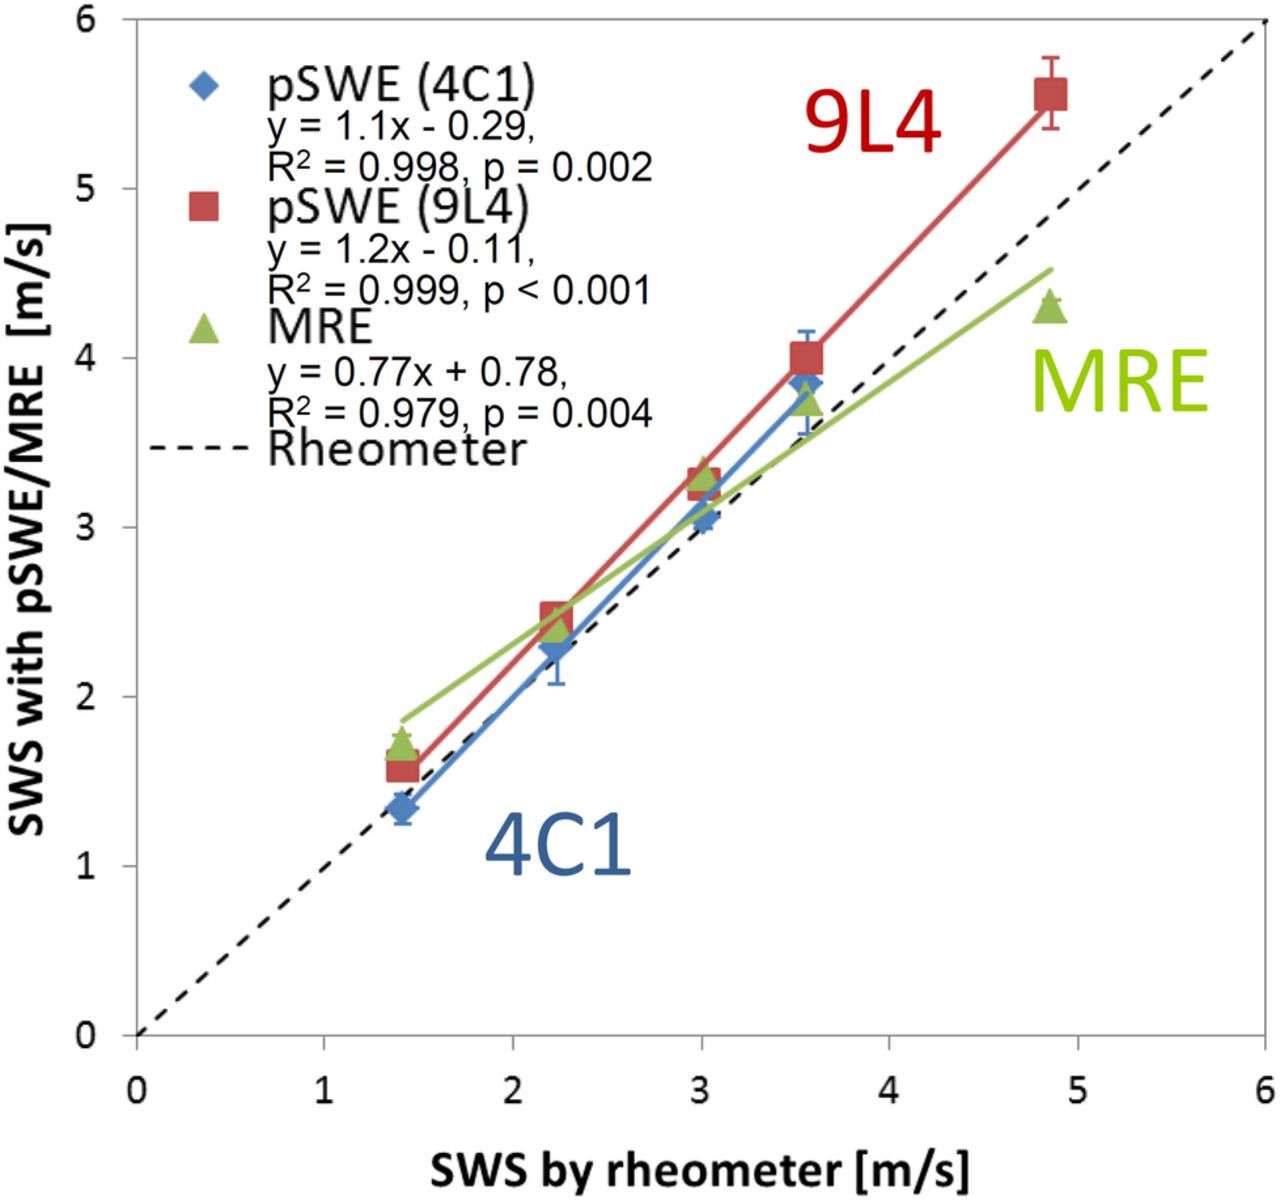
SWS at a 4 cm depth measured with pSWE (4C1 and 9L4 transducer) and MRE compared with that of a rheometer. MRE,MR elastography; pSWE, point shear-wave elastography; SWS, shear-wave speed.
Measurement repeatability of pSWE
ICC of SWS measurement with pSWE was more than 0.93 for all measurements with the 9L4 and 4C1 transducers (table 2). ICC of the 4C1 transducer was lower than that of the 9L4 transducer.
One-way single-measure ICC of SWS measurement at each depth with pSWE
Depth dependency
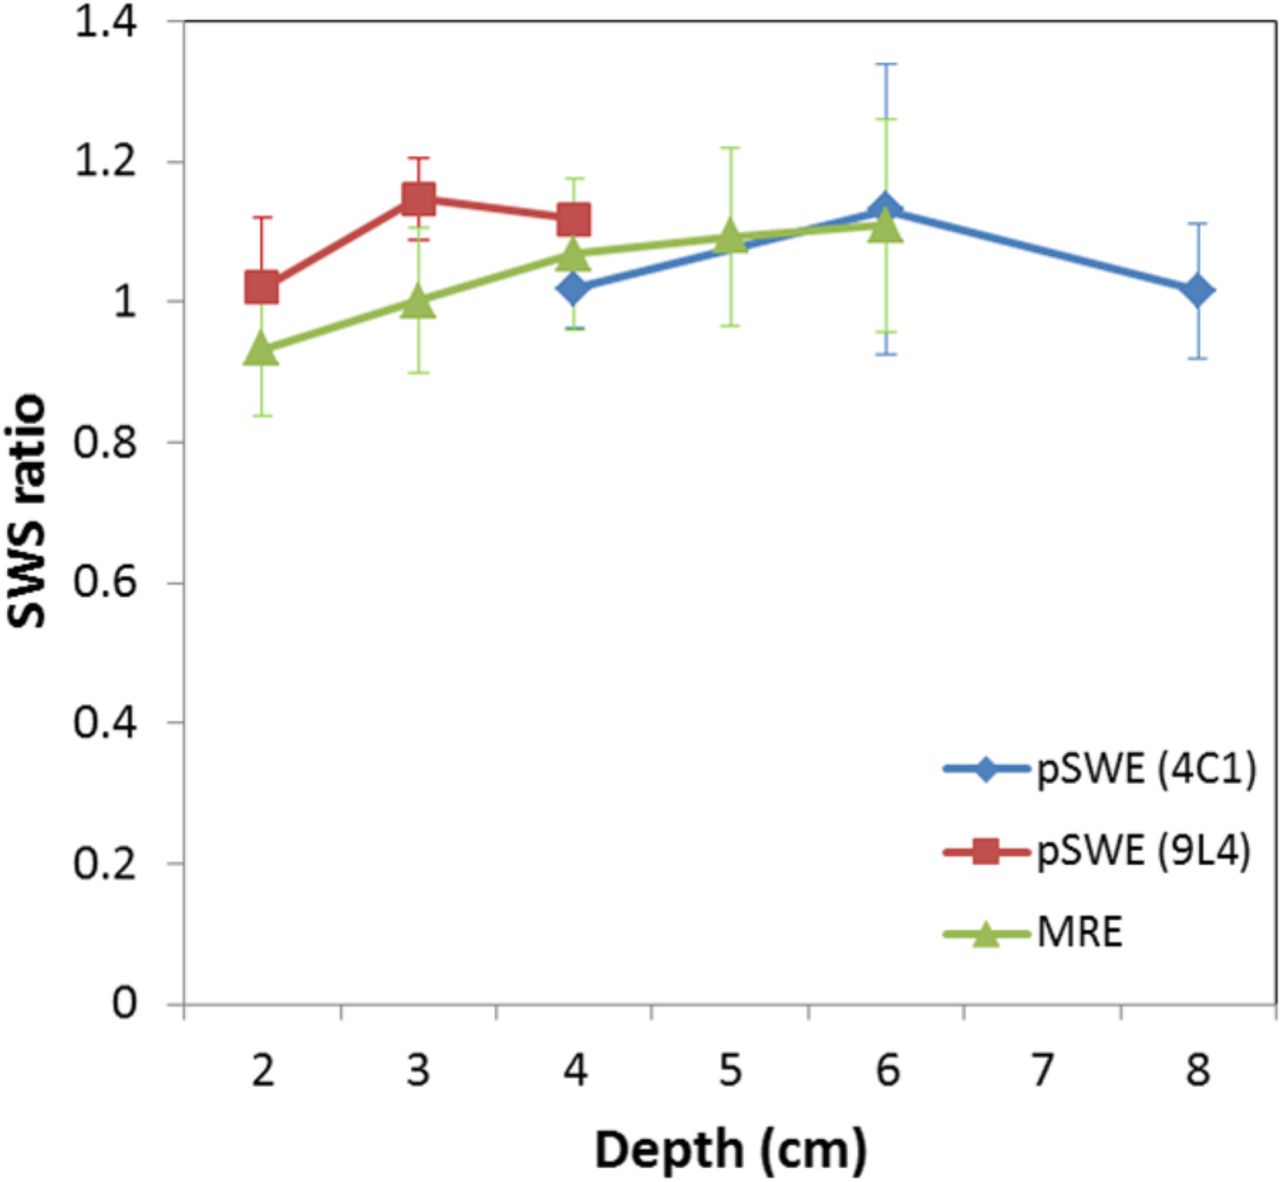
The relationship between the ROI depth and the SWS ratio is shown in figure 3. One-way ANOVA revealed no definitive difference in SWS ratios at different depths for pSWE using the 4C1 transducer (F=1.3, p=0.32), but significant differences were found in the SWS ratios for the pSWE 9L4 transducer (F=10.4, p=0.002) and for MRE (F=28.7, p<0.001). On Tukey's range test, SWS ratio at a depth of 2 cm was statistically lower than that at 3 and 4 cm for the 9L4 transducer. For MRE, SWS ratios at a depth of 2 and 3 cm were statistically lower than those with a deeper ROI (see online supplementary table B).

Depth dependency of SWS with pSWE (4C1 and 9L4 transducer) and MRE at each depth. The SWS ratio is calculated by dividing each SWS by a rheometer-determined SWS. Significant differences between depths were found for pSWE (9L4) and for MRE with one-way ANOVA.ANOVA, analysis of variance; MRE, MR elastography; pSWE, point shear-wave elastography; SWS, shear-wave speed.
supplementary table B
Discussion
In this study, SWSs obtained with pSWE and MRE showed a good correlation with a rheometer-determined SWS and these measurements showed considerably close SWSs in measuring phantoms. SWSs of pSWE were higher than those of a rheometer, except in the softest phantom measured with the 4C1 transducer. We compared these SWSs while considering the loss modulus negligible, but higher SWS seen in pSWE may imply the existence of a loss modulus. Furthermore, the frequency content of the shear wave of pSWE is considered higher than that of the rheometer,23 although it is not disclosed by the vendor. Since a previous study has shown that the storage and loss modulus increases with the frequency of the shear wave,24 the higher frequency of the shear wave in pSWE might lead to a higher SWS.
The slope of the linear regression best-fit line of MRE was 0.77, and MRE showed a relatively lower SWS than pSWE for stiffer phantoms. This result mirrors previous clinical studies, which reported that shear moduli obtained with MRE were smaller than those with TE and pSWE in a stiffer liver17 ,19 (see online supplementary table C). In another clinical study comparing MRE and 2D SWE, Yoon et al18 suggest that there was a moderate correlation in liver stiffness measured by SWE and MRE, but both examinations presented similar diagnostic performance for excluding hepatic fibrosis. These papers describe the differences seen between TE or SWE and MRE as being caused by diffraction and reflection in a stiff liver, complicated by a difference of vibration frequency. Since three-dimensional ITRF was used here, which is robust to complex interference patterns,21 ,25 the influence of diffraction and reflection may be minimised. The differing frequency of the shear wave is suspected to be a chief cause for the lower SWS of MRE than that of pSWE in this study. SWSs obtained with pSWE and MRE, however, were reasonably close to each other, with differences of <9% for phantoms of 5.2–13.3 kPa (2.23–3.56 m/s), but more than 25% for the softest (2.1 kPa, 1.41 m/s) and the hardest (25 kPa, 4.86 m/s) phantoms. This difference is equal to or better than a previous phantom study comparing TE and MRE, which reported an average relative difference of 23%.16 These inconsistencies, however, are thought to make it difficult to use the same diagnostic cut-offs between pSWE and MRE. Further study with adjusting frequency may bring the SWS of the two procedures closer.
supplementary table C
The ICCs of measurements using pSWE were more than 0.9, indicating a potential for excellent repeatability. The ICC of pSWE with the 4C1 transducer was lower than that with the 9L4 transducer, pointing to larger variability in the 4C1 transducer measurement. In a previous study, the ICCs of 4C1 and 9L4 transducers were equivalent, but the coefficient of variation of 4C1 transducer was greater than that of 9L4.12 One reason for the large variability seen with the 4C1 transducer may be instability stemming from transducer placement, due to its convex shape versus the linear 9L4 transducer. Additionally, the lower frequency and spatial resolution of the 4C1 transducer may further cause dispersion.
Repeatability of pSWE was considerably high, but measurement error was consistently encountered at the shallowest ROI of 1 cm for 9L4 and 2 cm for 4C1 transducers, and thus those data were abandoned. MRE demonstrated a lower SWS area at 1–2 cm under the pneumatic driver (figure 1) and the same phenomenon might occur at a shallow area under the transducer, inducing instability of SWS. The other reason for this measurement error is thought to be due to multiple reflections from the surface of the phantom, because these phantoms were wrapped with plastic film to prevent drying.
There was no significant difference in SWS ratios at different depths with the 4C1 transducer, but SWS ratios of deeper areas were significantly higher than those at a 2 cm depth taken with the 9L4 transducer. Some previous studies have shown evidence for depth dependency with the 4C1 transducer,11 ,26 while another study has reported that the effect of depth was small or inconsistent.12 Depth dependency with the 4C1 transducer might be concealed under the large variability discussed above and thus was not found to be significant in our study. SWS with MRE showed a depth-dependent increase, obvious on a velocity map (figure 1). There are few studies discussing the depth dependence of MRE, because stiffness is usually calculated with a large ROI and the SWS of each depth is not measured precisely in MRE. One limited previous study demonstrated that SWS obtained with MRE was independent from depth,27 which differs from our results. It is likely that the depth dependence found here is due to the object's own weight, owing to the long examination time. This hypothesis may be verifiable by setting vibration direction perpendicular to gravity. To consider a bias relating to depth variability in clinical USE/MRE, we should specify the measurement depth when we measure SWS.
We produced phantoms according to the measureable range of SWS, with their speeds corresponding to normal tissue or to various disease statuses.1 ,2 ,9 The softest phantom, at 1.41 m/s, is already indicative of fibrosis in the liver.28 The pressure used when fixing the transducer is too strong to measure liver stiffness though intercostal space, although it is appropriate for the assessment of superficial organs, such as the thyroid and breast. For these reasons, our results are not readily applicable to the staging of liver fibrosis. In vivo cross-validation studies between MRE and SWE have been limited to the liver so far, but these elastographs are increasingly available for a variety of organs and diseases. Understanding the measurement characteristics of MRE and pSWE demonstrated in controlled phantom studies will help clinicians to interpret and compare these values in clinical practice.
There are some limitations with our current study. One lies in the difference in means of measuring SWS between pSWE and MRE. In this study, SWS was obtained 10 times with pSWE, whereas MRE was examined once, with SWS obtained on one velocity map. Therefore, we could not compare SWS between the two modalities statistically. Second, we assessed the validity in phantoms with small viscosity, ignoring the loss modulus. Further study is needed using viscoelastic phantoms with larger viscosities, more similar to human tissue, to determine how viscosity affects the inconsistency in measurement between pSWE and MRE. Third, we compared only a single USE system and a single MRE system. Other systems also need to be examined using calibrated phantoms to further estimate the variability of SWS measurement, so as to increase the reliability of multimodal elastography.
In conclusion, SWSs from pSWE and MRE showed a good correlation with a rheometer-determined SWS. pSWE and MRE gave close SWSs for the middle range of stiffness within the measurable range, though SWSs obtained with these modalities were not equivalent for the extremes of the total measurement range. Depth-dependent bias was also found in the 9L4 transducer of pSWE and MRE. These measurement inconsistencies may result in different diagnostic thresholds between pSWE and MRE in clinical practice. Clinicians using elastography examinations will need to be familiar with the measurement variabilities of SWS measurement with modality and depth.
References
Footnotes
Contributors RK, MS, AK and TO provided substantial contributions to the conception or design of the work; or the acquisition, analysis, or interpretation of data for the work. RK, MS, AK, DKE and TO were involved in drafting the work or revising it critically for important intellectual content. All authors were involved in final approval of the version to be published and provided agreement to be accountable for all aspects of the work in ensuring that questions related to the accuracy or integrity of any part of the work are appropriately investigated and resolved.
Funding This research received no specific grant from any funding agency in the public, commercial or not-for-profit sectors.
Competing interests None declared.
Provenance and peer review Not commissioned; externally peer reviewed.
Data sharing statement No additional data are available.