Article Text

Abstract
Objectives To project the number of people aged 45–64 years with lost productive life years (PLYs) due to diabetes and related costs (lost income, extra welfare payments, lost taxation revenue); and lost gross domestic product (GDP) attributable to diabetes in Australia from 2015 to 2030.
Design A simulation study of how the number of people aged 45–64 years with diabetes increases over time (based on population growth and disease trend data) and the economic losses incurred by individuals and the government. Cross-sectional outputs of a microsimulation model (Health&WealthMOD2030) which used the Australian Bureau of Statistics’ Survey of Disability, Ageing and Carers 2003 and 2009 as a base population and integrated outputs from two microsimulation models (Static Incomes Model and Australian Population and Policy Simulation Model), Treasury's population and labour force projections, and chronic disease trends data.
Setting Australian population aged 45–64 years in 2015, 2020, 2025 and 2030.
Outcome measures Lost PLYs, lost income, extra welfare payments, lost taxation revenue, lost GDP.
Results 18 100 people are out of the labour force due to diabetes in 2015, increasing to 21 400 in 2030 (18% increase). National costs consisted of a loss of $A467 million in annual income in 2015, increasing to $A807 million in 2030 (73% increase). For the government, extra annual welfare payments increased from $A311 million in 2015 to $A350 million in 2030 (13% increase); and lost annual taxation revenue increased from $A102 million in 2015 to $A166 million in 2030 (63% increase). A loss of $A2.1 billion in GDP was projected for 2015, increasing to $A2.9 billion in 2030 attributable to diabetes through its impact on PLYs.
Conclusions Individuals incur significant costs of diabetes through lost PLYs and lost income in addition to disease burden through human suffering and healthcare costs. The government incurs extra welfare payments, lost taxation revenue and lost GDP, along with direct healthcare costs.
- DIABETES & ENDOCRINOLOGY
- HEALTH ECONOMICS
- PUBLIC HEALTH
This is an Open Access article distributed in accordance with the Creative Commons Attribution Non Commercial (CC BY-NC 4.0) license, which permits others to distribute, remix, adapt, build upon this work non-commercially, and license their derivative works on different terms, provided the original work is properly cited and the use is non-commercial. See: http://creativecommons.org/licenses/by-nc/4.0/
Statistics from Altmetric.com
Strengths and limitations of this study
The study is the first in Australia and internationally to project the costs of older workers exiting the labour market due to diabetes from the perspective of individuals, government and the nation over a long time horizon (ie, out to 2030).
The study uses a microsimulation model on the impacts of ill-health, Health&WealthMOD2030, which integrates output from two long-standing income, tax and welfare payments microsimulation models (Static Incomes Model and Australian Population and Policy Simulation Model) and reliable labour force and disease trends data.
Study findings are based on Survey of Disability, Ageing and Carers respondents' self-reported labour force status and type of chronic disease (diabetes).
This study provides novel insights into the interdependency of diabetes, labour force participation and costs, with potential implications for clinical care and health policy. It supports preventive health interventions that not only improve health outcomes but also the work capacity of people with diabetes which, in turn, can reduce downstream costs (such as lost personal incomes, extra welfare payments, lost taxation revenue, lost gross domestic product).
Introduction
The prevalence of diabetes in adults (aged 20–79 years) globally was estimated to be 415 million in 2015, and is projected to increase to 642 million by 2040.1 The disability burden of diabetes is associated with a range of symptoms (such as fatigue, increased thirst, frequent urination, blurred vision) and complications which can eventually lead to stroke, blindness, heart attack, kidney failure, amputation and poor psychological well-being—all of which can result in serious impairment, activity limitations and participation restriction.2 ,3 Various measures of disability burden suggest that the burden of diabetes is also increasing globally.1 ,3 ,4 For example, the number of Disability Adjusted Life Years (DALYs) lost to diabetes globally increased by 67.2% from 12 412 DALYs (per 100 000) in 1990 to 20 758 DALYs in 2010. Thus over these 10 years diabetes increased in relative causation of disability from a ranking of 10th to 9th globally.5 Diabetes is a leading cause of deaths each year, with the International Diabetes Federation (2015) reporting that there were 5 million deaths from diabetes worldwide in 2015.1 ,6 In addition to the health burden, national governments and international economic/public health organisations, such as the Organisation for Economic Co-operation and Development and the WHO, are also concerned about the negative impact of diabetes on productive life years—defined as the number of people exiting the labour force due to diabetes each year7—and the related financial impacts on individuals, and on governments to have sufficient taxation revenue for the healthcare and other services consumed by the ageing population.8 ,9
The direct (healthcare) costs of diabetes are substantial and rising, with the rise of type 2 diabetes contributing to most of the costs. For type 2 diabetes, this is likely driven by the increasing prevalence of obesity, the ageing population, dietary changes and sedentary lifestyles.3 In 2012, the direct medical costs of diagnosed diabetes reached $176 billion in the USA—72% of the total cost of diabetes ($245 billion). Moreover, medical expenditures among people with diagnosed diabetes were 2.3 times higher than these expenditures would have been in the absence of diabetes.2 In Australia, the healthcare costs of diabetes increased from $811 million in 2000–2001 to $1507 million in 2008–2009—an increase of 86% which was considerably greater than the increase in healthcare expenditure for all diseases (60%) over this period. In 2008–2009, around 43% of healthcare expenditure on diabetes was on hospital admitted patient services ($647 million), followed by 24% on out-of-hospital medical services ($362 million) and 33% on blood glucose-lowering medicines ($498 million).10 However, these figures only refer to direct (healthcare) costs.
While the direct costs of diabetes are substantial, the full range of indirect costs (ie, lost earnings, lost productivity, lost superannuation, lost taxation revenue, carer costs, extra welfare payments, cost of aids and home/work modifications, travel costs) are recognised as being even greater.11 ,12 The indirect costs are mostly attributed to lost productivity, with diabetes affecting an individual's ability to maintain employment due to the associated physical disability that reduces their earning capacity.13 In the USA in 2012, the cost from reduced productivity due to diagnosed diabetes was $69 billion—28% of the total estimated cost of diagnosed diabetes in 2012.2 In Australia in 2012, the estimated cost of lost labour force participation due to diabetes was $384 million, with resultant extra welfare payments of $4 million and lost taxation revenue of $56 million.14 A recent study estimated that 4.2% of Australians aged 45–64 years were out of the labour force due to diabetes in 2010 (14 000), projected to increase to 4.95% (22 000) by 2030, pushing diabetes from 11th to 9th spot in the ranking of chronic conditions that lead to exits from the labour market among this age group.7
There are few studies on the economic costs of lost labour force participation due to diabetes that consider both individual and government perspectives.14 Most studies on the indirect costs of diabetes focus only on the loss of earnings for individuals. Resultant reductions in income taxation revenue and increased welfare payments affecting the government are rarely assessed. Although the authors have estimated the economic costs of diabetes through its impact on labour force participation previously (including current income, savings and retirement income, poverty)14–16 these estimates are limited to a single year (2009).
The aim of this study is to project the economic costs of diabetes among Australians aged 45–64 years over a 15-year period (2015–2030) using outputs from Australia's first microsimulation model on the current and projected economic costs of ill-health, called Health&WealthMOD2030. The model integrates data from Australian Bureau of Statistics’ (ABS) Survey of Disability, Ageing and Carers (SDACs) 2003 and 2009; output from two long-standing microsimulation models, Static Incomes Model (STINMOD) and Australian Population and, Policy Simulation Model (APPSIM) (both of which are regularly used by government departments to assess the impacts of (economic) policy changes on the population); reliable population and labour force growth data from the Commonwealth Treasury; and reliable chronic disease trends data from the Australian Burden of Disease and Injury Study (2003). This is the first study in Australia and internationally to project a range of indirect costs of diabetes (lost productive life years, extra welfare payments, lost taxation revenue and lost GDP) from both the individual and government perspectives over a long-time horizon.
Research design and methods
Data
We used outputs from a microsimulation model of the economic costs of ill-health (chronic conditions, disabilities) among Australians aged 45–64 years, called Health&WealthMOD2030, to project the impact of diabetes on labour force participation, personal earnings (income from work), welfare payments, and taxation revenue spending. The development of Health&WealthMOD2030 is described in detail in Schofield et al (2015).17 How the data sources were combined and how data flows through the microsimulation model are illustrated in figure 1.

Schematic diagram of Health&WealthMOD2030.
The base population of the model is comprised of unit record data on individuals aged 45–64 years from the Surveys of Disability, Ageing and Carers (SDACs) 2003 and 2009, conducted by the Australian Bureau of Statistics (ABS).18 ,19 The SDACs are nationally representative household survey data, providing information on individual (age, sex), socioeconomic (highest level of education, income, labour force participation, home ownership, receipt of welfare payments) and health and disability characteristics (chronic conditions, type and degree of disability) of each person in the household.
The SDACs of 2003 and 2009 were reweighted separately using the ABS reweighting algorithm called GREGWT20 to account for demographic, labour force, prevalence of chronic conditions and other changes in the population occurring between the survey years (2003, 2009), with the purpose of making the data represent the Australian population in 2015, and then projected to 2020, 2025 and 2030. The mathematical technique is described in Tanton et al21 (2011). The main source for benchmarking data on demographic and socioeconomic changes was Commonwealth Treasury, which provided demographic and labour force projections data. For trends in chronic conditions, we applied the age and sex specific trends in chronic conditions estimated in the 2003 Australian Burden of Disease and Injury Study,22 which estimated trends for the period from 2003 to 2023 and assumed that prevalence rates would stabilise afterwards. We calculated proportional changes in chronic condition prevalence and applied these to corresponding diseases in the SDAC data, which were grouped as follows: stroke, cancer (almost stable in men and women), ischaemic heart disease (decreasing trend in men and women), type 2 diabetes (increasing trend in men and women) and chronic obstructive pulmonary disease (stable trend in men; increasing trend in women). For the health conditions without data on trends, age-sex prevalence rates were assumed to be stable over time. Based on proportional changes, the prevalence of health conditions among Australians aged 45–64 years was projected for 2015, 2020, 2025 and 2030 by 5-year age group and sex.
Using a separate microsimulation model, called STINMOD, additional economic data (personal income, welfare payments received, taxes paid) were imputed onto the base data. STINMOD was developed (and is maintained) by the National Centre for Social and Economic Modelling (NATSEM, University of Canberra) (http://www.natsem.canberra.edu.au) and is the principal microsimulation model of Australia's income tax and transfer (welfare) system.23 Income and wealth information from STINMOD for 2013 was imputed onto the base population of Health&WealthMOD2030 (and aged to 2030) by identifying people with similar characteristics on STINMOD and ‘donating’ their income and wealth information onto the model using a technique commonly used in microsimulation modelling called synthetic matching.24 Ten variables, common to both models and significantly related to income, were used to match donor STINMOD records and the base data records: labour force status, income unit type, income quintile, receipt of aged pension, receipt of disability support pensions, sex, age group, hours of work per week, education and home ownership.
The economic data from STINMOD for 2013 were indexed to reflect economic growth projections from 2013 to 2030. Income and taxes paid by individuals were assumed to grow at a rate of 1% per annum in real terms (Treasury, 2015).25 Welfare payments were assumed to have no real growth based on the government's policy of increasing welfare payments (except for aged pension) in line with national Consumer Price Index growth.
Additional sociodemographic data from a third source, a dynamic microsimulation model called APPSIM,26 were imputed onto the base population (education, income unit, homeownership, receipt of the disability support pension in 2015, 2020, 2025, 2030). APPSIM was developed by NATSEM in collaboration with 12 Australian Government departments (and is maintained by NATSEM) for the purpose of simulating annual snapshots of the Australian population from 2001 to 2051. APPSIM simulates all major life events (death, migration, marriage, divorce, childbirth, ageing, education, labour force participation, retirement) on the basis of the probability of such events happening to real people in Australia.
The use of the ABS SDAC 2003, 2009 data was approved by the ABS Microdata Review Panel.
Lost productive life years (PLYs) due to diabetes
In the SDACs, respondents were asked to nominate their current labour force status as either:
Employed working full-time
Employed working part-time
Unemployed looking for full-time work
Unemployed looking for part-time work
Not in the labour force
Respondents who were not in the labour force were also asked to nominate the main reason they were not working or looking for work. One of the options was ‘own ill-health or disability’. All respondents were asked whether they have a main long-term health condition, and to nominate the type of main condition they have from a list of 80 diseases classified by the ABS using International Classification of Diseases 10th Edition (ICD10) codes. Respondents who reported their main health condition was ‘diabetes’ (ICD10 Codes: E10–14, E74.8, E83.3) were considered to have ‘diabetes’. Thus respondents identified as (1) being out of the labour force due to their own ill-health or disability and who (2) reported having diabetes as their main condition, as defined above, were considered to have lost PLYs due to diabetes.
Economic costs
The following economic costs associated with lost PLYs due to diabetes are projected from 2015 to 2030: lost personal income, extra welfare payments and lost taxation revenue. Personal income consists of labour market earnings, income from other sources generating a return (such as rental properties, investments, interest on cash in bank) and welfare payments. The welfare payments in STINMOD relevant for Australians aged 45–64 years include: Aged Pension, Disability Support Pension, Newstart Allowance (for people looking for work), Carer Payment and Family Tax Benefit (http://www.humanservices.gov.au/customer/services). The taxes paid by individuals include personal income tax and the Medicare levy.
We calculated the impact of diabetes through lost workers on gross domestic product (GDP) using the Commonwealth Treasury's GDP formula: 1where GDP is gross domestic product; H is total hours worked; EMP is the total number of persons employed; LF is total labour force; and Pop15+ is population aged 15 years and over.27
Statistical analysis
Descriptive analyses were undertaken to establish patterns in the (mean and median) annual income, welfare payments and taxes paid by individuals aged 45–64 years with and without diabetes who are employed full-time, part-time and not in the labour force due to diabetes in 2015, 2020, 2025 and 2030. All figures are expressed in 2013 Australian dollars.
A quantile regression model for (median) weekly income was used to estimate the difference in income received by people in employment (full-time) without diabetes and those out of the labour force due to ill-health with diabetes as their main chronic condition in 2015, 2020, 2025 and 2030. Similar models were estimated for weekly (median) welfare payments and taxes paid. All models included age, sex and highest level of education as covariates.
The national impacts of diabetes, when it leads to an exit from the labour force among those aged 45–64 years, were projected from 2015 to 2030. 95% uncertainty intervals (UIs) were generated for these economic outcomes using bootstrapping with 1000 replications for each year.
All analyses were undertaken using SAS V.9.4 (SAS Institute, Cary, North Carolina, USA).
Results
Among the 25 104 respondents aged 45–64 years in the combined SDACs 2003 and 2009, 17 913 were in the labour force and 46 were out of the labour force due to diabetes (table 1). A further 1364 were out of the labour force due to ill-health and have conditions other than diabetes; and 5827 were unemployed or out of the labour force due to reasons other than ill-health.
Mean and median weekly income, welfare payments and taxes of individuals with and without diabetes as main chronic condition, Australian population aged 45-64 years (in 2013 $A) (unadjusted)
The weighted population aged 45–64 years was 5 583 500 in 2015. Of these, 3 038 700 (51.11%) were employed full-time without diabetes; 180 000 (3.03%) were employed full-time with diabetes; 1 141 400 (19.20%) were employed part-time without diabetes; 76 600 (1.29%) were employed part-time with diabetes; and 18 100 (0.30%) were out of the labour force due to diabetes (ie, lost PLYs due to diabetes) (table 1, 2nd column).
People who were out of the labour force due to their diabetes had a median weekly income (income derived from all sources including welfare payments) of $A393.15 in 2015 (expressed in 2013 dollars). Notably, their income was only 30% of the median weekly income of people employed full-time without diabetes (table 1, 5th column). People out of the labour force due to diabetes also had a lower median income compared to those with diabetes who were still able to work part-time ($A542.06) or full-time ($A1194.30). Of their total weekly income, people out of the labour force due to their diabetes received a median of $A340.91 in weekly welfare payments, whereas those in the labour force received $A0 in welfare payments in 2015. People out of the labour force due to their diabetes paid no median weekly taxes, whereas those employed in full-time work without diabetes paid $A238.49 per week in tax in 2015.
The population aged 45–64 years was projected to reach 6 690 100 by 2030. Of these, 3 722 100 (52.20%) people are employed full-time without diabetes; 256 800 (3.60%) are employed full-time with diabetes; 1 464 800 (20.54%) are employed part-time without diabetes; 111 200 (1.56%) are employed part-time with diabetes; and 21 400 (0.30%) are out of the labour force (lost PLYs) due to their diabetes. Those with lost PLYs due to diabetes are projected to receive $A385.04 in median income each week, $A321.87 in median welfare payments each week and pay $A0 in income taxes in 2030, expressed in 2013 dollars (table 1, last column).
Compared to people employed full-time without diabetes, those out of the labour force due to diabetes received $A665.06 (95% UI: $A553.82 to $A834.57) less in median weekly income (adjusted for age, sex and education) in 2015 (table 2, 1st column). They also received significantly more in welfare payments (an extra $A340.91 each week, 95% UI: $A238.50 to $A413.50) and pay significantly less in tax ($A153.81 each week, 95% UI: $A144.84 to $A190.77) compared to people employed full-time without diabetes.
Differences in median weekly income, welfare payments and taxes between individuals out of the labour force due to diabetes and those employed full-time without diabetes (adjusted for age, sex and education), Australian population aged 45-64 years (in 2013 $A)
The differences in median weekly income, welfare payments and taxes paid (adjusted for age, sex and education) between people with lost PLYs due to diabetes and those employed full-time without diabetes were also estimated for 2030 (table 2, last two columns). Lost income for people out of the labour force due to diabetes increased from $A665.06 each week in 2015 (95% UI: $A553.82 to $A834.57) to $A934.70 each week in 2030 (95% UI: $A827.68 to $A1095.37) in real terms, compared to the income of people employed full-time without diabetes. This increase was largely due to projected real growth in wages over the period, while no projected real growth in welfare payments for those not in the labour force due to diabetes. Historically earnings in Australia grow at a rate that is one per cent above inflation.28 ,29 People with lost PLYs due to diabetes paid $A153.81 each week (95% UI: $A144.84 to $A190.77) less in income taxes than those employed full-time without diabetes in 2015, increasing to $A210.61 each week (95% UI: $A198.50 to $A241.67) by 2030.
The national impact of diabetes when it causes lost PLYs consists of $A467 million (95% UI: $A340 million to $A662 million) in lost annual income in 2015, and is projected to reach $A807 million (95% UI: $A617 million to $A1065 million) by 2030—a 42% increase in lost income for this period (figure 2). Additional welfare payments associated with lost PLYs due to diabetes is projected to increase by 13% in real terms over the next 15 years, from $A311 million (95% UI: $A213 million to $A462 million) per year in 2015 to $A350 million (95% UI: $A245 million to $A546 million) in 2030 (figure 3). Finally, lost annual taxation revenue is projected to increase by 63% in real terms by 2030, from $A102 million (95% UI: $A82 million to $A139 million) in 2015 to $A166 million (95% UI: $A127 million to $A219 million) in 2030 (figure 4).

National lost income due to lost workers (full-time and part-time) because of diabetes per year ($A millions, with 95% uncertainty intervals).
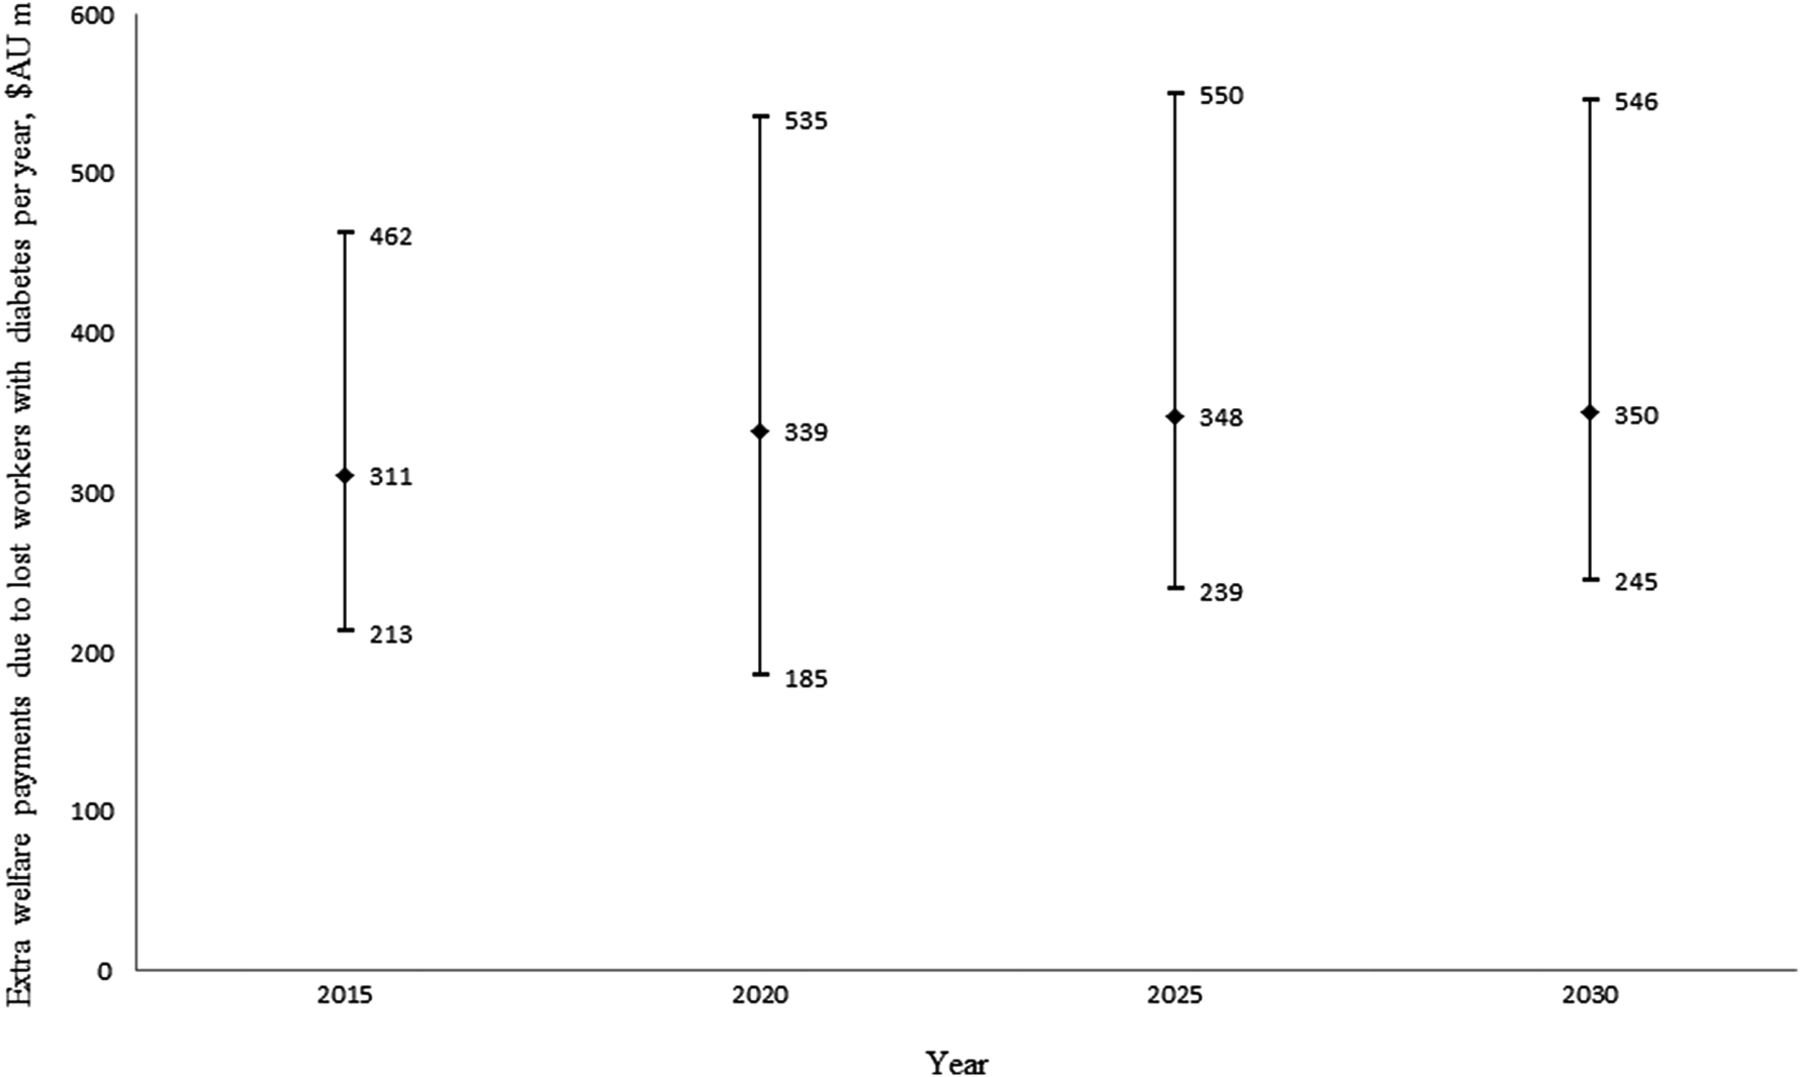
Extra welfare payments due to lost workers (full-time and part-time) because of diabetes per year ($A millions, with 95% uncertainty intervals).

National lost income tax revenue due to lost workers (full-time and part-time) because of diabetes per year ($A millions, with 95% uncertainty intervals).
Exits from the labour market because of diabetes also produce significant GDP losses each year (table 3), which were calculated in two stages. Using Health&WealthMOD2030, we calculated the number of workers (full-time or part-time) who are no longer working due to diabetes (missing workers) to be 17,600, 20,200, 20 900 and 20 900 in 2015, 2020, 2025 and 2030, respectively. Using Treasury's GDP formula, we calculated the GDP losses owing to missing workers due to diabetes to be $A2.1 billion, $A2.5 billion, $A2.7 billion and $A2.9 billion in 2015, 2020, 2025 and 2030, respectively. If these (potential) workers had their diabetes either prevented or treated to the point where they could remain in the work force, the predicted gain in GDP is up to 0.14% each year.
Lost gross domestic product owing to missing workers* aged 45–64 years due to diabetes, 2015–2030 ($A millions)†
Discussion
The direct (healthcare) cost of diabetes was $A811 million in 2000–2001, increasing to $A1507 million in 2008–2009—an increase of 86%. The majority of this health funding was spent on hospital stays and (prescribed) medicines, followed closely by non-hospital medical services (such as general practitioner, blood glucose testing, dietician).10 However, this study has demonstrated that the indirect costs of diabetes through lost productive life years are considerable, both at the individual and national level. People aged 45–64 years who exited the labour force because of their diabetes had a median weekly (personal) income of only $A393.15 in 2015, whereas those employed full-time without diabetes received an income over three times greater than this amount ($A1306.81). By 2030, the income gap between these two groups is projected to be even greater; with those out of the labour force due to their diabetes receiving an annual income four times lower than that of full-time workers without diabetes. The national impact of diabetes through the lost labour force participation of people aged 45–64 years is projected to reach $A807 million in lost income, $A350 million in extra welfare payments, $A166 million in lost taxation revenue and $A2.9 billion in lost GDP by 2030.
A number of overseas studies have also demonstrated that diabetes has a significant impact on labour force participation and earnings. For example, a Canadian study found that people with diabetes complications were twice as likely to be out of the labour force compared to non-diabetics in the working-age population.13 Similar findings (including valuing the lost productivity due to diabetes in terms of lost income, extra welfare payments) have been made in studies from the USA30–32 and Europe.33
This study has some limitations. Findings are based on SDAC respondents’ self-reported chronic disease and labour force status. Although self-reported health and employment status are regarded as valid measures for such studies,34 ,35 there is the potential for bias in results. The SDACs are cross-sectional data; however, several survey questions have been designed in such a way as to capture causal relationships. For example, the SDACs have ‘own ill-health or disability’ as a category for the main reason respondents are out of the labour force (a causal relationship).
The focus of this study was on the economic impacts of diabetes on individuals (such as lost labour force participation and lost income) and how their lost productivity translates into costs to government (lost income tax revenue, extra welfare payments) and society (lost GDP). While quantifying these indirect costs addresses some of the research gap, there are other costs that could also be considered such as informal carer costs. We did not seek to measure these additional costs in the present study; however, we note that our previous work on the lost labour force participation of people caring for someone with a chronic condition in Australia showed that 60% of primary carers caring for someone with endocrine/nutritional and metabolic disorders (ie, thyroid, diabetes and high-blood pressure) were not in the labour force, which placed this disease group as the fifth top work-limiting conditions for caregivers.36 Thus the indirect costs of diabetes are likely to be even larger after taking more of these types of costs into account.
With the health burden of the condition being so large, the total cost of diabetes (direct and indirect costs) for national governments is correspondingly significant and thus an issue requiring urgent policy attention.3 ,14 Consequently, several governments (such as The Fit for Work Europe Coalition) have put forward the case for counting labour productivity as a relevant outcome measure in health investment decisions, especially decisions involving patients with long-term health conditions.37
The ageing of the global population has also highlighted the need to focus on the retention older workers.38 In Australia, 4.15% of people aged 45–64 years who have diabetes are not in the labour force, representing a pool of people who might have worked had they not had this condition.39 Australia, like most other developed countries, will need to maximise the labour force participation of its older workers in order to have sufficient taxation revenue from which to fund the healthcare and services used by the ageing population.40
Several randomised controlled trials have demonstrated that lifestyle and pharmacological (metformin) interventions are effective in preventing or delaying type 2 diabetes in high-risk individuals (ie, people with impaired fasting glucose or impaired glucose tolerance).41–43 Bertram et al (2010) assessed both the health effects and direct (medical) costs of a number of interventions to prevent diabetes. The authors concluded that screening to identify people with pre-diabetes, followed with treatment using metformin or diet and exercise for those at risk were the most cost-effective interventions in preventing or delaying the onset of the disease.44 A recent Australian economic study has shown that diabetes prevention interventions using screening and treatment (metformin or a lifestyle intervention targeting diet and exercise) in pre-diabetic adults (aged 45–64 years) could increase labour force participation and reduce income losses.45
Reduced income among those who have to exit from the labour force due to their diabetes can also lead to inadequate (personal) finances for basic healthcare and services.46 A study from the USA found a high correlation between chronic illness and financial stress, with one-quarter of bankruptcies attributable to chronic illness.46 A recent study from Australia has shown that while everyone employed full-time or part-time in 2010 has accumulated some savings at the traditional retirement age of 65 years mainly due to compulsory superannuation savings, only 91% of people who are out of the labour force due to diabetes have accumulated some savings by age 65 years,15 leaving them with minimal savings to cover the higher healthcare costs incurred in old age.
Diabetes is increasing in prevalence worldwide. It is also becoming more common among the working-age population, particularly those aged 45–64 years.30 Consequently, the negative impact of diabetes on labour force participation and the magnitude of the related costs (lost income, extra welfare payments, lost taxation revenue, lost GDP) will increase over time. To reduce the substantial costs of early retirement due to diabetes, investment in disease prevention is needed, which is aligned with the health platform of the current Australian Government in recognising that chronic disease prevention helps to increase labour force participation. It is acknowledged that prevention will improve the health of the general population and help to maintain economic growth by sustaining human resources in production, as well as helping future governments ensuring they have sufficient revenue to fund the healthcare needs of the ageing population.40
References
Footnotes
Contributors DS conceived and led the study. DS, RNS, MEP, JLV, SJK, RT made substantial contributions to study conception and design. DS, RNS, RT, JLV, SJK made substantial contributions to acquisition of data. RNS, MMC analysed data and DS, RNS, MMC, JLV, SJK, RT, MEP made substantial contributions to the interpretation of the results. MMC wrote the first draft of the article and DS, MMC, RNS, RT, JLV, SJK, MEP were responsible for drafting the article or revising it critically for important intellectual content. DS, RNS, SJK, RT, JLV, MEP developed Health&WealthMOD2030. All authors gave final approval of the version of the article to be published.
Funding The development of the microsimulation model used in this research, Health&WealthMOD2030, is funded by the Australian Research Council Linkage Project grant (under grant LP100100158). Pfizer Australia is a partner to the grant. MP is supported by fellowships from the NHMRC, the Cancer Institute NSW and the Sydney Medical School Foundation.
All authors are independent from the funding sources, and the funding sources (including Pfizer Australia) played no part in the research design, analysis, formulation or interpretation of the results, decision to publish the findings, nor any other part of the research process.
Competing interests None declared.
Ethics approval The use of the ABS SDAC 2003, 2009 data was approved by the ABS Microdata Review Panel.
Provenance and peer review Not commissioned; externally peer reviewed.
Data sharing statement No additional data are available.