Article Text

Abstract
Objective To assess the effect of coding quality on estimates of the incidence of diabetes in the UK between 1995 and 2014.
Design A cross-sectional analysis examining diabetes coding from 1995 to 2014 and how the choice of codes (diagnosis codes vs codes which suggest diagnosis) and quality of coding affect estimated incidence.
Setting Routine primary care data from 684 practices contributing to the UK Clinical Practice Research Datalink (data contributed from Vision (INPS) practices).
Main outcome measure Incidence rates of diabetes and how they are affected by (1) GP coding and (2) excluding ‘poor’ quality practices with at least 10% incident patients inaccurately coded between 2004 and 2014.
Results Incidence rates and accuracy of coding varied widely between practices and the trends differed according to selected category of code. If diagnosis codes were used, the incidence of type 2 increased sharply until 2004 (when the UK Quality Outcomes Framework was introduced), and then flattened off, until 2009, after which they decreased. If non-diagnosis codes were included, the numbers continued to increase until 2012. Although coding quality improved over time, 15% of the 666 practices that contributed data between 2004 and 2014 were labelled ‘poor’ quality. When these practices were dropped from the analyses, the downward trend in the incidence of type 2 after 2009 became less marked and incidence rates were higher.
Conclusions In contrast to some previous reports, diabetes incidence (based on diagnostic codes) appears not to have increased since 2004 in the UK. Choice of codes can make a significant difference to incidence estimates, as can quality of recording. Codes and data quality should be checked when assessing incidence rates using GP data.
- PRIMARY CARE
- Data quality
- Misclassification
This is an Open Access article distributed in accordance with the Creative Commons Attribution Non Commercial (CC BY-NC 4.0) license, which permits others to distribute, remix, adapt, build upon this work non-commercially, and license their derivative works on different terms, provided the original work is properly cited and the use is non-commercial. See: http://creativecommons.org/licenses/by-nc/4.0/
Statistics from Altmetric.com
Strengths and limitations of this study
First study to investigate the effects of GP coding practices on the incidence of diabetes in the UK.
Findings based on a large primary care database representative of the UK population.
Investigates the effect of coding on recorded incidence rates since 1995.
No external source of data to verify our findings since most official statistics on diabetes are based on GP records.
Algorithms to label misclassified patients possibly imperfect.
Introduction
Although results of analyses are only as good as the data that they are based on, the effect of data quality on the results of health research studies is seldom quantified, particularly if there is no gold standard measure to validate the results.
Clinical Practice Research Datalink (CPRD) primary care electronic healthcare records (EHR) span events, including diagnoses, symptoms, test results, prescriptions and patient history, and are coded using the hierarchical system of Read Codes, the standard clinical terminology system for General Practice in the UK. Such data provide a longitudinal picture of patient care over time and can be used to improve patient care directly through effective monitoring and identification of care requirements, and indirectly via clinical and service-model research.1
We recently carried out an extensive investigation of code use in the CPRD primary care database and have developed an approach for measuring data quality in EHR databases which can be tailored to the intended use of the data.2 ,3 The approach is based on six key characteristics (dimensions) of good quality data: accuracy, validity, reliability, timeliness, relevance and completeness. After identifying the most important variables needed for the study in question (based on the study protocol), data quality measures are extracted for each relevant dimension.
The database known as CPRD GOLD contains data from GP practices using Vision software. Recently, CPRD has started collecting data from practices using EMIS GP software in addition to Vision. Here, we looked at data from practices using the Vision software only. We extracted measures representing different dimensions of data quality, including missing data and completeness of the codes used, and discovered that these measures vary widely between and within practices and over time. We concluded that data quality characterisation requires a flexible study-specific approach that takes into account the research questions being posed and the types of data that will be used to answer them.
The next step is to determine how poor data quality impacts results, using case studies. Most research studies and official statistics using GP records are based on coded data, so in this paper, we focus our investigation on the quality of coding. We examine how the use of Read codes to record a diagnosis of diabetes has changed between 1995 and 2014 and how miscoding and misclassification affect incidence estimates between 2004 and 2014.
Diabetes is a growing problem worldwide and is the subject of many epidemiological and pharmacological studies. However, these studies may be undermined if there are variations in recording of the routine data which are used to study the disease.4 ,5 This may also affect treatment choices, risk management and information sharing between primary and secondary care settings. Furthermore, the combination of miscoding (an incorrect or vague Read code applied in patient record) and misclassification (incorrect classification of a patient's diabetes type) may undermine measures of the quality of care based on routine data.4 We chose to measure incidence as it is relatively simple to calculate and therefore possible to gauge the effects of poor data quality and also because very few studies have investigated the trends in incidence of diabetes in recent years,6 and there is some conflicting evidence in those that have.7–9 Statistics on the incidence of diabetes are very sparse, and most bodies only publish prevalence figures, including Diabetes UK.10
Problems with miscoding and misclassification of diabetes are well known,11 especially before 2004 when the UK Quality and Outcomes Framework (QoF) was introduced;12 a scheme whereby GPs are partly funded through the achievement of targets. QoF has been found to influence clinicians’ code selection and, in some illnesses, quality of care.13 Diabetes was first included in QoF in 2004 when codes beginning with C10 were used to identify patients with diabetes. According to the Read code system, diagnoses codes start with capital letters with codes pertaining to a diabetes diagnoses using the letter C as the starting letter. In 2006, a refinement to QoF definitions required type to be included (C10E0 to C10EP for type 1 and C10F0 to C10EQ for type 2). Researchers have tried to deal with miscoding, such as non-specified diabetes type, and misclassification of type 1 and type 2 diabetes, via a wide range of methods, including incorporating treatment and prescription history.7 ,14 ,15 However, as far as we are aware, no one has assessed the effect of miscoding and misclassification on incidence rates obtained from EHR data.
This study has two parts. In the first, we investigate the recorded incidence of type 1 and type 2 diabetes according to different categories of Read codes. In the second, we assess how dropping practices with over 10% of patients misclassified or miscoded between 2004 and 2014 impacts estimates of the incidence rate of type 2 diabetes. We selected type 2 for this part of the analysis as the incidence is much higher than that of type 1, and, in contrast to type 1, appears to have been increasing in recent years.
Methods
The effect of quality and trends in coding was assessed by:
Construction of a hierarchical code list for identifying diabetes patients and a broader list of indicator codes for patients that may have diabetes.
Calculation of the incidence rate for each year for each category of codes for all practices contributing to the CPRD primary care database for each year between 1995 and 2014.
Investigation of the distributions of incidence rates in the different categories over time.
Determination of the effect of variation in coding quality for diabetes by labelling GP practices as ‘good’ or ‘poor’ quality using an algorithm proposed and validated by de Lusignan et al,11 which uses diagnosis codes, prescribing information and information from tests to identify cases that are misclassified or miscoded.
Developing the code list
All potential Read codes for diabetes were identified and divided into four categories. The code list was created iteratively, using Stata code. A string matching approach was used to find Read terms mentioning diabetes and its type. Type 1 was defined as ‘Type 1’ or insulin-dependent diabetes; Type 2 as ‘Type 2’ or non-insulin-dependent. These Read terms were manually inspected and the program was adapted to exclude terms such as fh: diabetes (fh=family history), gestational diabetes, diabetes monitoring and other similar ambiguous terms. The list was then merged with a CPRD-provided code list used in a recent study and examined. Relevant Read terms mentioning diabetes (but not those only mentioning glucose levels) that had been missed were added to the list. The Read terms and associated Read codes were then grouped into categories. The code list takes this format
| Code | Description | Category |
Where category is
Type 1 with a diagnostic (C) code
Type 2 with a diagnostic (C) code
General C code—type not specified
No C code, but code suggests a diagnosis of diabetes (eg, ‘Diabetes mellitus with unspecified complication’. ‘Seen in diabetic clinic’) or diabetes is strongly implied (eg, ‘Cellulitis in diabetic foot’, ‘Diabetic nephropathy’)
The codes and categories are provided in the online supplementary material.
supplementary material
Data
All 684 practices (of the March 2015 version of CPRD) that have contributed data to the CPRD using the Vision EHR software on or after 1995 were included in the study. This included practices for which the CPRD practice-based quality marker, the Up-to-Standard (UTS) date indicating when a practice is considered to have continuous and complete recording of patient data, was later than 1995. Patients who were not permanently registered with the GP practice (eg, patients using temporary resident services) were excluded.
Measuring incidence
The code list was used to find all clinical, referral and test type records with a matching code and, for each patient, the first event date in each of the four categories, plus the Read code issued, was extracted. The first event date (independent of category) was set as the patient's index date. Each patient was then classified according to the minimum category in the above list. So, for example, if a patient had a code for category 1 they are classified as category 1, even if they also have a code for type 2—with the index date being the earliest date that type 2 or type 1 was recorded. A patient with only a code for category 4 would be classified as category 4, etc. The incidence of diabetes, according to each category for each year, was evaluated by determining the number of patients classified in each category, or combination of categories (for total incidence) and dividing this by the total person months for that year. Cases with <365 days between index date and their current registration were excluded, as they are likely to have been diagnosed with diabetes prior to registration.
Assessing the effect of misclassification and miscoding on incidence of type 2 diabetes
Practices were labelled as either ‘good’ or ‘poor’ quality for diabetes coding and the impact on incidence of excluding ‘poor’ practices was assessed. Misclassified and miscoded patients and patients apparently misdiagnosed as either having diabetes or not were identified using an algorithm proposed by de Lusignan et al11 which uses prescribing information and test results to query the validity of the application of diabetes C codes (note we consider only categories 1–3 here). Practices are defined as ‘poor’ if they have at least 10% cases flagged as problematic, according to the algorithm, between 2004 (when the Quality Outcomes Framework (QoF) incentives for diabetes coding were introduced) and 2014. Problematic cases were identified as follows:
Misclassification of type 1 diabetes (patient should be classified as type 2)
Patients with a diagnosis of type 1 diabetes who have never been prescribed insulin
Patients with a diagnosis of type 1 diabetes prescribed insulin and an oral antidiabetic medicine (excluding metformin) prescribed later than insulin. Patients with type 1 diabetes should not routinely be concurrently prescribed an oral antidiabetic medicine, an exception being metformin for weight loss
Patients with a diagnosis of type 1 diabetes prescribed insulin and an oral antidiabetic medicine (excluding metformin) where the oral medicine was prescribed prior to insulin and insulin is not prescribed within 6 months of diagnosis. Patients with type 1 diabetes who started their oral antidiabetic medicine before insulin should have started insulin within 6 months of diagnosis
Misclassification of type 2 diabetes (patient should be classified as type 1)
Patients with a diagnosis of type 2 diabetes (that is, patient whose has a code for type 2, but no code for type 1 (minimum category as defined in the section on measuring incidence).) who have been prescribed insulin within 6 months of diagnosis.
Misdiagnosis of type 2 diabetes (patient should not have a diabetes diagnosis)
Patients with a diagnosis of type 2 diabetes with none of the following: a prescription for insulin, a prescription for oral antidiabetic medicine (excluding metformin), an abnormal plasma glucose test (≤7.0 mmol/L), an abnormal HbA1c test (≤48 mmol/mol)
Non-diagnosis of type 2 diabetes (false negatives)
Patients prescribed an oral antidiabetic medicine (excluding metformin) but who do not have a diagnosis of diabetes.
Miscoding in diabetes
Patients with vague diagnosis codes only (eg, C100z ‘Diabetes without mention of complications’), which inform the patient has diabetes but where type cannot be classified. This is considered category 3 in our classification above.
Only patients with at least 6 months follow-up after diagnosis were checked for the last item in part 1 and for part 2. We calculated the proportion of patients with problematic coding as the proportion of all patients with a C code plus false-negative patients with first diagnosis (or misdiagnosis code) between 2004 and 2014.
Statistical analysis
Statistical analyses were performed with Stata V.13 (Stata Corp. 2013. Stata Statistical Software: Release 13. College Station, Texas, USA: StataCorp LP). Descriptive summary statistics and visualisation methods were used to investigate different coding and trends in incidence. Overall percentages, means and medians for each year were calculated using the Stata ‘collapse’ command. To investigate the effect of poor data quality on the incidence rate, we estimated the incidence for each year, as defined by QOF (ie, diabetes diagnosis codes with type included) for ‘good’ and ‘poor quality’ practices separately. A linear regression model was used to determine if the differences in incidence rates for ‘good’ and ‘bad’ practices were statistically significant. Non-linear terms for year and an interaction between group and year were included in the model, which was adjusted for repeated measures (for practices) using the Stata ‘cluster’ command. A non-parametric trend test was used to ascertain the significance level of the trend in overall incidence in (1) the whole population and (2) the subset of the population which excludes ‘poor’ practices.
Analytic weights (Stata's aweights) were used for all practice-based analyses to adjust for the practice size.
Results
Four hundred and eleven of the 684 practices contributed data continuously from 1 January 1995 to the end of December 2014. The median number of patients per practice increased by 37% in this period and the number of patients with an incident code more than doubled (table 1).
Summary statistics for number of practices that contributed data (for at least part of the year) and patients in 1995 and 2014
Read code use
Table 2 shows the change in code usage between 1995 and 2004. In 1995 and 2004, the most commonly used Read term was ‘Type 2 diabetes mellitus’ (Read code C10F); the second most common was ‘Diabetes mellitus’ (Read code C10) in 1995 and ‘Seen in diabetes clinic’ (Read code 9N1Q) in 2014. Within each category, there was little variation in code use in each year, with the top three codes representing at least 69% of codes extracted in 1995 and 90% of codes extracted in 2014.
The three most commonly extracted Read terms in 1995 and 2014 for (1) any category and (2) for each category 1–4
Practice variation
Incidence rates varied widely between practices for each category (figure 1), particularly for category 2 (type 2) and category 4 (diabetes inferred). There was a relatively large number of outlying practices which had a much higher rates, including some not shown in the figure, with incidence rates of over 2000 per 100 000 in some years (which might be due to incorrect dates if records were added retrospectively). Variation between practices (as indicated by the relative sizes of the boxes) increased markedly for category 4 between 2005 and 2009.

Distribution of the practice incidence of diabetes per 100 000 according to the different code categories between 1995 and 2014. Some very extreme values ( >1000) have been removed for clarity of presentation.
In order to see if we could explain the large increase in variation (and also incidence) in category 4 after 2005, we split category 4 into two subcategories: 4a and 4b. Subcategory 4b contained codes with ‘seen’ in the Read term, for example, ‘seen in diabetes clinic’ or ‘seen by diabetic nurse’. Although suggestive of a diabetes diagnosis, they could also indicate monitoring of patients at risk of diabetes.
Overall incidence in each category
Table 3 shows the overall incidence rates over time for each of the four categories, with category 4 split into 4a and 4b. For those patients with a diagnosis code, the incidence of type 1 diagnosis increased from 1995 to 2000 but then decreased quite steeply from 2001 to 2014. Conversely, for type 2, the incidence increased from 1995 to 2004 after which it levelled off and slightly decreased between 2010 and 2014. Category 3 (C code no type) shows a decrease until 2006 when it then levels off and increases slightly again after 2011. For category 4, where there was no diagnosis code, the large increase after 2006 was accounted for by the large increase in ‘seen in diabetic clinic’ code.
Incidence rates per 100 000 between 1995 and 2014 for the different code categories
In order to see if we could explain the decrease in incidence of type 1, we investigated cases who had a diagnosis of type 1 and type 2 diabetes, but who were classified as type 1 by our algorithm. Almost 40% of type 1 with a first diagnosis in 1995 were in this category, but this percentage decreased almost linearly with year to <10% in 2014. When these cases were excluded, the incidence (per 100 000) in 1995 (12.1) was similar to that in 2012 (12.3) with a slight decrease in 2013 (11.2) and 2014 (10.5).
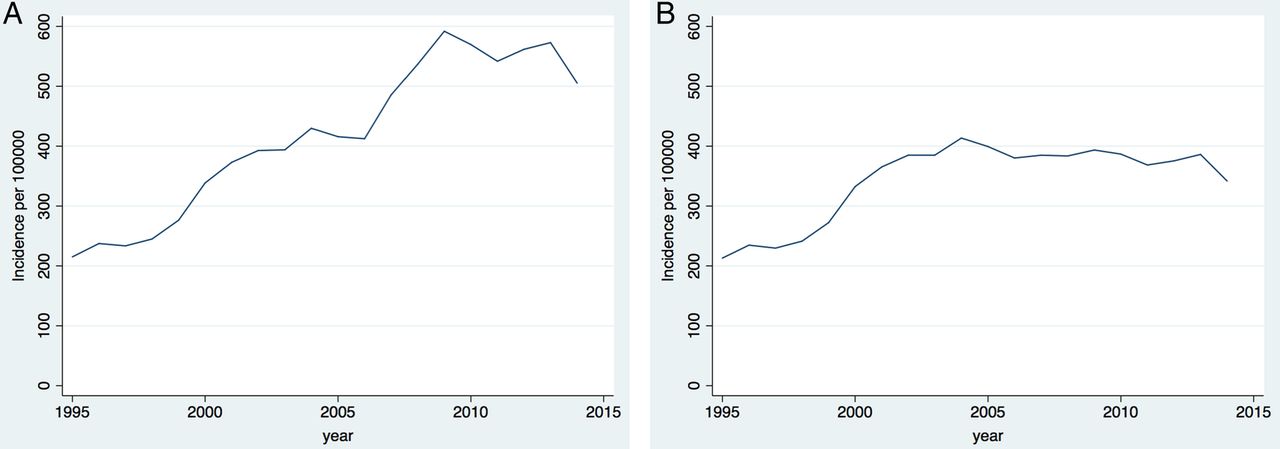
Removing codes in category 4b had a big effect on the incidence rates of category 4 and also of all categories combined (figure 2). When these codes are included, the incidence (using all codes) increases until 2009 to nearly 600 per 100 000 before levelling off, whereas when they are excluded, the incidence levels off at just under 400 per 100 000 after 2004.

Incidence of diabetes per 100 000 between 1990 and 2013 for (A) all codes and (B) all codes excluding codes with the word ‘seen’ in the code description.
Effect of misclassification and miscoding on incidence of type 2 diabetes
Rates of misclassification and miscoding varied widely between practices, but variation and error rates generally decreased over time (figure 3). The overall number of patients miscoded, misclassified or misdiagnosed (in categories 1–3) per 100 000 halved from 60 in 1994 to 30 in 2014. Of the 666 practices that contributed data for at least some point between 2004 and 2014, 102 (15%) had at least 10% of their diagnosed diabetes patients misclassified or miscoded during this period. The number of patients misclassified (categories 1–4) per 100 000 halved from 60 in 1994 to 30 in 2014.

Distribution of patients per practice with incorrect diabetes coding according to de Lusignan algorithm. (Some very extreme values have been removed for clarity of presentation.) Categories: (1) misclassification of type 1, (2) misclassification 2, (3) misclassification of type 2 (false positives) and (4) non-diagnosis of type 2 (false negatives). (Category 5 is not shown as it is the same as Read codes category 3).
How dropping ‘poor’ quality practices affects type 2 diabetes incidence rates
‘Poor’ practices had a lower incidence than ‘good’ practices with a steeper downward trend (from 340/100 000 in 2004 to 245/100 000 in 2014).
The regression model confirmed that incidence is significantly lower (p=0.001) for ‘poor’ practices than ‘good’. Incidence decreased linearly with year (p≤0.001) between 2004 and 2014 (non-linear terms for year were not significant). Adding an interaction term between year and type of practice indicated that the rate of decrease differed significantly between the two groups (p=0.005).
A trend test of the overall incidence of diabetes type 2 with year between 2004 and 2014 was significant at the 0.05 level for ‘all’ (p=0.035) but not significant at this level for ‘good’ practices (p=0.096).
These results show that including practices with poor quality recording can affect the incidence rates and trends and may lead to different conclusions. If poor quality practices are excluded, incidence rates are higher and the evidence for a downward trend in incidence is weaker.
Discussion
This study, based on a large database of GP records, shows that the choice of Read codes used to define a diagnosis of diabetes can make a big difference to incidence estimates. If diagnosis codes alone are used, the incidence of diabetes cases per 100 000 in the UK appears to have increased between 1995 and 2002, peaking at just below 400 in 2004 and slightly decreasing since then. However, if non-diagnostic codes are included, rates appear to have increased sharply from just above 400 in 2006 to just under 600 in 2009 and remained at over 500 thereafter.
The results based on diagnosis codes confirm other reports that diabetes incidence has not increased in recent years in developed countries,6 including a recent report from the UK.16 The results using the broader Read code list mirror those obtained by Holden et al7 who observed a similar large increase in type 2 diabetes from 2006 to 2009. The increase in the number of patients with suggested diabetes after 2006 appears to be due to the greatly increased use of the code ‘seen in diabetes clinic’. This is in line with the large increase in the incidence of ‘pre-diabetes’.9
The choice of practices to include in the analysis also affects the incidence estimates of type 2 diabetes. Our analysis shows that including ‘poor’ quality practices may lead to erroneous conclusions about incidence rate and trends. There is a high level of variability between practices in miscoding/misclassification rates and, even since QOF was introduced, many practices still use indeterminate codes, which, while they almost disappeared after the case definition for diabetes was changed in 2006 (see below), have been creeping up again in recent years. The usefulness and accuracy (quality) of codes also depends on the team entering them,17 the clinicians’ IT skills,18 time,19 certainty of diagnosis,20 how important they believe coding is20 and organisational issues.20
There is also large variation between practices in the recorded number of patients with a diagnosis code each year, with some practices having a much higher incidence than others. This may be partly due to incorrect dates—for example, we noticed that some practices had large spikes in new diabetes patients on certain dates, which might be due to retrospectively entering the code with the incorrect date.
The decrease in incidence in category 1 (type 1) was found to be due to better coding in more recent years, with an inflated incidence in earlier years due to miscoding type 2 cases as type 1.
Strengths and limitations
This is the first study to investigate the effects of GP coding practices on incidence rates of diabetes in the UK, using a large primary care database, which is representative of the UK population. Our findings show the importance of investigating and identifying poor coding when making conclusions based on GP records. A limitation of this study is that there is no external source of data to verify our findings since (a) most authorities on diabetes (eg, Diabetes UK) only publish prevalence rates and (b) most official statistics on diabetes are based on Read codes in GP records, so any external validation would be self-referencing. Since it was not possible to verify the status of individual patients, we had to use possibly imperfect algorithms to label misclassified patients, which will inevitably mean that we will have mislabelled some patient records, for example, if a therapy prescription is made during a hospital visit, this patient would be misclassified by our algorithm. However, we suggest that this would be infrequent and would not affect our overall findings.
Implications
Our research has identified the impact of miscoding and misclassification on the recorded incidence of diabetes. It is likely that similar trends, errors and variations exist for other conditions, potentially more so where coding is not incentivised. A number of developments have been implemented or are intended on a national scale that may impact on this in future.
The last release of V2 Read codes took place in April 2016 and the final release of CTV3 is planned for April 2018. This will herald the transition to SNOMED-CT.21 While this will allow more precise coding, it risks overwhelming practitioners with choice due to its broader dictionary of terms. To improve the quality of database research, we must focus on improvements in data entry at the point of care. Understanding how data are recorded and used in general practice was introduced as a core competency in the 2016 RCGP training curriculum.22 Although trainees make up a significant proportion of the workforce, the bulk of EHR data entry is performed by qualified GPs. Previous experience with QoF13 suggests that data quality can be improved through financial incentives. The expansion of quality indicators across wider clinical conditions could provide an improvement in data quality; however, further targets may not be readily embraced by the workforce at this time.
Alternatively, software improvements to present the practitioner with preferred terms could provide significant improvements in data entry and are more in line with ‘nudge’ techniques used in population health.23 In the meantime, research of large primary care data sets should ensure that code lists are optimised to account for recording variations and, where possible, be validated against real clinical practice. Reporting error measurements to account for miscoding and misclassification should be included in future studies to provide a truer presentation of results.
Conclusion
Our aim was to assess the effect of poor data quality around term selection by GP on results. For this case study, we picked diabetes incidence as a computationally simple example which, despite being straightforward to calculate, is not very often reported due to the difficulty of pinpointing the exact date of disease diagnosis. We found that the choice of code list made a huge difference to the results, and the incidence was inflated when we included Read codes which suggested monitoring of possible diabetes, rather than a diagnosis itself. We suggest that if these codes are to be included as indication of diagnosis, the diagnosis should be confirmed with test results and prescribing information as was performed by Sadek et al14 for diagnosis codes.
Acknowledgments
The authors thank Andy Lawson for his help with the diabetes code list.
References
Footnotes
Contributors ART conceived and designed the research project with input from TW, RW and NB. ART and SD carried out the analysis. SG provided clinical input and advised on the codelists and categorisation of codes. ART and RW provided statistical expertise. ART, SG and SD drafted parts of the article, and all authors revised it critically for important intellectual content.
Funding The authors would like to acknowledge the financial support of the Technology Strategy Board ‘Harnessing large and diverse sources of data’. Project Number 100926. ART and NB received financial support, in the form of a fellowship, from the Medicines and Healthcare products Regulatory Agency.
Competing interests None declared.
Ethics approval We used a fully anonymised data set from the General Practice Research Database. We did not obtain participant's consent because the participant data were taken from the fully anonymised data set and no participant's identity details were revealed. There was no need for participant consent. The study was approved by the Independent Scientific Advisory Committee (ISAC) of the Medicines and Healthcare products Regulatory Agency (MHRA) (protocol 15_010R entitled ‘Diabetes incidence in the UK from 1995 to 2014: how does quality of GP recording affect the estimates?’).
Provenance and peer review Not commissioned; externally peer reviewed.
Data sharing statement Owing to ethical restrictions, data are available from the Clinical Practice Research Datalink from kc@cprd.com—the CPRD knowledge centre or from the coauthors that are affiliated with the CPRD. Anyone who would like to use CPRD data will need to first submit an application to the Independent Scientific Advisory Committee (ISAC) of the Medicines and Healthcare products Regulatory Agency (MHRA) http://www.cprd.com/ISAC/.