Article Text

Abstract
Objectives A recent individual patient data (IPD) meta-analysis suggested that patients with moderate or severe acute respiratory distress syndrome (ARDS) benefit from higher positive end-expiratory pressure (PEEP) ventilation strategies. However, thresholds for continuous variables (eg, hypoxaemia) are often arbitrary and linearity assumptions in regression approaches may not hold; the multivariable fractional polynomial interaction (MFPI) approach can address both problems. The objective of this study was to apply the MFPI approach to investigate interactions between four continuous patient baseline variables and higher versus lower PEEP on clinical outcomes.
Setting Pooled data from three randomised trials in intensive care identified by a systematic review.
Participants 2299 patients with acute lung injury requiring mechanical ventilation.
Interventions Higher (N=1136) versus lower PEEP (N=1163) ventilation strategy.
Outcome measures Prespecified outcomes included mortality, time to death and time-to-unassisted breathing. We examined the following continuous baseline characteristics as potential effect modifiers using MFPI: PaO2/FiO2 (arterial partial oxygen pressure/ fraction of inspired oxygen), oxygenation index, respiratory system compliance (tidal volume/(inspiratory plateau pressure−PEEP)) and body mass index (BMI).
Results We found that for patients with PaO2/FiO2 below 150 mm Hg, but above 100 mm Hg or an oxygenation index above 12 (moderate ARDS), higher PEEP reduces hospital mortality, but the beneficial effect appears to level off for patients with very severe ARDS. Patients with mild ARDS (PaO2/FiO2 above 200 mm Hg or an oxygenation index below 10) do not seem to benefit from higher PEEP and might even be harmed. For patients with a respiratory system compliance above 40 mL/cm H2O or patients with a BMI above 35 kg/m2, we found a trend towards reduced mortality with higher PEEP, but there is very weak statistical confidence in these findings.
Conclusions MFPI analyses suggest a nonlinear effect modification of higher PEEP ventilation by PaO2/FiO2 and oxygenation index with reduced mortality for some patients suffering from moderate ARDS.
Study registration number CRD42012003129.
- ARDS
- acute lung injury
- treatment interaction
- multivariable fractional polynomials
- IPD meta-analysis
This is an Open Access article distributed in accordance with the Creative Commons Attribution Non Commercial (CC BY-NC 4.0) license, which permits others to distribute, remix, adapt, build upon this work non-commercially, and license their derivative works on different terms, provided the original work is properly cited and the use is non-commercial. See: http://creativecommons.org/licenses/by-nc/4.0/
Statistics from Altmetric.com
Strengths and limitations of this study
This individual patient data meta-analysis of critically ill patients with acute respiratory distress syndrome (ARDS) investigated possible interactions between continuous baseline characteristics and ventilation strategies.
We used multivariable fractional polynomials interaction analyses to create treatment effect functions for qualitative assessment of the interactions; results suggest a benefit of higher positive end-expiratory pressure (PEEP) in patients with moderate ARDS, but uncertainty remains.
Although over 2000 patients from three randomised trials were included, the study may still be underpowered for analysis of interaction.
The findings need further validation in external data sets to definitively inform clinical decision-making
Background
Acute respiratory distress syndrome (ARDS) carries a high mortality risk of over 40%.1 ,2 The ARDS definition task force proposed three stages of ARDS severity based on degree of hypoxaemia: mild (200 mm Hg<PaO2/FiO2≤300 mm Hg), moderate (100 mm Hg<PaO2/FiO2≤200 mm Hg) and severe (PaO2/FiO2<100 mm Hg).3 Low tidal volumes and low inspiratory pressures are considered standard to prevent lung injury,4 ,5 but the optimal level of positive end-expiratory pressure (PEEP) remains under debate. We recently conducted a systematic review and individual patient data meta-analysis (IPDMA) of three randomised clinical trials and concluded that across all patient groups, higher PEEP ventilation strategies are not clearly better than lower PEEP levels in ventilated patients. However, within the predefined subgroup of patients who had moderate or severe ARDS (PaO2/FiO2<200 mm Hg), results suggested a benefit of high PEEP across a number of outcomes including time-to-unassisted breathing and hospital mortality.6 In this previous review, we used an accepted 200 mm Hg threshold7 to examine this subgroup of patients with ARDS and used conventional statistical tests for interaction; we also assessed interactions with other continuous variables, such as body mass index (BMI), by assuming linearity or categorising them into quintiles.
For continuous variables, creating categories of subgroups remains the usual approach to investigating a potential treatment-modifying effect (subgroup effect).8 ,9 However, critics have pointed out serious weaknesses in the categorisation approach.10–13 Methodological concerns regarding creating dichotomies or discrete categories of an inherently continuous predictor (eg, PaO2/FiO2, age or BMI) include: dependence of the statistical significance on the number and position of the chosen cut-points, loss of statistical power and faulty interpretation of the results if a nonlinear association is incorrectly assumed to be linear.14 One of the main recommendations in a series of four papers from the PROGnosis RESearch Strategy (PROGRESS) group15 states: ‘Standards in statistical analyses of prognosis research should be developed which address the multiple current limitations. In particular, continuous variables should be analysed on their continuous scale and nonlinear relationships evaluated as appropriate’. To address the latter point, Royston and Sauerbrei13 proposed the multivariable fractional polynomials interaction (MFPI) approach to investigate potential treatment modifying effects in a clinical trial. MFPI estimates a continuous function to quantify the relative effect of two treatments depending on a continuous predictor of interest (treatment effect function, TEF). This TEF can be helpful for informed decision-making.
Analyses of interactions are interesting for single trials, as well as highly relevant for meta-analyses. Sutton et al16 have provided a comprehensive overview of many issues and developments in meta-analysis. However, approaches to combine results from several studies in a summary estimate of the functional relationship between a continuous covariate and an outcome have received more attention only in recent years. In the context of continuous risk or prognostic factors, Sauerbrei and Royston17 have proposed a new strategy for meta-analysis of functions, provided individual participants data (IPD) are available for the estimation of functions in each of the studies. Obviously, this meta-analysis approach can also be used to derive an averaged TEF summarising single TEFs from several MFPI analyses of randomised trials. To improve on several critical issues from cut-point-based meta-analyses, we started this project. The key ingredients were all available: IPD from all randomised trials for a specific treatment comparison, the MFPI approach to estimate a TEF in each study, the meta-analysis approach to average several TEFs across studies and the required software.18 In 2012, four of us have registered the protocol of this study (ICEM study) which was extended to a publication.19
In the present study, we reanalysed data of our previously reported IPDMA6 with respect to hospital mortality, time-to-death and time-to-unassisted breathing. We used the MFPI approach to derive a TEF function for each study separately and derive an averaged TEF function with the meta-analysis approach for functions. On the basis of earlier analyses and general discussions in the literature, we hypothesised that patients with a low PaO2/FiO2 or high oxygenation index and still good respiratory system compliance at baseline (moderate ARDS) have the most recruitable lung units and would therefore benefit most from higher levels of PEEP. For patients at either end of the spectrum (mild ARDS or very severe ARDS), higher PEEP might not provide any benefit. We did not anticipate any specific direction of interaction effect for BMI.
Patients and methods
The rationale and methodological background of this study have been described elsewhere;19 the protocol is registered with PROSPERO (CRD42012003129 at http://www.crd.york.ac.uk/prospero). Briefly, the present analyses were based on individual patient data from three randomised clinical trials20–22 (N=2299 patients), all identified through a systematic review of the literature.6 All trials investigated the benefits and harms of higher PEEP ventilation compared to lower PEEP ventilation in patients with ARDS. Inclusion criteria, literature search strategies and main results of this individual patient data meta-analysis have been reported previously in accordance with the PRISMA statement (figure 1).6 ,23
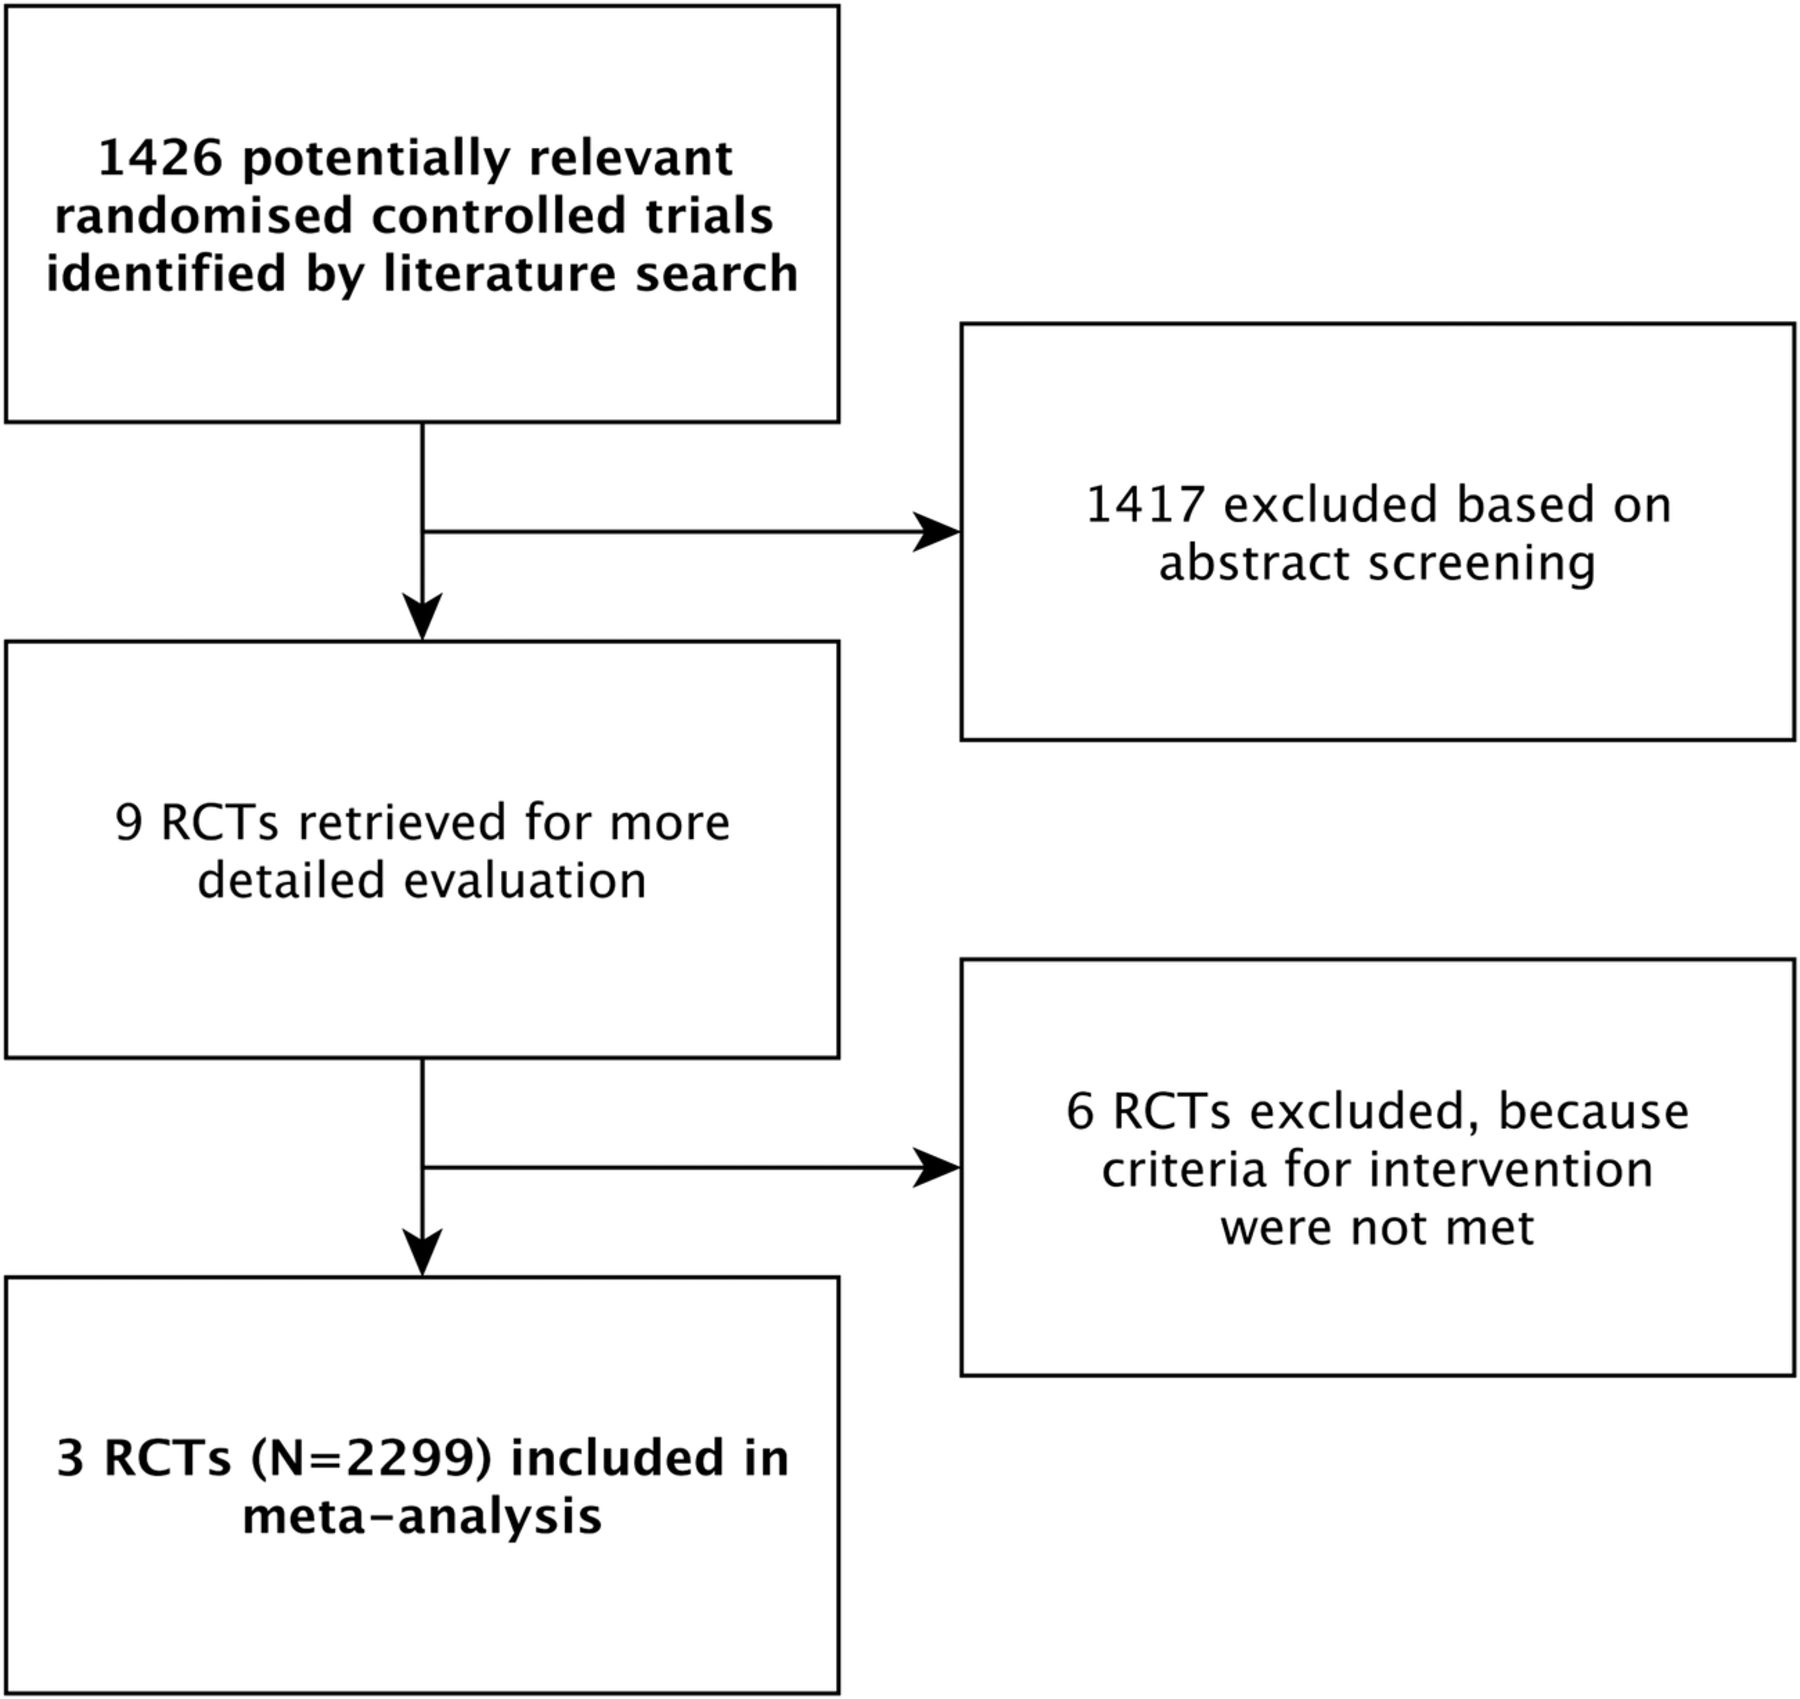
Trial flow.
Clinical outcomes
Hospital mortality at 60 days postrandomisation constituted the primary outcome of interest. We also considered hospital mortality as a time-to-event variable. All trials (LOVS, ALVEOLI, EXPRESS)20–22 followed patients for at least 60 days; thereafter, LOVS and ALVEOLI followed the majority of patients until death or hospital discharge, but EXPRESS did not.6 In the current analysis, as in the original IPDMA, we administratively censored surviving patients in the time-to-event analysis at day 60.6 We also investigated time-to-unassisted breathing, which was defined as time from randomisation until breathing without mechanical support within the first 28 days. Owing to differential follow-up across trials for this outcome beyond day 28 and the fact that the intervention effect is likely to precede day 28, as in the original meta-analysis, we administratively censored patients at day 28.6 Patients who died before achieving unassisted breathing within the first 28 days were censored at the day of death. We are aware of the problem of competing risks in intensive care trials,24 but the MFPI approach has not yet been adapted for a competing risk analysis. To address this, we therefore used a cause-specific Cox model,25 ,26 to assess the direct effect of higher versus lower PEEP on the cause-specific hazard of unassisted breathing. Pneumothorax requiring chest tube drainage during the first 28 days after randomisation is the main safety outcome; owing to competing risks of pneumothorax with mortality and as yet undeveloped MFPI methodology for a competing risk framework, we did not include this outcome in the present analysis.
Potential effect modifiers and investigations
All of the following four potential effect modifiers were baseline patient characteristics measured at randomisation and the analyses for potential interaction were all prespecified in our published protocol.19 BMI at baseline was calculated by the ratio of body weight in kg/(height in m)2. Respiratory system compliance was calculated by the ratio of the tidal volume/(inspiratory plateau pressure−PEEP), hypoxaemia was expressed as the ratio of PaO2/FiO2 and oxygenation index was defined as mean airway pressure ×100/(PaO2/FiO2).
A ‘pair’ of a potential modifier (eg, BMI) and an outcome (eg, in-hospital mortality) was considered as one investigation. In total, with 4 potential modifiers and 3 outcomes, we had 12 investigations for each trial separately and for the meta-analysis.
MFPI procedure
For each included trial, we used the MFPI approach13 to investigate potential interactions between treatment assignment (higher vs lower PEEP) and each of the four potential effect modifiers with respect to hospital mortality, time to death and time-to-unassisted breathing. When writing the protocol for this study,19 we decided to use only fractional polynomial (FP) degree 2 (FP2) functions for the analysis of interactions and to select the two power terms which fit the data best. We determined the two power terms separately for each study, giving the best fit in all patients, which corresponds to the default algorithm.13 For more technical details and the discussion of three ‘more flexible’ variants of the algorithm, we refer to Royston and Sauerbrei 2009.18
Using the derived power terms, MFPI estimates for each treatment group a FP function representing the prognostic effect of the continuous covariate of interest, optionally adjusting for other covariates. The difference between the functions for the treatment groups is calculated and tested for significance. The testing is performed through an analysis of interaction between treatment and the FP function. A plot of the difference (eg, odds or hazard ratio (HR)) against the covariate, together with a CI, visualises the resulting TEF. A TEF for a continuous covariate not interacting with treatment would be a straight line parallel to the x-axis, whereas a treatment–covariate interaction would be indicated by a non-constant line, often increasing or decreasing. For further explanations and references, we refer to a dedicated website on MFP and several related issues such as interactions and meta-analyses.27
All MFPI analyses were adjusted for three potential confounders (see below). To quantify the magnitude of effects, we estimated odds or HRs with pointwise 95% CI as a continuous TEF, which we plotted separately for each study.
Averaging the functions of individual studies—meta-analysis
We conducted an MFPI analysis with all included patients. For each modifier-outcome pair, we used fixed-effect models and weighted averaging to obtain an averaged TEF based on all three trials as previously outlined.17 Usually, in a meta-analysis, the weight of a study is determined by criteria such as the sample size, effective sample size (for a survival outcome) and variances of estimates of interest. However, such criteria do not reflect different distributions of a continuous variable. Depending on inclusion and exclusion criteria and further issues, such distributions may be very different between the studies. Therefore, a study may hardly have any information in a specific range of the data and corresponding CI of the treatment effect function are very broad in such regions, reflecting the severe uncertainly in this region. To reflect this information in the meta-analysis, Sauerbrei and Royston17 have proposed to average functions pointwise, with weights for each study depending on the information at each specific point. For a survival outcome, distribution of events and also of the patient population influence the weights. For more details, we refer to section 4.2 in ref. 17. Owing to the small number of studies, we decided to use fixed-effect models and corresponding weights for each function. For averaging the functions across studies, these were derived from the reciprocal of the variances; pointwise, 95% CIs were calculated accordingly.17 For each potential modifier, we illustrated the study weights graphically. The averaged TEFs were plotted to allow for a qualitative assessment of the possible interaction. Although it is possible to calculate a joint p value for the meta-analysis of several functions, we did not calculate it because treatment effect functions were nonlinear and the qualitative assessment of the functional relationship, rather than a single test for significance, is of central interest.
Adjustment for confounders
All patients were analysed in the group to which they were randomised (intention-to-treat principle). Owing to some imbalances with respect to age20 ,21 and the proportion of patients with severe sepsis,21 ,22 all MFPI analyses (for single trials and meta-analysis) were adjusted for the following potential confounders: age (continuous), presence of severe sepsis (yes vs no) and predicted probability of dying in the hospital (based on Acute Physiology and Chronic Health Evaluation II and Simplified Acute Physiology II scores, which have similar accuracy28 ,29). We applied the function selection strategy to the confounders separately for each study, with FP1 as the most complex permitted functional form.
Missing values and influential points
Some of the potential modifiers and variables used for adjustment had missing values of up to about 30%. In order to use all information in all analyses, we imputed missing values by multiple imputations chained equations techniques.30 The first imputation was used for all analyses. Further details about the multiple imputations are provided in the appendix. To circumvent the issue of possible influential outliers, we truncated each continuous predictor at the 1% and 99% centile, meaning that values below/above the 1%/99% centile were replaced by the value of the 1%/99% centile, respectively. For all analyses, we used the software STATA V.13.0 (Texas, USA).
Results
Patient characteristics
Table 1 summarises patients' characteristics and clinical outcomes stratified by trial. Overall, 2299 patients were considered in the analysis; the effective sample size (number of events) for hospital mortality (binary outcome) was 783 (34.1%) (higher PEEP 374 (32.9%), lower PEEP 409 (35.2%)) and 1465 (63.7%) patients came off the ventilator (higher PEEP 741 (65.2%), lower PEEP 724 (62.2%)).
Selected patient characteristics and end points
Interpretation of TEFs
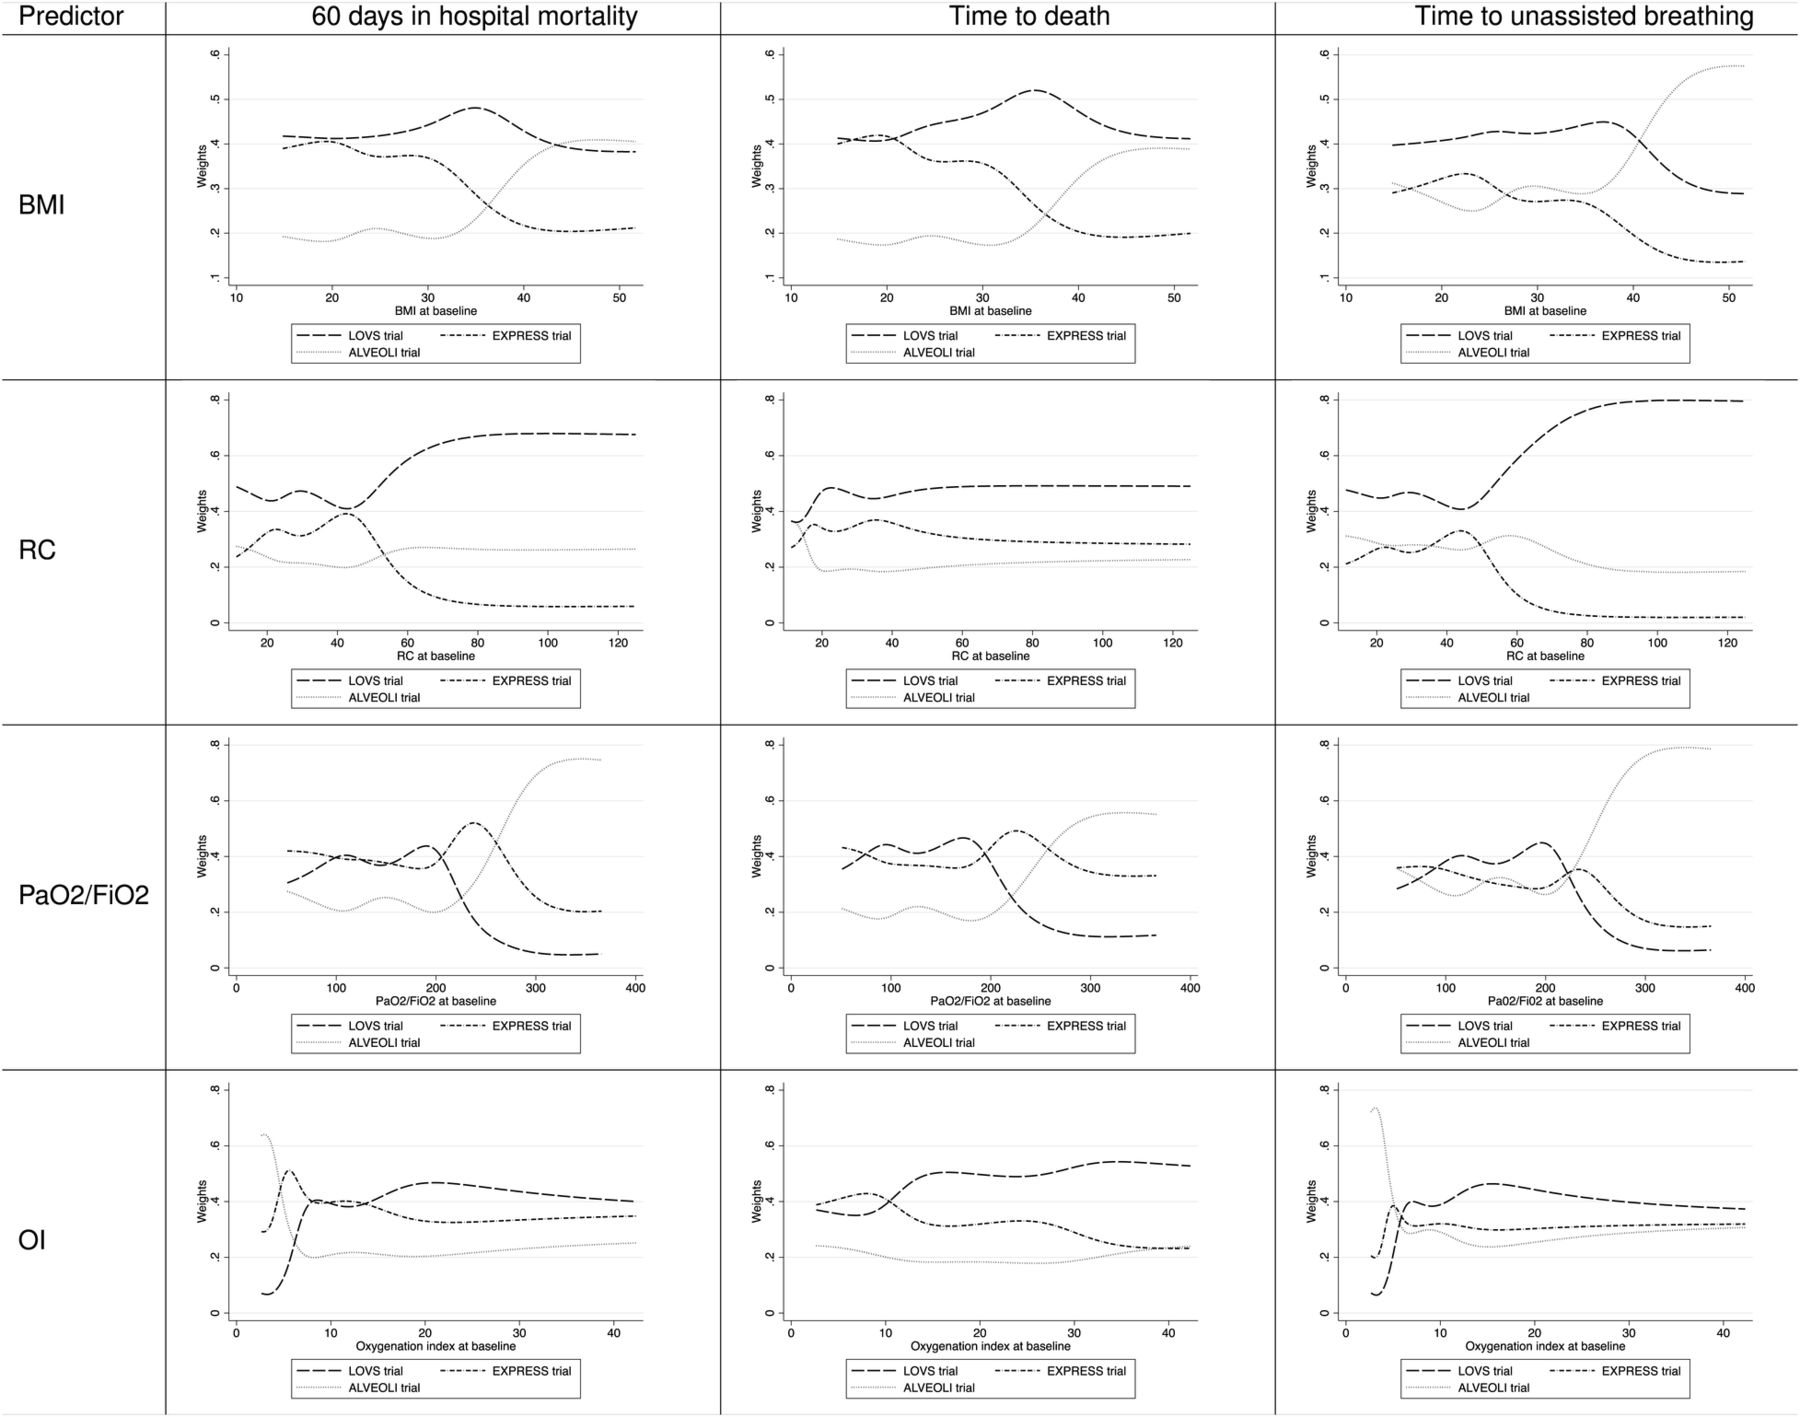
The respective TEF graphs (figure 2 shows averaged effects from the meta-analysis and online supplementary appendix figure 1–3 shows effects for the individual studies) show the relationship between the continuous patient characteristic (on the X-axis, eg, BMI) and the benefit/harm (eg, expressed as OR on the Y-axis) from the intervention (higher vs lower PEEP). If the average effect (dashed bold line) is below the horizontal line, this suggests a treatment benefit from higher PEEP and a detrimental effect if it is above. It is the opposite for the end point time-to-unassisted breathing, because here the outcome of interest is the ‘positive’ event coming off the ventilator. The thin dashed lines represent the pointwise upper and lower 95% CI limit. Therefore, at those parts where the 95% CI includes the horizontal line (OR or HR is 1), it is uncertain whether the suggested benefit or harm is real. The dashed vertical lines indicate the 5% and 95% centile of the data of the continuous predictors.

Averaged TEFs based on fixed effects of each predictor-outcome pair. The vertical dashed lines include 95% of the data of the continuous predictors; the horizontal line at the OR or HR of 1 denotes equivalence of treatment effects; thus, a TEF parallel to the horizontal line indicates no treatment interaction. For the outcomes, 60 days in hospital mortality and time to death values beneath this line indicate that higher PEEP is more effective than lower PEEP. For the outcome time-to-unassisted breathing, it is the other way round. BMI, body mass index; OI, oxygenation index; PaO2/FiO2, PaO2/FiO2 ratio; PEEP, Positive end-expiratory pressure; RC, respiratory compliance; TEF, treatment effect function.
supplementary figures
Interaction in single trials
We present a p value for each test of interaction (potential effect modifiers x higher PEEP) with the MFPI approach separately for each trial (table 2). Nearly all p values are much larger than 0.05. Only two p values in the LOVS trial are below this value. This may indicate that there are few, if any, interaction effects, but it has to be noted that RCTs are usually not powered to detect interactions and these values may also be a result of low power in individual studies. The corresponding TEFs are shown in the supplementary appendix figures 1–3). Some of the estimated treatment effect functions point towards an effect depending on the continuous variable, but all pointwise CIs are large because of the small effective sample size. Please note that FP power terms were estimated separately in each study and differ slightly. For the meta-analysis, FP2 power terms given in online supplementary appendix table 1 were used for each of the studies. Corresponding functions may differ slightly.
p Values for each interaction between the continuous baseline predictor and PEEP intervention for each outcome in the three included trials
supplementary tables
Interaction in meta-analysis
Figure 2 illustrates the adjusted averaged TEFs for each modifier-outcome pair (meta-analysis). Figure 3 summarises the distributions of weights given to each trial to calculate the averaged TEFs. The shape of these curves is mainly a result of the distribution of the respective modifier and corresponding number of events. For example, in the EXPRESS trial, there were more deaths (280 vs 134) compared to the ALVEOLI trial in the group of patients with BMI <40 kg/(height in m)2, while the ALVEOLI trial contributed more events (10 vs 5) in the group of patients with BMI above 40 kg/(height in m)2 (figure 3, left upper cell).
Weights for the averaged TEFs in figure 2. Fixed-effects weights were derived from the reciprocal of the variances. The shape of these curves is a result of the distribution of events and therefore also of the patient population by the respective modifier. BMI, body mass index; OI, oxygenation index; PaO2/FiO2. PaO2/FiO2 ratio; RC, respiratory compliance; TEF, treatment effect function.
BMI: The first row of figure 2 shows TEFs averaged over the three individual trials illustrating the potential interaction between BMI and the clinical outcomes. Regarding all three outcomes, the TEFs do not suggest particular interactions. However, regarding hospital mortality and time to death, the 95% CIs are considerably wide, especially at both ends, which leaves much uncertainty about the interaction effect. TEFs of the individual trials differ slightly but none of the individual RCTs showed a significant interaction between BMI and PEEP intervention for any of the three outcomes (see online supplementary appendix figures 1–3).
Respiratory system compliance: The second row of figure 2 shows TEFs averaged over the three individual trials illustrating the interaction between respiratory system compliance and the clinical outcomes. For values larger than about 40 (tidal volume in mL/(inspiratory plateau pressure−PEEP)), the function indicates some advantage for higher PEEP levels regarding hospital mortality and time to death, but the uncertainty of this interaction rapidly grows for values below 30 and above 60 (tidal volume in mL/(inspiratory plateau pressure−PEEP)) for hospital mortality. The TEF for time-to-unassisted breathing showed a different shape, suggesting that only a small group of patients with values between 35 and 50 (tidal volume in mL/(inspiratory plateau pressure−PEEP)) may benefit from higher PEEP ventilation.
PaO2/FiO2: The third row of figure 2 shows TEFs averaged over the three individual trials illustrating the interaction between PaO2/FiO2 and the outcomes. They suggest that patients with values below 150 but above 100 mm Hg (moderate ARDS) may benefit with respect to all three outcomes; however, the CIs in this range are still wide and barely exclude the odds and HR of 1, reflecting some remaining uncertainty about the treatment modifying effect of PaO2/FiO2. At both ends, 95% CIs are very wide and the functions for odds and HRs hardly exclude ‘1’ for any value, leaving a high degree of uncertainty.
Oxygenation index: The fourth row of figure 2 shows a similar pattern for the oxygenation index as described for PaO2/FiO2. On the basis of the averaged TEF for hospital mortality, there is evidence for a benefit from higher PEEP for patients with an oxygenation index above 12 that becomes smaller for values above 18. Regarding time to death and time-to-unassisted breathing, the rather flat shape of all TEFs suggests that no interaction is present.
As requested by one reviewer, we give more details of all main effect models (single trials and meta-analysis) in the online supplementary appendix tables 1–4.
Discussion
Summary of findings
In this meta-analysis of three randomised trials, we have combined two novel approaches to investigate interactions between continuous baseline patient characteristics with two ventilation strategies (high vs lower PEEP) and to average resulting functions in a meta-analysis. Although the statistical confidence in most interaction effects is very weak, the visual inspection of averaged TEFs suggests that some patients with moderate ARDS may benefit from higher PEEP ventilation with respect to hospital mortality, time to death and time-to-unassisted breathing. Patients with severe obesity were excluded from all included trials; therefore, although the TEF for BMI may suggest mortality reduction with higher PEEP ventilation in patients with very high BMI, no conclusions for the clinical practice can be made, because the uncertainty about this potential interaction is very large. Caused by inclusion and exclusion criteria of the individual studies, estimates in the outside range have the flavour of an extrapolation into regions where real data are missing.
Comparison to the original analysis
The primary analysis of this study was based on an imputed data set including 2299 patients. In the original analysis, we considered the complete case data set for the primary analysis (N=1814 at lowest) and conducted one sensitivity analysis based on an imputed data set (n=2299), which did not change the conclusion of the primary analysis. Also, in the original analysis, higher PEEP ventilation strategies improved outcome in patients with moderate and severe ARDS at baseline as defined by a PaO2/FiO2 ratio <200 mm Hg (p value for interaction 0.02).6 However, when we assessed the interaction using the continuous variable assuming linearity, no significant interaction was observed. Of note, we did not investigate the possible interaction graphically as we did using TEF plots in the analysis reported herein. Therefore, we previously reasoned about a possible threshold effect rather than a continuous interaction.6
At the time of our previous analysis,6 the new ARDS categorisation (mild 200–300 mm Hg PaO2/FiO2, moderate 100–200 mm Hg PaO2/FiO2 and severe <100 mm Hg PaO2/FiO2) was not defined.3 Considering these proposed cut-points, the qualitative assessment of the TEF for PaO2/FiO2 from our MFPI analysis suggests that some patients with moderate and severe ARDS may benefit from higher PEEP ventilation strategies. The results from our MFPI analysis do not contradict the subgroup effect initially identified in the previous analysis,6 but they provide further information and allow for a more comprehensive assessment of the interaction using the resulting plot of the TEF adjusted for potential confounders. This is a critical issue, because relying on statistical significance without any qualitative investigation of the interaction may discard important information that could be useful in clinical decision-making and management, and to generate new hypotheses that could be specifically tested in future trials. In this case, the advisability of using a high PEEP strategy is most compelling for patients with PaO2/FiO2 ratios of ∼100–150, with values outside of this range being less compelling, and with no suggestion of benefit with higher PEEP in values above 200.
The averaged TEF of BMI suggested that patients with a BMI≥35 kg/m2 may benefit more from higher PEEP ventilation strategies compared to patients with lower BMI, but CIs still include harm with higher PEEP in these patients. In the previous analysis,6 we hypothesised that in patients with high BMI, increased PEEP would not improve outcome, because of fewer recruitable lung units.6 Thus, the apparent interaction is opposite to the direction proposed on the basis of physiological rationale, further reducing the strength of inference.
Strengths and limitations
An MFPI analysis uses all available information from a continuous variable without linearity assumption and the result does not depend on any cut-point for an interaction analysis. A large simulation study showed that the MFPI approach adheres to the chosen significance level and that the power to identify an interaction is much greater than the power of the popular approach based on one cut-point.31 ,32 For this meta-analysis, all trials provided individual patient data, and therefore we could use all available information from the included trials to compare the two PEEP strategies and to investigate whether any of the four continuous variables modified the treatment effect. Strengths of this analysis include an explicit study protocol and analysis plan in which we comprehensively described the clinical variables to be investigated for interaction with the assigned intervention. The study protocol was registered online and is freely accessible.19 There is one additional eligible ARDS trial, which has recently completed recruitment of 224 patients (NCT00431158). Since the sample size is small, it is unlikely that it would influence results.
Although the overall sample size (2299 patients) is large for the focus of many clinical trials in the intensive care setting, our MFPI analysis remains underpowered. From single trials, investigation of interactions requires much larger sample sizes than investigations of main effects. The three trials considered here were powered to detect a main effect. Summarising results from three trials increased statistical power of conducted subgroup analyses, but the relatively large CIs of the TEFs, especially at both extreme ends of the continuous predictors, indicate that still more patients and events would strengthen the inferences of these analyses.
For the averaged TEFs, some researchers and clinicians may like to see a p value. There are various methods to combine p values from several trials. We could have provided a p value but it would have depended on the specific method chosen. More methodological research is required before we feel confident to provide a p value. More important, we believe that TEFs provide a much better way to investigate whether a continuous variable has an influence on the comparison of two treatments. In the TEF approach, observers can infer statistical significance from the positions of the 95% CIs. It is well known that CIs from models derived in a data-dependent way are too small. Obviously, that is also a critical issue of our pointwise CIs, specifically at the outer range of the covariate distribution. For more information, we refer interested readers to a dedicated website.27
Authors have proposed credibility criteria to judge whether observed interactions in clinical trials are likely or unlikely to represent true effects. These criteria include prespecification, consistency across closely related outcomes and the independence of the interaction from other prognostic factors.33 All of our interaction analyses were adjusted for recognised and important factors, but only the MFPI analysis of PaO2/FiO2 revealed consistent findings across all three prespecified outcomes; the consistency strengthens the conclusion that patients with moderately severe ARDS may benefit from higher PEEP ventilation.
Our results suggest that patients with a higher respiratory system compliance around 40 (tidal volume in mL/(inspiratory plateau pressure−PEEP)) and above (usually seen with milder ARDS) are more likely to benefit from higher PEEP. This appears counterintuitive when viewed together with the results on PaO2/FiO2 or oxygenation index, which suggested a benefit for patients with more severe ARDS. On the one hand, this may support our hypothesis that most recruitable lung units are found in patients with more severe ARDS whose lungs are not severely non-compliant. On the other hand, there were missing values for respiratory system compliance in over 20% of patients (500/2299 patients) that we imputed for the present analysis; this adds to the uncertainty about the effect estimates of the analyses with respect to respiratory system compliance.
Practical experiences with MFPI analyses are limited; however, some examples have illustrated its usefulness,13 ,34 and computer simulations have generated compelling evidence.31 ,32 Recently, Bratton et al35 reported on a meta-analysis using the MFPI approach to investigate whether continuous positive airway pressure treatment has an impact on lowering blood pressure in patients with obstructive sleep apnoea syndrome. In contrast to our study, the outcome of interest was continuous (blood pressure); however, the applied method of fitting and averaging the functions over different trials followed the general idea of our approach and the same programmes were used. More practical experience and methodological research is needed to combine MFPI and the approach for a meta-analysis of functions. Finally, a recent mediation analysis of 3562 patients with ARDS enrolled in 9 RCTs suggested that the main mediator of survival benefits from lung-protective ventilation is a minimised driving pressure (ΔP=tidal volumes/respiratory system compliance).36 Higher PEEP together with lower end-inspiratory (plateau) airway pressures and lower tidal volumes may constitute important components of lung-protective ventilation but ‘PEEP increments might be protective only when the increased PEEP values result in a change in lung mechanics so that the same tidal volumes can be delivered with a lower ΔP’.36 The driving pressure can be easily calculated for patients who are not making inspiratory efforts as the plateau pressure minus PEEP. However, before this concept is implemented in critical care practice, clinical trials are needed to test ventilator changes (including PEEP) that lead to changes in ΔP.
Conclusions
If individual patient data are available, the MFPI approach is a suitable method to investigate interactions between continuous predictors and outcomes in a meta-analysis, avoiding arbitrary cut-points and linearity assumptions. The results of this study do not allow for definite conclusions regarding clinical practice due to limited statistical power; however, we found evidence that higher PEEP ventilation is beneficial in some patients with moderate ARDS. Furthermore, in view of the increasing prevalence of obesity,37 the potential interaction between BMI≥35 kg/m2 and higher PEEP levels should be addressed in future trials to optimise ventilation strategies in this growing patient population.
Acknowledgments
The authors would like to thank Roy Brower for supporting this project.
References
Footnotes
Contributors BK coordinated the project, conducted the statistical analysis and wrote the manuscript. WS designed the study, supervised the statistical analysis and wrote the manuscript. PR provided codes for the statistical analysis, supervised the statistical analysis and reviewed the manuscript. AM, ASS, DC, GHG, LB, J-CMR, TES and MM critically reviewed the manuscript. MB designed the study and wrote the manuscript.
Funding This research received no specific grant from any funding agency in the public, commercial or not-for-profit sectors.
Competing interests AM reports grants from French Ministry of Health, grants from Association Nationale pour le Traitement à Domicile de l’Insuffisance Respiratoire, during the conduct of the study; personal fees from FARON PHARMACEUTICALS, personal fees from AIR LIQUIDE MEDICAL SYSTEMS, grants and personal fees from FISHER-PAYKEL, grants and personal fees from COVIDIEN, outside the submitted work; In addition, AM has a patent GENERAL ELECTRIC licensed. J-CMR reports grants from French Ministry of Health, during the conduct of the study; personal fees and other from AIR LIQUIDE MEDICAL SYSTEMS, grants and personal fees from COVIDIEN, grants and personal fees from COVIDIEN, grants and personal fees from VYGON, grants from GENERAL ELECTRIC, grants from Draeger, outside the submitted work; In addition, J-CMR has a patent GENERAL ELECTRIC licensed.
Provenance and peer review Not commissioned; externally peer reviewed.
Data sharing statement The anonymised individual patient data used herein are available on request. The authors are open to collaborating projects, including verification of the present analyses; however, a detailed research plan should always accompany such a request for data sharing.