Article Text

Abstract
Objectives To determine weight change patterns in Scottish patients 2 years after diagnosis of type 2 diabetes and to examine these in association with medium-term glycaemic, mortality and cardiovascular outcomes.
Setting Using a retrospective cohort design, ethical approval was obtained to link the Scottish diabetes care database to hospital admission and mortality records.
Participants 29 316 overweight/obese patients with incident diabetes diagnosed between 2002 and 2006 were identified with relevant information for ≥2 years.
Primary and secondary outcome measures Weight records over time provided intrapatient weight change and variation and glycated haemoglobin (HbA1c) gave measures of glycaemic control. These characteristics and demographic variables at diagnosis were linked with notifications of death (2–5 years after diagnosis) and cardiovascular events (0–5 year after diagnosis).
Results By 2 years, 36% of patients had lost ≥2.5% of their weight. Increasing age, being female and a higher body mass index at diagnosis were associated with larger proportions of weight lost (p<0.001). Multivariable modelling showed that inadequate glycaemic control at 2 years was associated with being younger at baseline, being male, having lower levels of obesity at diagnosis, gaining weight or being weight stable with weight change variability, and starting antidiabetic medication. While weight change itself was not related to mortality or cardiovascular outcomes, major weight variability was independently associated with poorer survival and increased cardiovascular outcome risks, as was deprivation.
Conclusions Our results suggest that weight loss or being weight stable with little weight variability early after diabetes diagnosis, are associated with better glycaemic control and we identified groups less able to lose weight. With respect to mortality and cardiovascular outcomes, although weight change at 2 years was a weak predictor, major weight variability appeared to be the more relevant factor.
- PUBLIC HEALTH
This is an Open Access article distributed in accordance with the Creative Commons Attribution Non Commercial (CC BY-NC 4.0) license, which permits others to distribute, remix, adapt, build upon this work non-commercially, and license their derivative works on different terms, provided the original work is properly cited and the use is non-commercial. See: http://creativecommons.org/licenses/by-nc/4.0/
Statistics from Altmetric.com
Strengths and limitations of this study
This representative study uses the national Scottish diabetes register to study all patients with type 2 diabetes, providing a substantial data set with up to 5 years of follow-up.
We used novel methods to study the impact of weight change patterns on glycaemic control, and link these to Scottish data for mortality and cardiovascular disease.
We had sufficient statistical power to identify groups (men, younger patients, those with lower levels of obesity at diagnosis and higher levels of deprivation) who might particularly benefit from structured weight loss interventions.
There were insufficient numbers of patients on newer antidiabetic medications, such as gliptins and glucagon-like peptide-1 receptor agonists, to analyse their effects.
The influences of blood pressure and lipid control were not incorporated into the analyses.
Introduction
Counselling for body weight reduction for patients with obesity is key within type 2 diabetes management guidelines.1 ,2 The Look AHEAD trial showed weight reduction improved long-term glycaemic control over 4 years in patients with a median duration of 5 years of diabetes.3 Similarly, Feldstein et al4 in the USA, along with others,5 found an association between initial weight loss with improved glycaemic and blood pressure control during the fourth year of follow-up in a cohort of 2574 newly diagnosed patients with type 2 diabetes, despite weight regain after initial weight loss. Authors have speculated that the initial period after diagnosis of type 2 diabetes may be critical for early glycaemic control6 and for applying weight loss interventions,4 to improve glycaemia and risk factor control. Feldstein et al7 findings also mirror those of the Finnish Diabetes Prevention Study and the Diabetes Prevention Program trials, where long-term prevention of diabetes was seen in the lifestyle intervention arms, again despite some weight regain.8 ,9 While, the Look AHEAD and Finnish Diabetes Prevention trials were unable to demonstrate a reduction in cardiovascular events,10 ,11 there have been some cost benefits seen especially for obese patients who lose weight.12
There is little information about variability of weight change in type 2 diabetes and the long-term outcomes. Zoppini et al13 found an association between variability in body weight and glycaemic control over a 10-year follow-up period and saw increased mortality in older patients with type 2 diabetes. Weight change in people with diabetes may be unintentional and related to poor glycaemic control and the use of antihyperglycaemic treatment.14 Thus, the main objective of this study is to investigate whether early changes after diagnosis in weight and glycaemic control, along with their variability, influence morbidity and mortality in type 2 diabetes, as well as treatment and glycaemic control.
Methods
In 2000, a population-based database, derived from primary and secondary care, was initiated as a register of people with diabetes across Scotland in the Scottish Care Information Diabetes Collaboration (SCI-DC) database15 (SCI-Diabetes since 2012). This database contains demographic and clinical data covering over 99.5% of people with a diagnosis of diabetes in Scotland. A 2011 extract of the SCI-DC data set was linked to hospital admission, cancer registration and mortality records by the Information Services Division (ISD) of National Health Service (NHS) National Services Scotland. This data set and a retrospective cohort design approach was used to examine the main objectives.
Study population
From the SCI-DC database, we extracted information on adult patients (>18 years) newly diagnosed with type 2 diabetes between 2002 and 2006. Patients with type 2 diabetes are a heterogeneous group; consequently we used rigorous inclusion/exclusion criteria (figure 1). People with a record of previous cancer, thyroid disease or on oral steroids were excluded. We selected these particular co-existing diseases from an otherwise numerous list as being the most likely for this patient group to promote weight loss. Excluded too were patients who had a body mass index (BMI) <25 kg/m2 at diagnosis (ie, normal weight or less). Further, we excluded those who died or moved out of Scotland within the first 2 years after diagnosis (to reduce effects of illness-related weight loss), had a low glycated haemoglobin (HbA1c; <6.0%) at diagnosis or were prescribed insulin within 18 months of diagnosis (to avoid including those more likely to have type 1 diabetes or who had had type 2 diabetes for a while prior to formal diagnosis). Given our interest in weight change patterns, those with only one recorded weight measure or with <21 months follow-up were also excluded. Successive records were examined and all data cleaned.
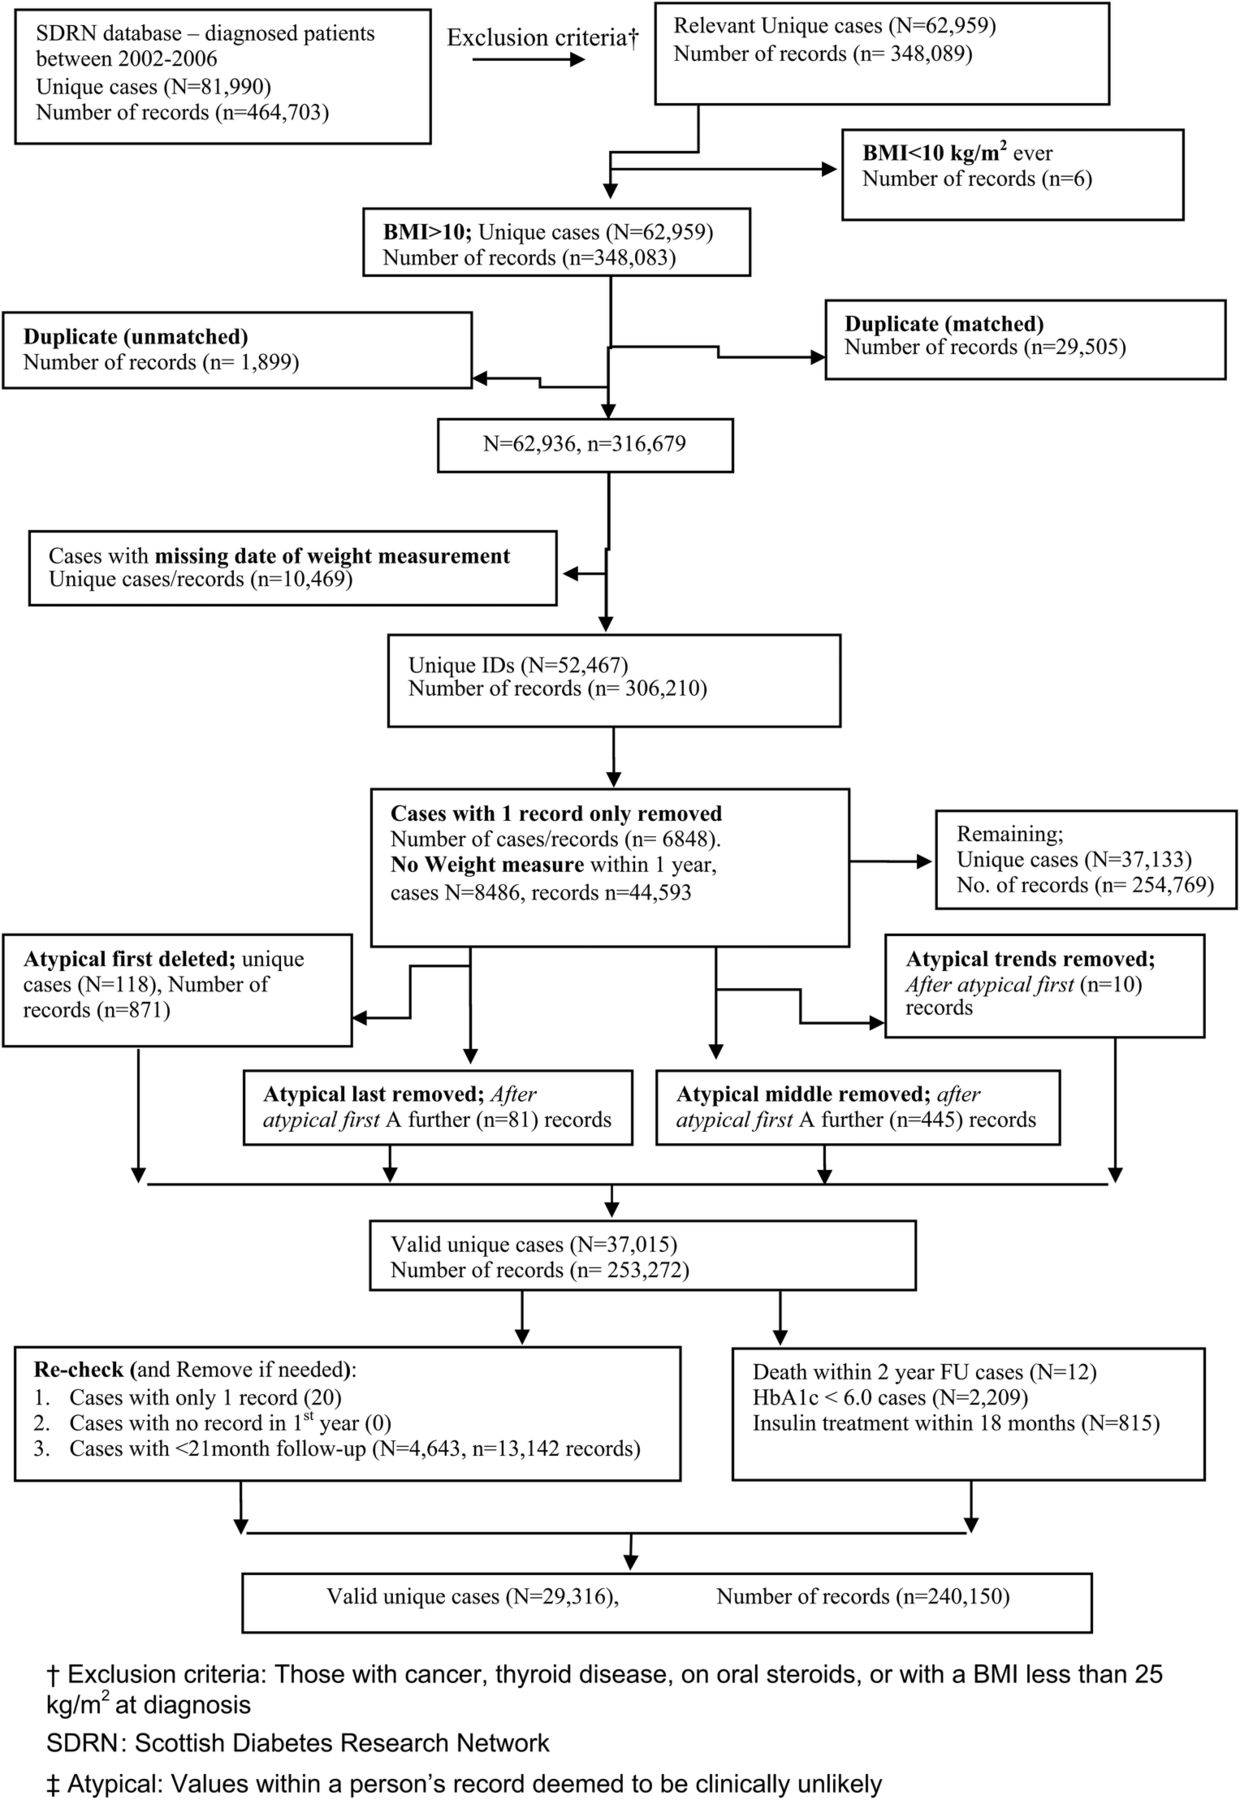
Summarising clinical and data cleaning exclusions. BMI, body mass index; FU, follow-up; HbA1c, glycated haemoglobin.
Study variables
We used characteristic variables recorded at diagnosis, that is, gender, age, smoking status (unknown, current, ex, never) and deprivation, using the five-point Scottish Index of Multiple Deprivation (SIMD)16 ranging from ‘most deprived’ to ‘least deprived’, the latter being our reference group. SIMD is an area-based measure which combines 38 indicators across seven domains, namely: income, employment, health, education, skills and training, housing, geographic access and crime. Ethnicity was not included in these analyses since this registry is primarily white European,17 and while normally an important variable our focus was on weight change patterns.
Also included were successive measures of weight, BMI, drug treatment and HbA1c from diagnosis onwards to examine weight change and glycaemic control relationships. HbA1c was reported as percentages rather than in mmol/mol in the database. Where possible, we have given both. Record linkage allowed investigation of further relationships of these with subsequent all-cause mortality and cardiovascular outcomes (myocardial infarction (MI), congestive heart failure (CHF), peripheral vascular disease and cerebrovascular disease identified using the International Classification of Diseases, 10th Edition (ICD-10) codes from hospital and death records).
Baseline and follow-up epochs
Individuals' baseline was set as the date of weight recorded within ±3 months of diagnosis. Similarly, the weight record closest to 12, 24, 36 and 60 months within a ±6-month window represented follow-up weight at 1, 2, 3 and 5 years, respectively. Pragmatically, the HbA1c measure recorded closest to the date of the selected weight record, within a ±3-month window, was matched to that weight. While the analyses were conducted on each of these epochs, this paper concentrates on the 2-year follow-up.
Weight change and variation categories, and four weight change pattern groups
Percentage weight change was calculated overall and within each specified follow-up period (1, 2, 3 and 5 years) then categorised as follows:
Loss: 10% or more, <10% to 5%, <5% to 2.5%;
Stable: Loss of 2.5% up to gain of 2.5%;
Gain: >2.5% to 5%, >5% to 10%, 10% or more.
The weight stable group is based on the National Institute for Health and Care Excellence (NICE) Public Health Guidance no 53,18 which indicates that a 3% long-term weight loss is associated with health benefits.
The coefficient of variation (cv) of weight change for each patient was calculated for the different follow-up periods to measure variability or cycling of weight, as follows:
then given the skewness of the distribution of the number of visits (median=6; IQR 4–9)) this was categorised into:
Little (<2.5%),
Some (2.5 to <5%),
Moderate (5 to <10%) and
Large (10%+).
While weight loss and gain are expected to be variable, variation in the weight stable group may be detrimental. Consequently this group was further divided into stable and steady over each follow-up period thus providing just four broad weight patterns: loss, stable-steady (little variation cv<2.5%), stable-cyclic (cv≥2.5%) and gain.
Antidiabetic medication groupings
Medication needs considering when relating weight change and patterns of weight change to glycaemic control, since some glucose-lowering treatments induce weight gain or loss. While in practice many combinations of medication may be expected, we concentrated on specific groupings using a ladder approach based on drugs most likely to induce weight gain. Hence, within a follow-up period, a patient ever on insulin was grouped within the ‘insulin combinations’ group. The ‘sulfonylurea (SU) combinations’ group included anyone ever prescribed SUs during that time epoch but not insulin. Those on glitazones with or without metformin but not insulin or SU combinations were considered together, leaving those on metformin alone, and finally those on no antidiabetic drugs over the follow-up duration.
Glycaemic control
Glycaemic control definitions vary. While <48 mmol/mol (or 6.5%) is an absolute target, we defined ‘control’ as HbA1c≤53 mmol/mol (or 7%), a commonly used clinical classification.5 ,6
Statistical analyses
All analyses were conducted on SPSS V.23 and/or SAS V.9.3 (SAS Institute, Cary, North Carolina, USA).
Initially, characteristics of those included and excluded were compared. For the included patients, summary statistics for initial weight and HbA1c levels are investigated alongside patient characteristics. Associations of the derived weight change categories with initial patient characteristics were examined. Since not all participants had the same number of follow-up epochs, missing data were assessed and the baseline summaries were considered according to those in each epoch, although we concentrated on just the second year follow-up period. All the above basic comparisons used analysis of variance or independent t-tests, as appropriate. The progression of treatment combinations over time is graphically described, along with the relationship between the weight change categories (at 2 years) with initial HbA1c, and with the average changes seen in HbA1c, the latter also being split according to antidiabetic medication. Proportions of those in each of the four weight change patterns were also considered in relation to glycaemic ‘control’ having taken antidiabetic medication into account.
Relative risks (RRs) of glycaemic ‘control’ for the weight change groups were estimated using log-binomial regression models (since the proportion ‘in control’ vs ‘not in control’ was similar) except for non-converging models, where Poisson regression models with robust variance were used.19 Weight change, weight variability, antidiabetic medication and weight change–medication interactions for each follow-up period were predictor variables, adjusted for patient characteristics at diagnosis, BMI, sex, smoking status and deprivation.
All-cause mortality is a single time event, while the cardiovascular outcomes are multiple events. For the latter, only the first event was analysed. Cox regression was conducted on deaths between 2 and 5 years (prior to 2 years were excluded to limit the potential for reverse causality from conditions that cause weight loss and increase mortality) and 0–5 years for cardiovascular first events (reverse causality is less of a concern for non-fatal cardiovascular events). These were modelled against: weight change, cv, antidiabetic medication and weight change–medication interactions, all at 2 years (considered to be a reasonable weight change assessment period); and adjusted for HbA1c control at 2 years, and patient characteristics at diagnosis, as given above. Those who had not died by the ISD extraction date were censored at that date (1 December 2013) as were those who had not experienced a cardiovascular event, unless the patient had died before, in which case the date of death was used as the cardiovascular event censored time.
Owing to the many analyses being performed and the larger sample sizes, significance levels were reduced to p<0.001 to assess the RRs for glycaemic control and the HRs for the cardiovascular outcomes.
Results
Baseline characteristics
Originally 81 990 patients diagnosed with type 2 diabetes were recorded on the register between 2002 and 2006. After exclusions, the final sample had 29 316 cases with 240 150 records (figure 1). Excluded patients were slightly older (59.4 vs 58.4 years), more likely to be men (56.0% vs 54.4%), with a higher proportion with unknown smoking status (17.3% vs12.7%), but fewer were classed as deprived using SIMD16 categories: 46% in the two most deprived categories compared with 49.4% in the two least deprived categories. Although these were statistically significant, they were not considered clinically important (apart from smoking status), especially since the main aim was to investigate weight patterns and their potential effect.
For the included participants, the median (IQR) follow-up period was 5.2 years (3.8–6.2) with between 2 and 69 visits. At diagnosis for these patients (n=29 316), 54% were men, mean age was 58 years (SD=12), mean HbA1c was 67 mmol/mol or 8.3% (SD=1.9) and mean BMI was 33.2 (SD=6.0) kg/m2. Men had slightly lower mean BMI (32.3, SD=5.3) than women (34.2, SD=6.6). Table 1 shows younger patients and those most deprived to be clinically and statistically significantly heavier. Males were also statistically heavier than women but no more than expected given height differences. There were no differences in weight across the different smoking groups.
Summary statistics of weight (kg) and HbA1c (%) at diagnosis by patient characteristics
Table 1 also shows that mean HbA1c at diagnosis (n=22 781, not all included patients had an HbA1c measurement at diagnosis) was 66 mmol/mol or 8.2% (SD=1.9). This differed between men and women and between age, smoking, deprivation and BMI groups. However, only age and BMI differences were of clinical importance: younger patients (<40 years) had higher mean baseline HbA1c level than older (≥60 years) patients (72 mmol/mol or 8.7%, SD=2.0 vs 64 mmol/mol or 8.0%, SD=1.9). Those who were overweight (≥25 BMI<30 kg/m2) had slightly higher mean baseline HbA1c (66 mmol/mol or 8.3%, SD=2.05) than those who were obese (BMI≥30 kg/m2) where it ranged between 65 and 66 mmol/mol or 8.1% and 8.2%.
Missing data
Patient numbers fell with follow-up. However, patients still alive with relevant weight (n=20 856) and HbA1c (n=16 225) data after 2 years had similar diagnosis weight and HbA1c summary statistics (bottom line, table 1), thus still reflective of our original database. By 2 years, 29% and 37% of patients had missing data for weight (kg) and HbA1c, respectively (see online supplementary table S1). However, 99% of those with weight and HbA1c measures at 2 years also had information for the other variables of interest.
Supplementary tables
Weight change
Of the 20 856 patients with 2-year follow-up data, the mean percentage weight change was small at −0.7±6.7%. At a population level, BMI was also relatively unchanged, baseline mean BMI was 33.2 kg/m2 (SD=6.0) at baseline and 32.8 kg/m2 (SD=5.9) after 2 years. However, the percentage weight change categories over time show many were either weight stable or had weight loss: at 2 years, around 36% had lost weight (2.5% or more), with 21% losing more than 5% and 7% achieving 10% or more weight loss (see online supplementary figure S1a). These proportions were even higher after 5 years with 41% having weight loss, 28% with >5% weight loss and 11% with 10%+ weight loss. Variation of this weight change was, as expected, largest for those with the most weight change and increased with follow-up (see online supplementary figure S1b).
Supplementary figure
Demographics associated with weight change
More women (40%) than men (32%) lost ≥2.5% of their body weight 2 years after diagnosis of diabetes with sex differences persisting even after 5 years (47% vs 35%, respectively). A larger per cent weight loss was significantly associated with higher BMI at diagnosis (see online supplementary table S2). Age at diagnosis was also significant with weight loss (mean age of those with 10% weight gain was 56 years (SD=12.6) compared with 59 years (SD=11.0) for those with 10% weight loss).
Associations between weight change and HbA1c change
For each follow-up period, the mean HbA1c at diagnosis was lowest for those who lost weight or were weight stable. Conversely, diagnosis HbA1c was highest for those who later gained weight (figure 2).

Average HbA1c (%) at diagnosis with weight change for different follow-up periods (1, 2, 3 and 5 years). HbA1c, glycated haemoglobin.
Next considered were patterns of weight change with glycaemic control in conjunction with the specified antidiabetic medication groups. These groups accounted for 99.8% of all patients after 2 years. Figure 3 shows the proportions of these groups; those on no antidiabetic drugs initially represented around 56% of the sample declining to 19% by the fifth year. Metformin on its own was the most common drug with little variation for sole prescription (between 30% and 38%) over time, while the proportion of patients receiving any SU combination increased with time (12–32%). Glitazone prescription (with or without metformin) and insulin (with or without any other drug) also increased from virtually no prescriptions to around 10% after 5 years.
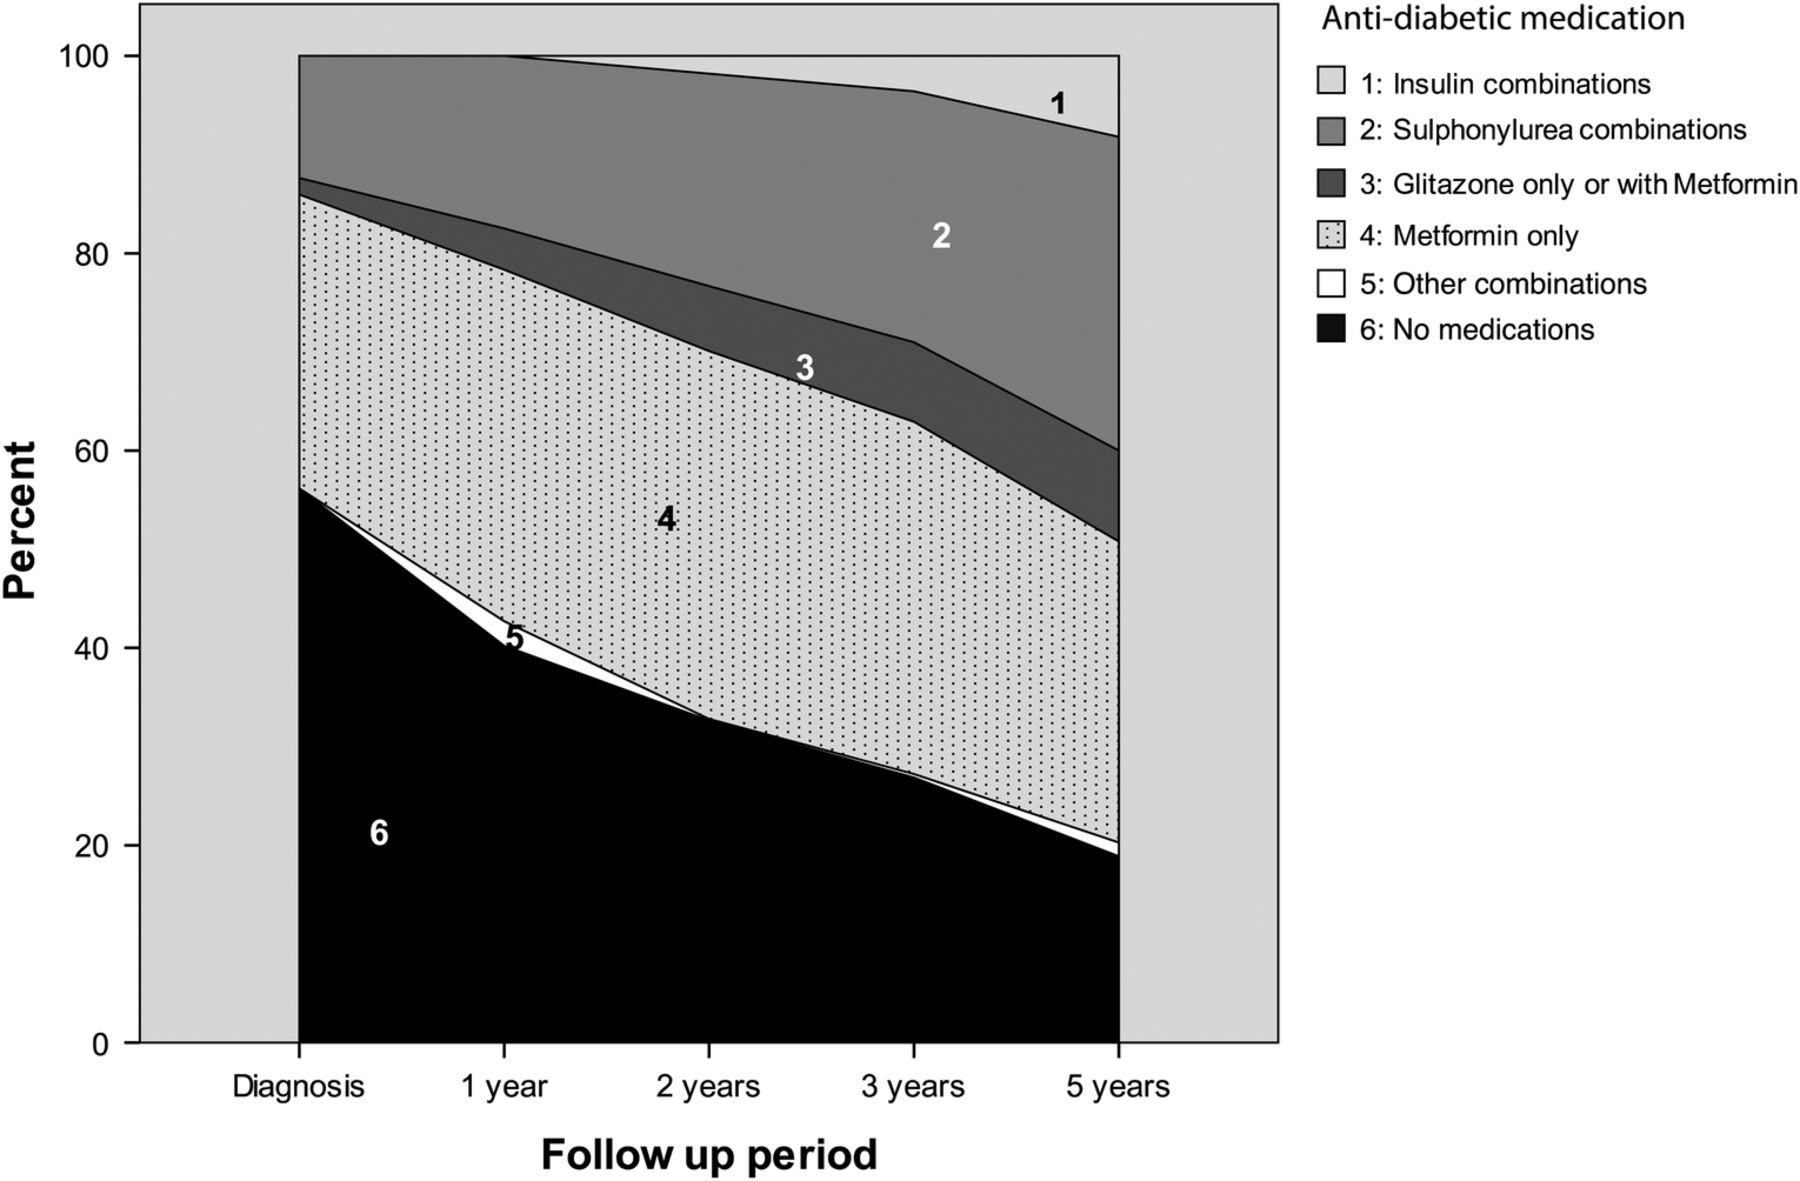
Antidiabetic medication group proportions over follow-up.
The mean HbA1c significantly dropped within the first year (p<0.001) regardless of treatment but crept back up over time (table 2); online supplementary table S3 splits this for differing weight categories showing significantly that the mean HbA1c was lowest for those with 10% weight loss and largest for those with 10% weight gain regardless of follow-up time.
Summary statistics of glycated haemoglobin (HbA1c) at baseline and then each time epoch
Figure 4 shows changes in HbA1c, 2 years after diagnosis of diabetes, by the different weight change categories and treatment groupings (associated sample sizes, see online supplementary table S4).

Mean HbA1c levels for each treatment combination and weight change category (at 2 years’ follow-up). HbA1c, glycated haemoglobin.
After 2 years, HbA1c reductions were associated with good weight loss and/or drug regimens. This pattern was similar for all follow-up periods (not shown). Patients with improved HbA1c levels tended to have weight loss or stability (78% after 1 year, 73% by the second year and 68% after 5 years) and were mostly on either metformin or no drugs (87% year 1, 73% years 2–5). Those on combinations of SUs or glitazones had greater improvement in HbA1c and also tended to gain weight. The exceptions were some patients on insulin, as seen in the top left of figure 4, who despite substantial weight loss (>5%) had increased HbA1c, possibly suggesting weight loss induced by poorly controlled diabetes.
The downward parabola-shaped response of HbA1c to per cent weight change (figure 4), except for those on insulin, also highlights the three broad bands of weight change (loss, stability and gain), giving rise to the investigation concentrating on ‘weight loss’ (more than 2.5% loss), ‘weight stable’ (between ±2.5%) and ‘weight gain’ (more than 2.5% gain).
Recall that the weight stable group was further divided to reflect variability into the ‘weight stable-steady’ and ‘weight stable-cyclic’ categories.
Using HbA1c≤7% or 53 mmol/mol, as glycaemic control, we found that at diagnosis 36% were ‘in control’, improving to 55% within the first year, dropping to 51% for those after 2 years and levelling off to around 47% thereafter. Figure 5 illustrates this after 2 years, in conjunction with antiglycaemic medication and weight change pattern group. Greater proportions of people who lost weight, regardless of treatment, achieved glycaemic control at 2 years compared with those who gained or had stable weight.

Percentage of those in glycaemic control (HbA1c≤53 mmol/mol (or 7%)) at 2 years’ follow-up, by weight change pattern group and treatment. HbA1c, glycated haemoglobin.
Models for each follow-up period were derived using HbA1c ‘in control’/‘not in control’ as a binary dependent variable. The four weight change patterns (loss, stable-steady, steady-cyclic and gain), the five variability cv categories and treatment combinations were included as predictors. In addition, an interactive term of weight change with treatment was included to accommodate potential confounding of treatment on weight change. All models were adjusted for characteristics at diagnosis (age, BMI, sex, smoking status and deprivation), variables known to potentially effect HbA1C and change in weight. Table 3 presents RRs for all follow-up periods. Generally younger patients and/or those with higher baseline BMI had increased risk of ‘not being in control’ later. Sex, smoking status and deprivation were generally not significant factors. However, being on antidiabetic medication was associated with being ‘not in control’ (eg, those on insulin at 2 years were four times more likely to have higher HbA1c and have weight gain). Compared with weight loss or even stable-steady, the weight gain and stable-cyclic groups were more likely to have higher HbA1c levels. However, larger weight variations were more related to HbA1c being ‘in control’. There were also positive associations for better HbA1c control with the drug–weight change interactions (gain with SU or glitazone combinations) compared with the weight loss or not on drugs groups.
Multivariable RR for HbA1c>53 mmol/mol over specified follow-up periods (significance taken at p≤0.001)
Table 4 gives the hazard rates for all-cause mortality and the different cardiovascular outcomes (MI, CHF, peripheral vascular disease and cerebrovascular disease) adjusted for patient characteristics, weight change patterns and antidiabetic medication regimes. It shows similar risk factors across the different health outcomes. All were associated with increasing age, being male (except cerebrovascular disease), smoking (even ex-smokers, although not for cerebrovascular disease) and increased deprivation (not for peripheral vascular disease and cerebrovascular disease). Morbid obesity (BMI≥40) at diagnosis was associated with higher risks for mortality and CHF than being overweight (BMI 25–29.9).
Multivariable HRs for all-cause mortality and cardiovascular outcomes
Across all outcomes, insulin combinations were 3–5 times associated with increased mortality risk compared with the no drug group, while SU combinations had even greater associations with mortality and CHF. Although included, good glycaemic control at 2 years was not significant with respect to these later health outcomes. Weight change itself was not statistically associated, but weight variability was a significant risk factor related to mortality, and to a lesser extent for MI and CHF. Drug–weight interactions were investigated, but none were statistically significant (only overall p values are given).
Discussion
This study examined weight change patterns in a large contemporary cohort of overweight or obese patients newly diagnosed with type 2 diabetes. The weight loss benefits on glycaemic control and decreased need for antihyperglycaemic therapy are well documented,12 ,20 along with reduced disability risks.5 The national Scottish guidelines recommend that obese adults with type 2 diabetes should be offered individualised interventions to encourage weight loss.21 While we found the mean percentage weight change after 2 years was only −0.7±6.7% (persisting up to 5 years), a subgroup (36%) had lost weight by 2 years with 59.2% of them losing more than 5%; the corresponding figures by 5 years were 41% and 68%, respectively. Women were more likely to lose 5% or more weight than men over the 5 years. Older people (60 years+) and people with higher initial BMIs were also more likely to lose weight. This weight lost suggests real effort from this subgroup, especially since some diabetic treatments induce weight gain; moreover weight tends to increase over time in the general population.22 Morgan et al23 showed weight increases over 1995–2010 for those first diagnosed with type 2 diabetes.
In this cohort, those younger at diagnosis were significantly more obese with higher HbA1c levels. However, around 36% of the entire cohort had ‘in control’ HbA1c levels (≤7% or 53 mmol/mol) at diagnosis, increasing to 47% after 5 years. This was more likely for patients with significant weight loss or the weight stable-steady group, irrespective of antihyperglycaemic medication. By 2 and 5 years, 13% and 8%, respectively, had good glycaemic control (HbA1c<6.5% or 48 mmol/mol) without diabetic medication. Mean HbA1c was lowest for those with 10% weight loss and highest for those with 10% weight gain. Best glycaemic control was associated with metformin, particularly if with weight loss. de Fine Olivarius et al24 also found weight loss common for diabetics within 5 years of diagnosis, but did not find weight affected by SU treatment combinations. In contrast, we found insulin, SU and glitazone combinations all to be associated with weight gain, albeit with better glycaemic control. What cannot be determined is the casual path of these factors.
Factors associated with poor control (HbA1c>7% or 53 mmol/mol) at 5 years included being younger, having a higher diagnosis BMI and to a lesser extent being female and/or deprived. Perhaps contradictory are the coefficient of variation results where large weight variation was associated with better glycaemic control. However, the direction of the weight change is indistinguishable here. ‘Control’ was associated with progressive weight loss and also with weight gain when combined with antidiabetic medication. The better glycaemic control seen for the interaction between diabetic medication and weight gain may also be due to medication rather than increased weight. Other explanatory factors include differences in lifestyle, medication adherence, response to medication or the propensity for side effects.25 ,26
Higher mortality and cardiac failure after 2 years were also associated with severe obesity (BMI≥40) at diagnosis (table 4). HbA1c control at 2 years was not related to any of these outcomes, perhaps because glycaemic control often includes insulin and SU use, themselves associated with adverse prognosis and confounding the results. Weight change at 2 years was also not significantly associated with these outcomes. However, weight variability was significant, with mortality risk for the weight stable-cyclic group being double that of the weight loss group. Similar associations were seen for MI and cardiac failure. Weight variability may reflect other illnesses, themselves associated with poorer outcomes. What cannot be determined from these data is if weight change was intentional. It is known that unintentional weight loss is often the result of illness.14 While we have excluded those who died within the first 2 years, we cannot exclude significant comorbidity that might be contributing to the variability.
This study may be limited by the observational nature of the data. However, access to such a large community-based population is rare and provides detailed investigative opportunities. While the proportion of data exclusions seems large, this is common for routinely collected data often subject to incomplete data or input errors. Reassuringly, the characteristics of patients satisfying the per-protocol inclusion criteria were compared with those subsequently excluded for data cleaning reasons, with no clinically important differences. Further, the characteristics of this selected cohort after data cleaning and clinical exclusions are consistent with previous characterisation from the SCI-DC registry14 suggesting they reflect the general diabetic population in Scotland.
It was difficult to separate the effects of glycaemic control, treatment and weight change.23 While 30% had no glucose-lowering drugs after 2 years, this was only 19% after 5 years. Sinclair et al27 noted that only 51% of patients in their study had antihyperglycaemic medication within 2 years of diagnosis. These treatments are generally associated with weight loss (eg, metformin) or gain (eg, insulin, SUs, glitazones) seen here and elsewhere.28 Unfortunately, our cohort did not include patients on the newer treatments in sufficient numbers suitable for analysis, for example, glucagon-like peptide-1 receptor agonists, gliptins. We also did not examine the effect of blood pressure and lipids along with their associated treatment regimens. Obesity was measured by BMI, since other variables like waist circumference were not available.
In line with other studies, we found encouraging relationships between long-term weight loss, better glycaemic control and less antidiabetic medication. Feldstein et al7 in their small US study, speculated that the initial period after diagnosis of type 2 diabetes may be critical for weight loss interventions to improve glycaemia and risk factor control, based on a retrospective cohort—those with weight loss in the first 18 months, even with regain, had better glycaemic and blood pressure control in the second 18 months. Conversely, Fumelli et al29 in Italy did not find BMI change and HbA1c associations over 3 years. However, this was a small, poor quality study. Like our study, the US study4 found women and older people more likely to achieve weight loss, with our research highlighting the need to better support some patients less likely to do well. Janghorbani et al30 examined predictors of weight change in type 2 diabetes in an Iranian population over 9 years. While they did not find BMI>40 predicted greater weight loss, they did agree with our findings that women were more likely to lose the most weight, and insulin is likely to be associated with poor glycaemic control and weight loss. Another paper by Janghorbani et al31 found that insulin tended to improve HbA1c with weight gain, possibly related to better glycaemic control. The impact of weight loss on mortality in type 2 diabetes is a subject of debate. Here we saw weight loss benefits and increased mortality risks with large weight change variability. A review of six published observational studies showed divergent results on the topic with one study showing no association between weight loss and longevity, two associated weight loss with decreased mortality, one with increased mortality and two reported varying mortality outcomes in different subgroups.32 In a smaller older cohort, poorer glycaemic control at diagnosis adversely affected survival, but weight loss in the first year was associated with improved survival.33 Logue et al,34 using an earlier cross-sectional study in same diabetes register database used here, found the highest mortality for those with BMI≥35, and increasing vascular mortality BMI≥30, but did not examine weight change. Carnethon et al35 found that type 2 diabetics with BMI<25 at diagnosis had the highest total and non-cardiovascular mortality, but was a relatively small underpowered study and may instead reflect differing genetic predisposition to diabetes and other underlying illnesses, a group we excluded because of the higher chance of misdiagnosis. Our focus was on weight change patterns, but this apparent adverse effect of SUs and other antidiabetic medications on mortality has been described elsewhere including metformin, as discussed by Roumie et al.36
To date, weight cycling has been alluded to as being important but without there being any standard definitions or consistency of results. Mehta et al37 recently undertook a systematic review of the impact of weight cycling on the risk of morbidity and mortality finding limited evidence to support any adverse effects of weight cycling. One US study by Arnold et al38 found an association between weight variability/cycling with physical functioning and mortality in an older group of individuals but not all had type 2 diabetes. Our study investigated this in more detail for patients with diabetes and suggests that weight cycling is generally detrimental for those who are overall weight stable.
Our results show that substantial weight loss is achieved by a significant proportion of patients receiving standard care within Scotland. We highlight the significance of weight loss on improving HbA1c, thus indicating the importance of diabetes services in promoting intentional weight loss after diagnosis of type 2 diabetes. One such trial actively testing this is now in progress.39 Provision for maintenance strategies are also needed since weight stability with notable weight variability may be detrimental. Further, we have identified specific target groups who would benefit from access to more structured interventions for weight loss, these being younger patients with higher BMIs, and also men and those from more deprived communities. Within Scotland, there is now a process to review patient education programmes and whether they meet structured education criteria.40 Our results should be considered within such processes.
Acknowledgments
The authors would like to thank the Scottish Diabetes Research Network Epidemiology Group for granting permission to use this database. They also thank the data management team in the University of Aberdeen who were the initial conduit for access to these data and also provided validation to the various data cleaning criteria applied. Jeremy J Walker, University of Edinburgh, was invaluable for the original funding application and initial exploration of data. HSRU is funded by the Chief Scientist Office of the Scottish Government Health and Social Care Directorates.
References
Footnotes
Collaborators Members of the Scottish Diabetes Research Network Epidemiology Group: Alistair Emslie Smith, Colin Fischbacher, Scott Cunningham, Helen Looker, Helen Colhoun, John Petrie, John McKnight, Naveed Sattar, Sam Philip, R Lindsay, Rory McCrimmon, Sarah Wild, Graham Leese.
Contributors SP, LSA, AA and SW designed the study; LSA, EA, SP and AA analysed and interpreted the data; all authors contributed to writing the first and subsequent drafts of the paper. LSA is the guarantor.
Funding Chief Scientist Office (CSO) reference number: CZG/2/571.
Competing interests All authors have completed the ICMJE uniform disclosure form at http://www.icmje.org/coi_disclosure.pdf and declare: SP has received personal fees from: Novo Nordisk, Sanofi Aventis, Janssen, Bristol Myers Squibb, Astazeneca, Roche; NS has had some funding from Astrazeneca for a clinical trial and personal fees from Boehringer Ingelheim and Janssen.
Ethics approval Approval for the generation of the pseudonymised linked data set was obtained from Scottish Multi-Centre Research Ethics Committee, Caldicott guardians and the Privacy Advisory Committee.
Provenance and peer review Not commissioned; externally peer reviewed.
Data sharing statement Applications to use the data should be directed to the data custodians, see http://www.informationgovernance.scot.nhs.uk/ for further information.