Article Text

Abstract
Objective To update previous systematic review of predictive models for 28-day or 30-day unplanned hospital readmissions.
Design Systematic review.
Setting/data source CINAHL, Embase, MEDLINE from 2011 to 2015.
Participants All studies of 28-day and 30-day readmission predictive model.
Outcome measures Characteristics of the included studies, performance of the identified predictive models and key predictive variables included in the models.
Results Of 7310 records, a total of 60 studies with 73 unique predictive models met the inclusion criteria. The utilisation outcome of the models included all-cause readmissions, cardiovascular disease including pneumonia, medical conditions, surgical conditions and mental health condition-related readmissions. Overall, a wide-range C-statistic was reported in 56/60 studies (0.21–0.88). 11 of 13 predictive models for medical condition-related readmissions were found to have consistent moderate discrimination ability (C-statistic ≥0.7). Only two models were designed for the potentially preventable/avoidable readmissions and had C-statistic >0.8. The variables ‘comorbidities’, ‘length of stay’ and ‘previous admissions’ were frequently cited across 73 models. The variables ‘laboratory tests’ and ‘medication’ had more weight in the models for cardiovascular disease and medical condition-related readmissions.
Conclusions The predictive models which focused on general medical condition-related unplanned hospital readmissions reported moderate discriminative ability. Two models for potentially preventable/avoidable readmissions showed high discriminative ability. This updated systematic review, however, found inconsistent performance across the included unique 73 risk predictive models. It is critical to define clearly the utilisation outcomes and the type of accessible data source before the selection of the predictive model. Rigorous validation of the predictive models with moderate-to-high discriminative ability is essential, especially for the two models for the potentially preventable/avoidable readmissions. Given the limited available evidence, the development of a predictive model specifically for paediatric 28-day all-cause, unplanned hospital readmissions is a high priority.
- PUBLIC HEALTH
- EPIDEMIOLOGY
This is an Open Access article distributed in accordance with the Creative Commons Attribution Non Commercial (CC BY-NC 4.0) license, which permits others to distribute, remix, adapt, build upon this work non-commercially, and license their derivative works on different terms, provided the original work is properly cited and the use is non-commercial. See: http://creativecommons.org/licenses/by-nc/4.0/
Statistics from Altmetric.com
Strengths and limitations of this study
This is an updated systematic review (2011–2015) of the literature relating to risk predictive models for unplanned hospital readmissions.
This updated systematic review followed rigorous methodology applying comprehensive electronic database search, strict inclusion, exclusion and quality assessment criteria to synthesise current literature on characteristics and properties of risk predictive models for 28-day or 30-day unplanned hospital readmissions.
The outcomes of the predictive models included in this systematic review were restricted to 28-day or 30-day unplanned hospital readmission.
Introduction
Unplanned hospital readmissions cause a disruption to the normality of patients and/or family/carers' lives and result in a significant financial burden on the healthcare system.1 ,2 In the USA, it has been estimated that 7.8 million (20%) of hospital-discharged patients were readmitted. This accounted for $17.4 billion of hospital payments by Medicare.3 ,4 In the UK, the figures suggested ∼35% of unplanned hospital readmissions, costing 11 billion pounds per annum (5.3 million admissions in 2010/2011).5
Unplanned hospital readmission rate is considered as a performance indicator to measure a hospital's quality of care.6 ,7 Unplanned hospital readmission is defined as the percentage of unplanned or unexpected readmission to the same hospital within 28 days of being discharged.8 ,9 However, the literature has widely used 30 days within the context of measurement of hospital readmissions.1 ,6 ,7
One of the strategies to reduce the unplanned hospital readmission rate is the application of predictive models to identify patients at high risk for readmission. Preventive approaches can then be developed and applied to target the identified high-risk patients. A previous systematic review10 was conducted in 2011 on the risk predictive models for adult medical patients' hospital readmissions. A total of 30 studies with 26 predictive models were included, and the overall performance of reviewed models was poor. It is, however, worth noting that studies conducted in developing nations and studies that focused on paediatric patients and adult psychiatric and surgical patients were excluded.
Since 2011, there has been increased interest in either developing new predictive models or validating existing models due to high inpatient demand on the healthcare system.11–15 However, the performance of risk predictive models has varied significantly. The purpose of this systematic review is to update previous systematic review on predictive models for 28-day or 30-day unplanned hospital readmissions and to investigate and assess the characteristics of these models.
Methods
Search strategy and data sources
An electronic database search was carried out using the CINAHL, Embase and MEDLINE to identify studies published between 2011 and 2015. The key search terms included ‘unplanned readmission* or rehospitali*’ AND (‘predict*’ AND ‘model*’) OR ‘ROC or C-statistic*’ OR ‘sensitivity or specificity’ (see online supplementary appendix 1 for full search strategy).
supplementary appendix
Inclusion/exclusion criteria
Articles eligible for inclusion were those published in English with full-text access from 2011 to 2015. Only peer-reviewed studies were included in this review. The study design of included studies needed to be clearly stated together with details of the performance of the risk predictive model reported. Abstract-only references were excluded. Studies included in the previous systematic review10 were excluded due to overlapping of the search period (1985–August 2011). Studies that included patients discharged from hospital but still receiving treatment, that is, intravenous antibiotics, via ambulatory care or hospital in the home programmes were also excluded.
Study selection and data extraction
Initial literature searches were conducted by HZ and PD. Two authors (HZ and LG) independently screened titles, abstracts and appraised full papers against the inclusion and exclusion criteria. The process of exclusion was relatively straightforward and only a handful of studies warranted discussion between the authors (HZ, LG, SD, PD and PR) and to reach consensus as to whether they met the inclusion criteria.
Data were extracted from the final included studies by three authors (HZ, LG and SD). The data extraction included study characteristics, model performance and key variables of the predictive model. Study characteristics included study setting, population, data source, the timing of data collection, sample size, study design, model name if applicable, model utilisation outcome and readmission rate (table 1). Measures assessing predictive model performance, including discrimination, calibration, cut-off values used to identify patients at high risk of being readmitted to the hospital, sensitivity, specificity, positive predictive value (PPV) or negative predictive value (NPV), were extracted (table 2). Model discrimination is commonly assessed using C-statistic or the area under the receiver operating characteristic curve. Values of the C-statistic measurement range from 0.5 to 1.0. A value of 0.5 indicates that the model is no better than chance at making a prediction of membership in a group, and a value of 1.0 indicates that the model perfectly identifies those within and not within a group. Models are typically considered reasonable when the C-statistic is higher than 0.7 and strong when the C-statistic exceeds 0.8.71 Variables of the readmission risk predictive model were also extracted and presented in table 3. The studies were grouped based on the model utilisation outcome in the three tables. Disagreements between two reviewers about the extracted data were resolved through group discussion.
Characteristics of 49 included studies on 28-day or 30-day unplanned hospital readmission (UHR) predictive models
Performance of predictive models for 28-day or 30-day unplanned hospital readmissions (UHRs)
Continued
Continued
Summary of significant variables included in the predictive models for unplanned hospital readmissions (UHRs)
Quality appraisal
Six domains of potential bias72 were used to appraise the quality of included studies critically. The assessment of risk for bias was completed by two independent reviewers (HZ and SD). The ratings of ‘yes’, ‘partly’, ‘no’ or ‘unsure’ were given to each domain and then an overall risk of ‘low’ or ‘high’ was assigned to each study.
The six domains are:
Study participation: ‘Was source population clearly defined?’ and ‘Was the study population described?’ or ‘Did the study population represent source population or population of interest?’
Study attrition: ‘Was completeness of follow-up described and adequate?’
Prognostic factor measurement: ‘Did prognostic factors measure appropriately?’
Outcome measurement: ‘Was outcome defined and measured appropriately?’
Confounding measurement and account: ‘Were confounders defined and measured?’
Analysis: ‘Was analysis described and appropriate?’ and ‘Did analysis provide sufficient presentation of data?’
Data synthesis
Pooling of quantitative data was not possible as the included studies were not homogeneous. Therefore, the included studies were qualitatively synthesised and presented in narrative form.
Results
Literature search result
The initial electronic database search produced 7310 records. After removal of 1798 duplicates, a total of 5512 references of potential relevance to this systematic review remained. Titles and abstracts were then appraised and excluded 5333 records due to irrelevance. Of the remaining 179 relevant references, 98 were excluded as they were conference abstracts. A total of 81 references were reviewed as full text and a further 21 were excluded against selection criteria. A total of 18 of the 21 excluded studies developed and/or validated risk predictive models for the 48-hour73 or 72-hour74 intensive care unit readmissions or the 3-month to 1-year unplanned hospital readmissions.75–90 One study focused on participants who were discharged to a hospital in the home–hospital programme receiving intravenous antibiotics.91 The other study,92 which had been included in the previous systematic review,10 was also excluded. It was also found that the same result was published in two articles;32 therefore, the later year article32 was excluded. A hand search of reference list of the remaining 60 articles was also conducted and no additional studies were identified. Finally, a total of 60 studies were included in this systematic review. Figure 1 is a flow chart as per the Preferred Reporting Items for Systematic Reviews and Meta-Analyses of the screening process of the database search results. The overall risk of bias of the 60 studies was low when evaluated against the six domains of potential bias. All studies described the population of interest adequately for key characteristics, the response rate information was clearly stated, adequate proportion of the study population had complete data on all independent variables, the outcome variable readmission was measured with sufficient accuracy and the method of statistical analysis was appropriate for the design of the study.72
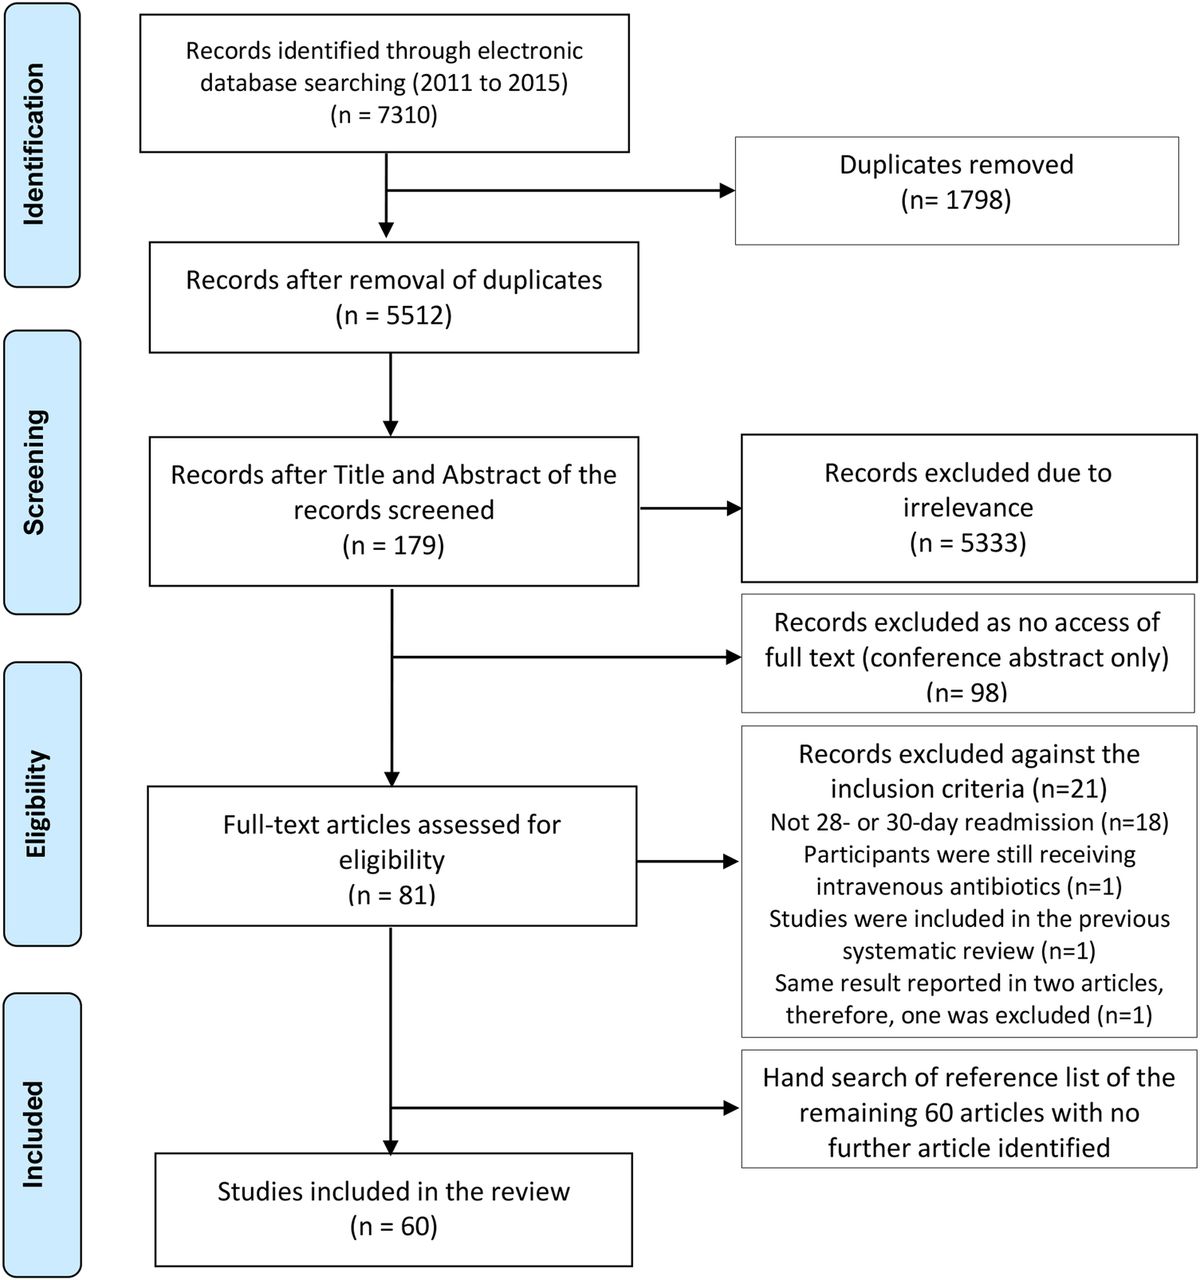
Flow chart for the search and study selection process (PRISMA). PRISMA, preferred reporting items for systematic reviews and meta-analyses.
Study characteristics
Table 1 summarises the characteristics of the final included studies of this systematic review. The 60 studies were conducted in several countries: USA (n=41), Canada (n=7), Australia (n=3), Spain (n=3), and one from Hong Kong, Korea, Israel, Italy, Singapore and the UK. Of the included studies, the majority employed retrospective data except two. One study18 used retrospective and prospective data and the other39 collected prospective data. Fifty-seven included studies accessed healthcare data of either tertiary hospital, centralised or national health information databases. The remaining three studies used community hospital data.19 ,44 ,54 The duration of retrieved data source ranged from 1 single day across 10 hospitals24 to 10 years47 of four healthcare databases. All included studies were based on adult patients’ (aged ≥18 years) healthcare data and the mean age, if reported, ranged from 43 to 85 years.
The 60 included studies reported unique 73 predictive models for 28-day or 30-day unplanned hospital readmissions. A total of 68 of the unique 73 predictive models were developed between 2011and 2015 and 5 were existing models, which were further validated or applied to compare with other developed/existing models. The model utilisation outcome included all-cause admissions (14 studies),12 ,13 ,16–27 cardiovascular-related disease including pneumonia (24 studies,15 ,28–50 of which 11 studies focused on heart failure only), medical/internal medicine conditions (15 studies),11 ,14 ,51–63 surgical conditions (6 studies)64–69 and mental health conditions.70 A total of 17 models were based on administrative data and the remaining models were derived or validated using administrative and/or clinical/medical records data. The sample size varied from 100 patients46 to nearly a million57 patients. The unplanned hospital readmission rate ranged from 2.8%66 (n=34 046) to 38%46 (n=100).
Performance of predictive models for 28-day or 30-day unplanned hospital readmissions
Table 2 displays the measures of all included predictive models. Multivariable logistic regression model was used in all included studies. In logistic regression, the outcome variable is the log of the odds of the event (probability of readmission/(1−probability of readmission)). Once the final model is determined, the multivariable logistic regression allows for the calculation of probability of readmission for cohort studies. The predicted probabilities of the final multivariable logistic model are also used for computing the receiver operating characteristic (ROC) curve and the calculation of the ROC, a measure of model discrimination.
Overall, 56 of the 60 included studies reported model discriminative ability (C-statistic), ranging from 0.2146 to 0.88.63 The area under curve for validation studies ranged from 0.5330 to 0.83,63 being slightly lower than those for the derivation study, 0.2146 to 0.88.63 For all-cause unplanned hospital readmission models, the C-statistic was reported by 14 studies ranging from 0.5513 to 0.80.22 Among 16 developed models and 2 existing models, 8 new models and 2 existing models had a C-statistic value >0.70.12 ,16 ,17 ,19 ,22 ,23 ,26 ,27
Regarding cardiovascular disease-related readmissions (24 studies), the C-statistic ranged from 0.2146 to 0.83632 across 32 developed models and 5 existing models. Of those, only nine developed models had a C-statistic value >0.70.30 ,32 ,34 ,35 ,38 ,40 ,41 ,49 ,50 In particular, 13 of the 17 models (12 developed and 5 existing) from 11 studies with the special focus on heart failure-related readmissions were presented with C-statistic <0.70.39 ,40 ,42–48 For surgical-related readmissions (6 studies), the C-statistic ranged from 0.5967 to 0.8569 among 7 developed models. Three of the seven models showed moderate-to-high discrimination ability.64 ,65 ,69 Patients with heart failure in the telemonitoring program were less likely to be admitted, with the reported C-statistic being 0.21.46 This indicates that the telemonitoring program was effective in identifying and intervening in patients who were reporting symptoms and thus reduced the likelihood of readmission.
However, 10 of 13 developed models and 1 existing model for medical condition-related readmissions (15 studies) were found to have consistent moderate discrimination ability. Four developed models also demonstrated high discrimination ability with C-statistic exceeding 0.80.53 ,52 ,57 ,63
This updated systematic review also identified one study on mental health condition-related unplanned hospital readmission. A predictive model, READMIT <(R) Repeat admissions; (E) Emergent admissions; (D) Diagnoses, and unplanned Discharge; (M) Medical comorbidity; (I) prior service use Intensity; and (T) Time in hospital>, was derived and validated using a 3-year Canadian National Health Database with a C-statistic of 0.63.
One existing predictive model, the LACE index, although validated by eight studies, demonstrated inconsistent model performance. The LACE index was first developed by van Walraven et al93 in 2010 to predict the risk of unplanned readmission or death within 30 days after hospital discharge in medical and surgical patients. The model was derived and validated based on administrative data with a C-statistic of 0.684. The model includes the length of hospitalisation stay (L), acuity of the admission (A), comorbidities of patients (C) and number of emergency department visits in the 6 months before admission (E). Five studies validated the LACE index model using healthcare data of Canada, Singapore, the UK and the USA to predict all-cause readmission (4),13 ,16 ,17 ,26 heart failure readmission (1)44 and general medical condition-related readmission (2).58 ,56 The discriminative ability of the model (C-statistic), reported by six studies, varied from 0.51 to 0.72.13 ,16 ,17 ,26 ,56 ,58
An extension of the LACE index to predict early death or all-cause 30-day urgent hospital readmission was further derived using administrative healthcare data and named as LACE+ index by van Walraven et al27 in 2012. The LACE+ index, in addition to four predictive variables, included patient age and sex, teaching status of the discharging hospital, acute diagnoses and procedures performed during the index admission, number of days on alternative level of care during the index admission and number of elective and urgent admissions to hospital in the year before the index admission. The LACE+ index had a C-statistic of 0.771, which exceeded the performance of LACE index. The LACE+ index was further validated by two large Canadian retrospective studies. The performance of the model was 0.6147 for patients with heart failure and 0.7323 for patients with all-cause hospital readmissions.
A Canadian study compared the performance of different models within the same population for 30-day readmission or death due to heart failure. A total of 59 652 patients' admission information was retrieved from four health databases over a 10-year period. Five models were examined in the study,47 namely Charlson, CMS Krumholz, Keenan, LACE index and LACE+. The five models had the C-statistic of 0.57–0.61. In terms of types of data sources used to develop or validate the 73 unique predictive models, administrative healthcare data were used for 17 models but were found/identified with inconsistent discriminative ability. A total of 13 of the 17 models reported C-statistic between 0.55 and 0.7, and the remaining four models reported C-statistic between 0.7 and 0.876. Similarly, the performance of the remaining 56 models using clinical/medical data varied between 0.21 and 0.88 (C-statistic).
Only two models32 ,53 were developed targeting the potentially avoidable/preventable unplanned hospital readmissions. The outcome measure of the models focused on the end-of-life patients53 and pneumonia, heart failure, acute myocardial infarction and chronic obstructive pulmonary disease.32 Both models had C-statistic >0.8 (0.85 and 0.83, respectively).
Sensitivity and specificity were calculated by 16 of the 60 included studies. The sensitivity of the predictive model ranged from 5.4% (PARR-30 model, Patients at Risk of Re-admission within 30 days)11 to 91.95% (potentially avoidable readmission (PAR) model),32 while specificity values were between 22% (Rehospitalisation Risk Score)24 and 99.5% (PARR-30 model).11
A total of 14 of the 60 included studies reported the PPV (5.641–86.61%32) and NPV (19.161–99.1%41) of the readmission risk predictive model. Similarly, only 17 studies calibrated the developed predictive models and mostly presented as p value, except one study68 that reported the model calibration as the value of intercept and slope.
Predictive risk of readmission was assessed in all included studies, but only 14 of the included 60 studies specified thresholds for risk categories. Thresholds ranged from 4%35 to 80%.61
Key variables included in the readmission risk predictive model
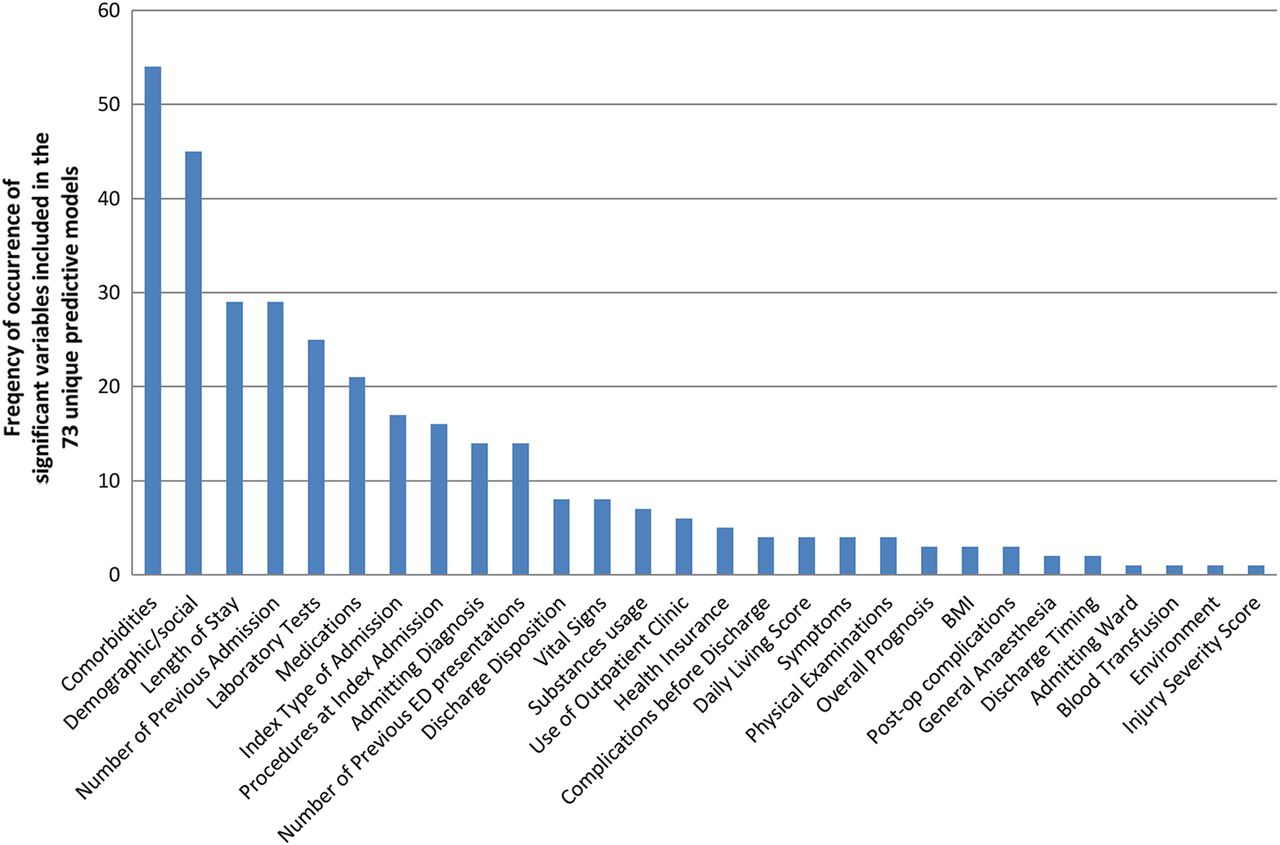
A total of 28 types of significant variables were extracted from the 73 unique predictive models for unplanned hospital readmissions as shown in table 3. Overall, the top 10 significant variables included in the 73 risk predictive models are comorbidities (n=54), demographic/social (n=45), length of stay (n=29), number of previous admissions (n=29), laboratory tests (n=25), medications (n=21), index type of admission (n=17), procedures at index admission (n=16), admitting diagnosis (n=14) and number of previous emergency department presentations (n=14) (refer to figure 2). The key demographic/social variables consisted of age (n=26), gender (n=25), living arrangement (n=12), race (n=8) and marital status (n=6).
Pareto chart of significant variables included in the predictive models. BMI, body mass index; ED, emergency department.
The variables ‘comorbidities’, ‘length of stay’ and ‘number of previous admissions’ remained as the most frequently cited predictive risk variables against all utilisation outcomes. However, the variables ‘laboratory tests’ and ‘medication’ were more commonly included in the predictive models for cardiovascular disease-related and medical condition-related unplanned hospital readmissions compared with all-cause, mental health and surgical condition-related unplanned hospital readmissions.
Discussion
A total of 60 studies with 73 unique risk predictive models for 28-day or 30-day unplanned hospital readmissions were included in this systematic review. The discrimination ability (C-statistic) of the 73 models varied largely from 0.21 to 0.88. Inconsistent performances were found among models for all-cause readmission, cardiovascular disease-related readmission and surgical-related readmission. However, most of the predictive models for the general medical condition-related readmission exceeded C-statistic of 0.7. In comparison, Kansagara et al10 included 26 models with the focus of adult medical patients only. A total of 13 predictive models measured 30-day readmissions; of these, 10 models performed poorly and only 3 models reported C-statistic >0.70. The outcome measures of the other 13 models ranged from 41-day to 4-year unplanned hospital readmission; as a result of the vast difference in the time frame, the C-statistic also varied from 0.53 to 0.75.
This updated systematic review has certain limitations. The studies included in this systematic review were limited compared with studies that were published in English with full-text access. The outcomes of the predictive models included in this systematic review were also restricted to 28-day or 30-day unplanned hospital readmission. A meta-analysis is not permitted in this systematic review as the included studies were heterogeneous due to diversity of cohort of population, duration of retrieved data source, sample sizes and geographical locations. It was noted that the sample size was reported in different units, that is, (index) admission/hospitalisation, cases, patients or discharges, as shown in table 1. The lack of standardised calculation could also contribute to the broad range of readmission rates (2.8–38%); thus, the results were not comparable. This systematic review also found the sample size is not associated with the model predictive ability. Of the included 73 unique models, Zai et al46 derived a model based on the selected 100 readmitted patients with heart failure and scored the lowest C-statistic of 0.21. In contrast, Whitlock et al63 retrieved around 200 readmitted patients with acute pancreatitis and developed a model with the highest discrimination ability (C-statistic=0.88).
There has been increased recognition that some unplanned hospital readmissions are associated with the diagnosis of the initial hospitalisation and could be potentially prevented or avoided through systematic discharge process. In 2006, a Swiss study94 compared three models (non-clinical model, Charlson-based model and SQLape model, A patient classification system, also designed to adjust for costs and other outcomes) to identify potentially preventable readmission risk on over 60 000 medical patients. The C-statistics of the three models were 0.67, 0.69 and 0.72, respectively, which indicated poor-to-reasonable discrimination ability. In contrast, this systematic review identified two high-performance models32 ,53 for potentially avoidable/preventable readmissions with C-statistic >0.8. The PAR model32 was also high in other predictive model performance indicators, such as sensitivity (91.95%), specificity (97.65%), PPV (86.61%) and NPV (98.65%). However, the two models were developed based on comparatively smaller sample size of 560032 and 10 27553 using American healthcare data collected over a 12-month period. Overall, the number of potentially preventable readmissions remains unclear due to lack of standardised identification process.95–98
Compared with the previous systematic review,10 there were more studies in this review using clinical medical record data to develop disease-specific predictive models. However, the debate whether a predictive model should be developed using administrative data or clinical/medical records data remains inconclusive. Three key variables extracted from the 73 unique models, ‘comorbidity’, ‘length of stay’ and ‘previous admissions’, were based on administrative data and were consistent with the findings of a previous systematic review.10 The latest evidence has shown that variables based on clinical medical data, that is, ‘laboratory tests’ and ‘medications’, were also valued in models for predicting cardiovascular-related and medical condition-related readmissions. Of note, ineffective communication in transitions of care is reported as a major contributing factor to adverse events that directly risk patient safety.99 ,100 Poor communication at discharge also leads to preventable unplanned readmissions and frequent problems with the continuity of medication management.101–103 None of the examined 73 models cited the comprehensiveness of discharge information as a predictor to unplanned hospital readmissions.
All included studies in this systematic review were based on adult population. To date, only two paediatric predictive models were identified and both were based on American paediatric populations. One retrospective multicentre study104 retrieved 12-month administrative data from 38 children's hospitals. A model was developed and internally validated with a high discrimination ability (C-statistic=0.81). However, the model outcome measure was 12-month all-cause readmissions. In comparison, a 30-day hospital readmission model105 was developed based on 5376 paediatric patients following plastic surgery procedures. The study accessed prospective medical records, and the model had moderate discrimination ability of C-statistic 0.784.
The performance of the 73 unique predictive models in this review was assessed using a variety of statistical measures. Inconsistency of reported statistical measures was noted in the included 60 studies, of which 2 studies44 ,58 reported threshold as the only model performance measurement. A US framework for assessing the performance of predictive models106 argued the importance of reporting discrimination and calibration for a risk predictive model. In all included 60 studies, the most reported measure of the risk predictive model is the ROC (C-statistic). The interpretation of the risk predictive model discriminative ability (C-statistic) was inconsistent. For instance, a study47 examined five predictive models and concluded that the models had moderate discrimination ability based on the C-statistic of 0.57–0.6; whereas models are typically considered reasonable when the C-statistic is higher than 0.7 by Hosmer and Lemeshow.71
Conclusion
The risk predictive models which focused on general medical conditions in relation to unplanned hospital readmissions reported moderate discriminative ability. Two models32 ,53 for potentially preventable/avoidable readmissions showed high discriminative ability. This systematic review, however, found inconsistent performance across the included unique 73 risk predictive models for unplanned hospital readmissions.
The variables ‘comorbidities’, ‘length of stay’ and ‘previous admissions’ were frequently cited across the examined unique 73 models, and ‘laboratory tests’ and ‘medication’ variables had more weight in the models for cardiovascular disease and medical conditions in relation to readmissions. However, comprehensiveness of discharge information was not included in any of the examined models.
This review highlighted the need for rigorous validation of the risk predictive models with moderate-to-high discriminative ability be undertaken, especially the two models32 ,53 for the potentially avoidable hospital readmissions. There is a need to review and update predictive models. Specifically this is essential for paediatric 28-day all-cause unplanned hospital readmissions as limited evidence was found.
Findings from this updated systematic review revealed an increasing number of developed risk predictive models for specific disease-related unplanned hospital readmission using clinical/medical records data. Findings from this systematic review also confirm the limited applicability of hospital readmission risk predictive models. The performance of the applied existing models was inconsistent. It is, therefore, essential to clearly define utilisation outcomes and the type of accessible data sources prior to determining which risk predictive model to use. For example, most of the models were developed based on healthcare data from the USA, which might not be applicable to patients from other settings.
Acknowledgments
The authors would like to acknowledge Ms Marta Rossignoli, librarian of Child and Adolescent Health Service, Western Australia, for her assistance in the literature search.
References
Footnotes
▸ Additional material is available. To view please visit the journal online (http://dx.doi.org/10.1136/bmjopen-2016-011060).
Contributors HZ, SD and PD contributed to the design of the review. HZ, SD, PD and LG acquired the data. HZ, SD, PD, PR and LG contributed to analysis. HZ wrote the draft. HZ, SD, PR and PD critically revised the intellectual content of this work.
Funding This study is funded by a grant from the Australian Research Council—ARC Linkage Grant (Project ID: LP140100563). HZ is also supported by the Academic Research Grant from the Nursing and Midwifery Office, Western Australia Department of Health.
Competing interests None declared.
Provenance and peer review Not commissioned; externally peer reviewed.
Data sharing statement No additional data are available.