Article Text

Abstract
Objectives The number of quit attempts it takes a smoker to quit successfully is a commonly reported figure among smoking cessation programmes, but previous estimates have been based on lifetime recall in cross-sectional samples of successful quitters only. The purpose of this study is to improve the estimate of number of quit attempts prior to quitting successfully.
Design We used data from 1277 participants who had made an attempt to quit smoking in the Ontario Tobacco Survey, a longitudinal survey of smokers followed every 6 months for up to 3 years beginning in 2005. We calculated the number of quit attempts prior to quitting successfully under four different sets of assumptions. Our expected best set of assumptions incorporated a life table approach accounting for the declining success rates for subsequent observed quit attempts in the cohort.
Results The estimated average number of quit attempts expected before quitting successfully ranged from 6.1 under the assumptions consistent with prior research, 19.6 using a constant rate approach, 29.6 using the method with the expected lowest bias, to 142 using an approach including previous recall history.
Conclusions Previous estimates of number of quit attempts required to quit may be underestimating the average number of attempts as these estimates excluded smokers who have greater difficulty quitting and relied on lifetime recall of number of attempts. Understanding that for many smokers it may take 30 or more quit attempts before being successful may assist with clinical expectations.
- smoking cessation
- population
- longitudinal
- addiction
This is an Open Access article distributed in accordance with the Creative Commons Attribution Non Commercial (CC BY-NC 4.0) license, which permits others to distribute, remix, adapt, build upon this work non-commercially, and license their derivative works on different terms, provided the original work is properly cited and the use is non-commercial. See: http://creativecommons.org/licenses/by-nc/4.0/
Statistics from Altmetric.com
Strengths and limitations of this study
Uses multiple methodologies to improve upon estimates of the number of attempts it takes a smoker to quit.
Novel use of life table methodology to overcome issues of censoring.
Population estimates of cessation derived from a large, longitudinal, population representative study designed to assess smoking cessation every 6 months for up to 3 years.
Findings reflect a population average and are not individually predictive.
The definition used of a successful quit was cessation to 1 year, but significant likelihood of relapse for some after that point.
Introduction
Tobacco use is the number one cause of preventable mortality. Five million deaths each year are attributable to smoking, with an estimated rise to as much as 10 million deaths per year by the 2030s.1 Yet, despite the widespread awareness of the harms of smoking, millions continue to smoke around the world partly due to the difficulty it takes to quit smoking.
Mark Twain is reported to have said, ‘Quitting smoking is easy: I've done it thousands of times’. Smoking cessation is a difficult and complex process, and smokers use many methods and approaches to achieve cessation. Knowing how many quit attempts it takes an average smoker to quit is important as it can frame different narratives about the quitting process. This information can be used to inform smoking cessation advice and important messages to stay engaged in the process of quitting. Alternatively, knowing the average number of quit attempts may be a deterrent to continue trying.
For this reason, the number of quit attempts it takes before smokers are successful at quitting is a statistic that figures prominently in much of the literature on smoking cessation programmes. For instance, the American Cancer Society suggests that it takes 8–10 quit attempts,2 while the Australian Cancer Council suggests that it is 12–14 attempts.3 The Centers for Disease Control and Prevention suggests 8–11 attempts before quitting permanently.4 Many practitioners believe that it takes five to seven attempts.5 One document on smoking cessation by a maker of smoking cessation medication6 cites that most smokers quit five to seven times before they succeed, referencing a review article,7 which refers to a 1995 Epidemiological Review article8 that only indirectly refers to this statistic.
We know that the likelihood of quitting smoking on any given quit attempt is low;9 however, providing an accurate determination of the number of quit attempts the average smoker takes to succeed is extremely difficult. Current estimates appear to come from recalled lifetime quit attempts among smokers who had successfully quit. For instance, a recent Gallup poll of Americans found that former smokers had made an average of 6.1 quit attempts before quitting successfully.10 The cross-sectional Canadian Tobacco Use Monitoring Survey reported that former smokers had 3.2 prior quit attempts.11 Similarly, the estimate of 12–14 attempts reported by Zhu et al12 was derived from cross-sectional data in California. However, the use of cross-sectional data has severe limitations, as it depends on a smoker's ability to remember past quit attempts over a lifetime. The number of recalled quit attempts is significantly lower in cross-sectional assessments compared with longitudinal assessments.13 These estimates are also biased as they only account for successful quitting among people who are able to quit and do not consider all quit attempts from those whose data were censored—those who have yet to succeed. Consequently, we should expect that the real number of attempts prior to quitting successfully should be substantially higher than these estimates.
One study suggests that these estimates are too low. Borland et al used data from the longitudinal International Tobacco Cohort to estimate that the average smoker had made 40 attempts by the age of 40.13 While Borland’s study does not directly address the question of average number of quit attempts taken before quitting successfully, it demonstrates that smokers attempt to quit at the rate of approximately once per year. If it did take five to seven attempts to quit successfully, at an average of one quit attempt per year, we would expect to see very few smokers over the age of 30 years.
If we assume that each quit attempt is an independent event, this allows us to use basic probability to come up with the geometric mean, which is calculated by dividing 1 by the probability of that event. If it does take five to seven attempts on average as suggested, then one must assume that the success rate for each attempt is somewhere between 14% and 20%—a figure that does not consistently align with the literature for long-term success.4 ,9 ,14 ,15 Thus, we should expect, a priori, that the lifetime number of quit attempts should be substantially higher than the five to seven attempts figure.
However, the real number of attempts needed to succeed should be even higher, as the assumption of independence of quit attempts is not realistic. We should expect that the average chance of success will decrease over repeated quit attempts. Those who will have an easier time quitting will succeed on early attempts, whereas those who struggle may repeatedly try and relapse, making the average success rate for early quit attempts higher than subsequent ones. Partos and colleagues found that smokers who had one or more recent failed quit attempts were indeed less likely to quit successfully.16
It may be possible to improve on the estimate of the number of quit attempts prior to quitting successfully. A standard life table translates cross-sectional age-specific mortality rates into a theoretical cohort lasting from birth to death.17 The same probability approach could be used to model the change in a hypothetical cohort of quitting smokers where the probability of exit changes by ‘quit age’ (1 for first attempt, 2 for second attempt, and so on). This approach would translate cross-sectional (longitudinally observed but in a cross-section of time) quit attempt-specific success rates into a theoretical cohort lasting from the first to the last quit attempt. The calculation of the chance of success based on the number of previous quit attempts would allow for a calculation of an average of the number of attempts to quit that does not depend on an assumption that quit attempts are independent events. This approach would also allow for the inclusion of unsuccessful quitters into the average that were not included in previous work.
The purpose of this paper is to improve on the literature estimating the number of attempts it takes to quit smoking successfully by calculating the number under four different sets of assumptions.
Methods
Participants
We primarily used data from the Ontario Tobacco Survey (OTS), a population-based longitudinal panel survey of smokers (18 years of age and over) in Ontario, Canada. Smokers were followed for up to 3 years at ∼6-month intervals (baseline survey plus 6 follow-ups) with recruitment beginning in 2005. Recruitment was staggered so that the survey interviews were conducted between 2005 and 2011. The smoker response rate was 61%. Participants were selected through random digit dialling stratified by region of Ontario, and characteristics of the sample were consistent with census data from Ontario.18 Further details of the questionnaire, variables, sampling and recruitment processes are documented online at http://otru.org/research-evaluation/ontario-tobacco-survey/ots-technical-documentation/.18 The full sample consisted of 4501 recent (past 6-month smokers) of those 4501 recent smokers and 3960 were current (past month smokers). For this study, to study quit attempt-specific quit rates, only respondents (n=1277) identified as current smokers (past month) at baseline and who self-reported a serious quit attempt at follow-up 1, follow-up 2 or follow-up 3 were included. The eligible participants made a total of 3362 quit attempts. Previous studies of the OTS have examined the predictors associated with making a quit attempt and the individual risk factors associated with successful quitting in this cohort, which include fewer previous quit attempts, higher level of education, belief that it would not be hard to quit and lower perceived addiction.18 The characteristics of the sample are representative of the characteristics of smokers making a quit attempt in Ontario (see table 1). The OTS was approved by the institutional review boards of the University of Toronto and the University of Waterloo.
Characteristics of current smokers at baseline in the Ontario Tobacco Survey who had made at least one quit attempt (n=1277)
Among eligible participants at baseline, only 400 (10.1%) did not provide follow-up data. Those without follow-up data were younger (37.6 vs 44.2 years) and more likely to be male than were those who were included in the analysis; however, there was no difference in smoking behaviours (self-perceived addiction, intentions to quit, daily smoking status and number of cigarettes smoked per day) for those with follow-up data compared with those without follow-up data. Of those participants who made an eligible quit attempt, 91 were lost to follow-up before a successful or unsuccessful quit attempt could be ascertained (see table 2). Adjusting for time in study, there were no differences in demographics or smoking behaviours comparing with lost to follow-up to other eligible participants.
Number of eligible participants lost to follow-up prior to ascertainment of outcome
Measures
Lifetime quit attempts at baseline: At baseline, participants were asked, ‘How many times have you EVER made a serious attempt to quit smoking? By serious, we mean that you made a conscious attempt to stay off cigarettes for good’.
Quit attempts over follow-up: At each follow-up, respondents were asked, ‘In the past 6 months, how many times did you make a serious attempt to quit smoking? By serious, we mean that you made a conscious attempt to stay off cigarettes for good’.
Successful quit: A successful quit was defined as one that lasted for at least 1 year, as assessed by self-reported time since last cigarette. Time since last cigarette was asked at each follow-up by asking participants, ‘Have you smoked a cigarette since we last spoke with you in [Date of Interview]?’ and ‘How long ago was it that you last smoked a cigarette?’ All available follow-up data were used to assess successful quitting until at least 1 year without relapse had occurred.
Statistical analysis
This study takes four different approaches to estimating the number of quit attempts each with their own sets of limitations. These analyses are descriptive of the data. The first method is a count of the number of attempts; the second is the calculation of the mean based on a simple probability calculation; Methods 3 and 4 rely on a novel use of a life table analysis. Probability of quitting successful for each of the methods, both overall and quit attempt number specific, is based on observational data from the OTS. We calculated the estimate for each method across the overall sample, as well as within subpopulations of smoking frequency at baseline (daily, less than daily).
Method 1: Recalled quit attempts, among successful quitters. We identified the mean number of quits of successful quitters (quit for >1 year) as reported by participants who made successful quits in the OTS cohort. We then added the number of recalled quit attempts at baseline to this figure.
Formula for Method 1:
This method corresponds to the assumptions that have been used previously to calculate the average number of quit attempts before quitting successfully using cross-sectional surveys. We expect theoretically that this method will underestimate the number of quit attempts given the known issues with ability to recall quit attempts, which will be much more severe over a lifetime compared with a 6-month period.13 This method also censors the results of unsuccessful smokers, making this more precisely stated as an estimate of the number of attempts of those who are successful at quitting smoking.
Method 2: Constant rate assumption. In this method, we assumed that the rate of success is constant over individuals and that each individual quit attempt is independent of previous quit attempts. That is, it assumes that the chances of being successful on any one quit attempt do not depend on previous attempts to quit, so we can calculate the number of attempts expected prior to quitting based only on our estimate of success rate per quit.
The median and mean attempt numbers are calculated from the geometric distribution—the probability distribution of the number of Bernoulli trials prior to achieving one success, using the formula: where p is the probability of success to derive the mean.
The probability of long-term success was based on the percentage of quit attempts that were successful among all quit attempts among attempts observed in the OTS survey (170 successful quits out of 3362 attempts, 5.1%) and for daily and occasional smokers separately (4.9% (n=2930) and 6.0% (n=432), respectively).
Theoretically, we expect this calculation to underestimate the number of quit attempts. Quit attempts are unlikely to be independent events as probability of success decreases with multiple quit attempts (see figure 1).
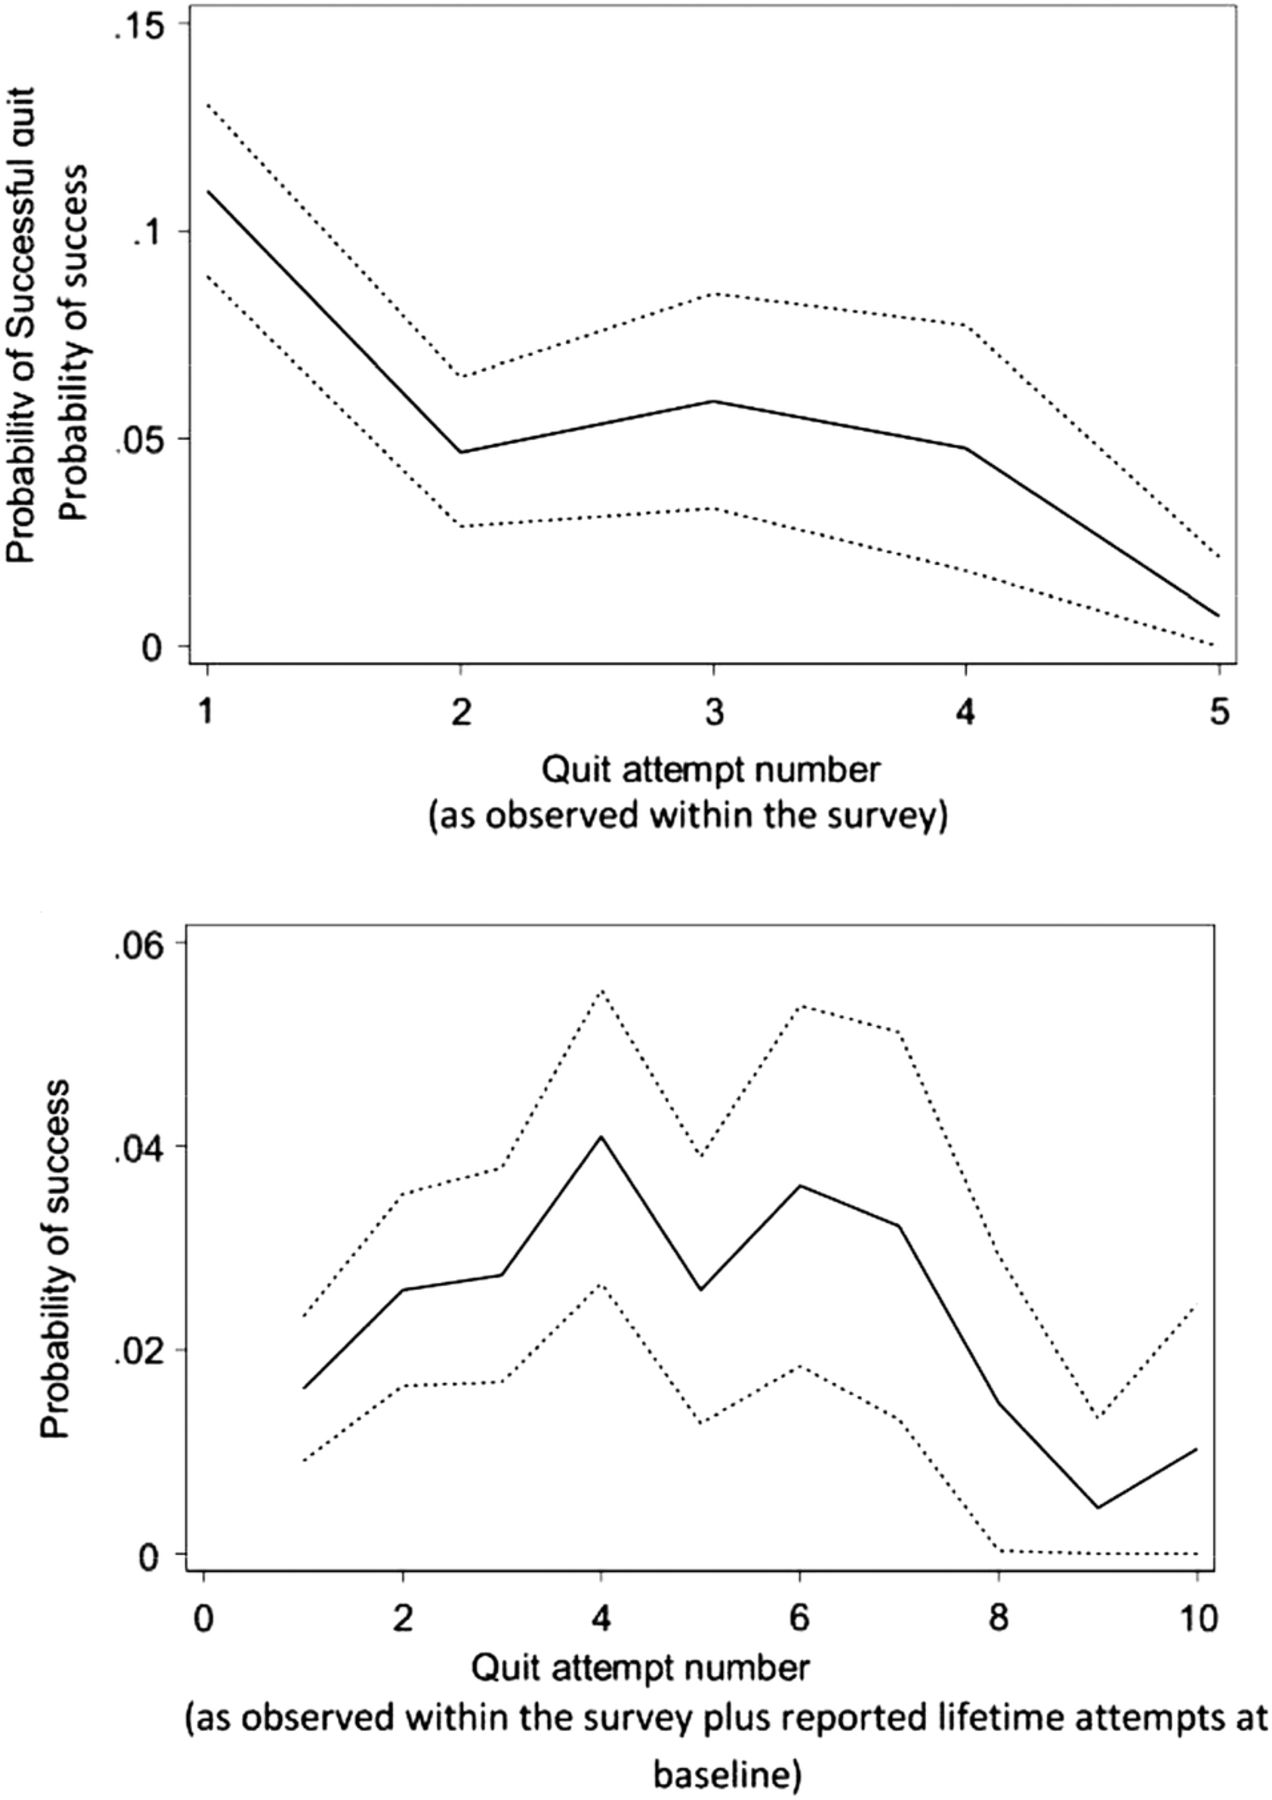
Estimated probability of successful quitting (quit attempt of longer than 1 year) by quit attempt number in the Ontario Tobacco Survey. The top figure includes only observed quit attempts, while the bottom figure also includes reported quit attempts prior to study entry. Dotted lines represent upper and lower CIs. A life table analysis was used to calculate probabilities (n=1277).
Method 3: Variable rate assumption, observed quit success rates. In this method, we assumed that the rate of success per quit attempt was not independent (in contrast with Method 2) but that instead the chance of success varies by previous number of attempts. That is, we recognised that the predicted probability of success is less if we know that they have tried and failed to quit previously. Figure 1 demonstrates that probability of success does decrease with increasing number of attempts. We used only attempts reported during the period of the study in this method.
To do this, we first calculated the probability of a successful quit per quit attempt observed. We estimated the probability of success for each quit attempt using a standard life table approach.17 We used quit attempt number as the unit of ‘age’ in a life table calculation of survival, where the outcome was successful quitting.
We observed quit attempt ‘age’, that is, the cumulative attempt number, and coded whether each attempt was successful or unsuccessful. Then, we calculated the following quantities:
. ni, the number of people who have not quit successfully (>1 year) at quit attempt i (normally the number of survivors for that age interval);
. ei, the number of successful quits that occur at that quit attempt i;
. qi, the estimated probability of quitting successfully at quit attempt i (calculated as ei/ni);
. pi, the estimated probability of not quitting successfully at quit attempt i (calculated as pi=1−qi); and
. si, the estimated probability of not quitting successfully from baseline to the end of the quit attempt i (calculated as p0×p1×p2×…pi).
We adjusted for the influence of right censoring (quit attempts that are not observed as they occur after the period of study observation) using the standard actuarial method by calculating ni: subtracting half the number in the period that was censored after a quit attempt was observed. This calculation provides an estimate of the probability of success by quit attempt number, and cumulative probability of success. The expected average number of quits prior to quitting successfully was then obtained by calculating the area under the curve (equivalent to the restricted mean).20
We expect that this method will modestly underestimate the number of quit attempts. Ignoring previous quitting history will attribute a greater probability of success to earlier rather than later attempts (many of the first and second attempts observed are likely to be people who are making their third or higher lifetime quit attempt), which will produce an overestimate. We also do not know what the effect on success rates would be of quit attempts made in relatively short succession after a failed attempt, compared to attempts made further apart. Given that earlier probabilities will have a bigger effect on the area under the curve that is used to produce the mean, we expect that the overall bias in this method will be a relatively modest underestimate, and provide the best estimate of the number of quit attempts.
Method 4: Life table, with recalled lifetime quit numbers. We repeated the life table analysis as in Method 3; however, for this method, we calculated the probability of success per quit attempt on a lifetime basis, by adding the lifetime recalled quit number at baseline to the observed quit attempts under observation in the survey for each individual. That is, quit attempt i was calculated as the sum of recalled lifetime quit attempt plus the observed quit attempt number.
We expect that this method will overestimate the effect. Unlike with Method 3, Method 4 censors the data from successful smokers, estimating, in essence, the average number of quit attempts among those with difficulty in quitting. The method has a similar but opposite issue to that of Method 1, recalled life attempts among successful smokers. Where Method 1 excludes information from people who have not yet quit, underestimating the result, Method 4 does not account for people who have already quit, overestimating the effect. However, the use of lifetime recall quit attempt will underestimate the total number of quit attempts.
Results
Method 1: Recalled quit attempts, among successful quitters: Among those who successfully quit, the average number of attempts reported during 18 months of observation was 2.0 (SD: 3.15). Among those who did not successfully quit, there were 2.9 attempts (SD: 3.4). Adding all previous lifetime quit attempts reported by each smoker to their total number of observed attempts (4.3, SD: 0.25, attempts at baseline) suggests that the successful quitter reports an average of 6.3 (SD: 1.4) lifetime quit attempts. Successful daily smokers reported a mean of 6.8 (SD: 1.6) lifetime attempts, while successful occasional smokers reported a mean of 4.7 (SD: 0.6) lifetime attempts (table 3).
Estimate of the number of quit attempts made prior to successfully quitting for 1 year or longer among 1277 smokers in the Ontario Tobacco Survey for four different methods of calculation
Method 2: Constant rate assumption: Using the estimated 5.1% success rate per quit attempt found in this population, the geometric mean is then 19.6 quit attempts before quitting successfully. When stratified by frequency of smoking, the expected average number of quit attempts before quitting successfully would be 20.4 quit attempts for daily smokers and 16.7 attempts for occasional smokers (table 3).
Method 3: Variable rate assumption, observed quit success rates: Using observed quit attempts, the probability of a successful quit was highest on the initial quit attempt (11% success); the second attempt was much lower at 5% success, while subsequent attempts were even less likely to succeed (figure 1). Using this distribution of quit attempts in the life table analysis, we found that the average number of quit attempts expected in order to succeed was 29.6 (95% CI 27.6 to 31.6) attempts (area under the survival curve, figure 2). The calculation when stratified by smoking frequency suggested that the average number of attempts for occasional smokers was much fewer (table 3).

Absolute survival probability (per cent who have not quit successfully) of reported quit attempts of longer than 1 year during the first 18 months of observation in the Ontario Tobacco Survey. The top figure includes only observed quit attempts, while the bottom figure also includes reported quit attempts prior to study entry. Dotted lines represent upper and lower CIs. A life table analysis was used to calculate survival probabilities (n=1277).
Method 4: Life table, with recalled lifetime quit numbers: When the lifetime number of recalled quit attempts were included to the probability of quitting on a given quit attempt, the likelihood for success peaks on the fourth to sixth attempt (figure 1), roughly the average of previously recalled quit attempts among the population of those attempting to quit, with subsequent attempts much less likely to be successful. Using this distribution of probability of quitting per quit attempt using the life table approach, the mean number of attempts was 142.0 (95% CI 122.8 to 161.2); daily smokers had a mean of 142.3 (95% CI 122.8 to 161.9), while occasional smokers had a mean of 21.0 (95% CI 18.3 to 23.7; table 3).
Discussion
The average number of quit attempts is likely significantly higher than what is generally communicated to smokers. Under what we consider to be the best set of assumptions (Method 3: Life Table, Observed Quit Rates), this study suggests that a current smoker tries to quit on average 30 times or more before successfully quitting for 1 year or longer. The life table approach within this population-representative longitudinal cohort overcomes some of the challenges of estimating the number of quit attempts it takes a smoker to quit for good. Previous estimates of how many quit attempts it takes to quit used populations of former smokers exclusively; these estimates are significantly biased by difficulty in recalling past quit attempts, and by not accounting for the large number of people who try to quit but who are never successful.9 ,11 ,12
We selected Method 3: Life Table, Observed Quit Rates as the best set of assumptions as it accounts for the biases (lifetime recall, independence assumption, exclusion of unsuccessful quitters) that affect Method 1 (Recalled Attempts Among Successful Quitters) and Method 2 (Constant Rate Assumption), and consequently provides a better estimate of the average number of attempts prior to quitting successfully than those two methods. Arguably, Method 4: Life Table, Recalled Lifetime Quit numbers improves upon Method 3 as it uses a distribution of success per quit attempt that may be more realistic. That is, Method 4 demonstrates that, as expected, the highest success rates are not on the first lifetime quit attempt, but rather peak after a number of quit attempts, before declining. However, the downside of Method 4 is that it is likely underestimating the quit success rates, particularly for the early attempts as we were unable to measure the quit success of people who quit prior to study entry and who conceivably were people who found quitting easier. The implication is that the 30-attempt estimate is likely still underestimating the true average number of attempts, but the true estimate is likely lower than that obtained for Method 4.
The estimate of 30 attempts is consistent with the estimate of quitting behaviour from Borland et al13 who found an annual rate of quit attempts of ∼1 per year. Given that most smokers begin smoking as adolescents, at an average of one quit per year, if, on average it takes 30 attempts to quit, we would expect the average smoker to quit in their late 40s or early 50s—consistent with clinical observations.
It is important to note that this is a descriptive estimate, and not a normative one. This has two implications. The first is that it is important to consider the results as an average of a population, rather than any one individual experience. Despite a high number of quit attempts needed to quit was found on average in this study, many individual smokers are able to quit successfully on relatively few attempts.21 Ashley et al22 suggested that between 40% and 52% of former smokers quit the first time they make a serious attempt to do so. This is consistent with the assumption that quit attempts are not independent—those who have difficulty quitting will need to make many more quit attempts to succeed than those who have less difficulty. While many people may be able to quit smoking on the first few attempts, others may not be able to quit after hundreds of attempts. Efforts can also be taken by individuals to improve their chances of success, such as using quit aids, or receiving counselling.
The second implication of this is, as a descriptive statistic, the estimates here in this study describe the experience of this population, given the population distribution of these factors at the time. To compare the estimate of average number of quit attempts from one jurisdiction or time period to another may theoretically require standardisation of these factors to the Ontario population at this time. While there are many factors that affect the ability to quit smoking, these estimates can be considered accurate for this population. The correspondence between the estimate found in this study (6.1) to those prior estimates that were made under the similar sets of assumptions (ie, five to seven attempts)21 suggest that there are minimal systematic differences in quitting behaviour or recall in this cohort compared to other surveys on which previous estimates were based. Thus, the differences in the estimates can be attributed primarily to the different methods rather than the uniqueness of the Ontario, Canada population of smokers.
Limitations
This study defined quit attempt as a ‘serious quit attempt’ as self-perceived by the smoker. Other definitions of quit attempts that require smokers to be abstinent for a certain amount of time (such as 24 hours or 1 week) add significant bias by excluding those smokers who are least likely to quit and have the most difficulty maintaining abstinence.23 While some quit attempts may indeed be more serious than others, the amount of effort for each of these attempt was reported as attempt to quit for good, which is the more relevant factor than the amount of time abstinent prior to the quit attempt.24 On the other hand, it is possible that ‘rapid fire’ quit attempts may be less likely to succeed than those spaced further apart.16 Finally, while recall of quit attempts over a 6-month period is more accurate than recall of lifetime quit attempts, it is likely that some quit attempts were incorrectly recalled within this period.
Quit success was assessed at 1 year. While many smokers can maintain abstinence after 1 year of successful quit, over 37.1% of those may subsequently relapse.25 No biochemical verification of abstinence was used; however, a review by the Society for Research on Nicotine and Tobacco (SRNT) Subcommittee on Biochemical Verification26 concluded that biochemical validation is not always necessary in smoking cessation studies, because the levels of misrepresentation are generally low (0–8.8%). These limitations of the definition of these factors suggest that the quit success per attempt is likely overestimated in this study, which would further increase the estimate of average of number of quit attempts prior to quitting.
The average number of quit attempts prior to a successful quit is a number that is inherently difficult to capture with full certainty; nevertheless, this study improves upon the estimation of the average number of quit attempts. Most accepted previous estimates have relied on recalled data from cross-sectional studies, and have not addressed the issues of censored data from smokers who have not yet or will not ever quit. The life table methodology with the use of longitudinal survey data addresses some of these previous limitations to provide a more realistic estimate of the experience of smokers.
Implications
Knowing that many smokers try and fail on multiple attempts leads to three potential implications. The first suggests that we need to recognise that quit attempts occur frequently, and that further increasing the frequency of these attempts and the rate of success on these attempts may be required to reduce smoking prevalence in a population. For any given quit attempt to be successful, many more resources may be needed, particularly evidence-based resources such as pharmaceutical aids and counselling.27 Environmental changes that encourage quitting, such as price increases and smoke-free laws, with little or no marginal cost per quit attempt should be seen as important in cost-effective smoking cessation systems.28
More research is needed to understand how best to communicate to smokers about the number of quit attempts prior to successful quitting. Our study does demonstrate that it takes many more quit attempts to succeed than previously estimated. It is possible that being realistic about the chances of success and the length of time it may take to become a successful quitter may help facilitate a positive, long-term relationship with healthcare providers. Smoking is a chronic condition, and an appropriate estimation may help avoid treating quit attempts as discrete, acute events. On the other hand, communicating the specific number to patients may not be helpful. It may be that some smokers may be discouraged by hearing how difficult it can be to quit smoking. Further research to help customise risk messaging and supportive interventions is required for those who have a number of previously failed attempts to quit and for new smokers just beginning their journey to quitting.
References
Footnotes
Contributors MC conceived the study. MC, AP and LD performed the analysis. JEC, SJB, PS and RS designed and implemented the survey. All authors contributed to writing and interpretation.
Funding The Ontario Tobacco Research Unit and the Ontario Tobacco Survey are supported by the Ontario Ministry of Health and Long-Term Care. This work is supported by Canadian Cancer Society grant #702160 (MC). The funders had no role in the study design, collection, analysis or interpretation of the data, writing the manuscript, or the decision to submit the paper for publication.
Competing interests None declared.
Ethics approval University of Toronto and University of Waterloo Research Ethics Boards.
Provenance and peer review Not commissioned; externally peer reviewed.
Data sharing statement Research teams may apply for access to OTS data through one of the following university-based data libraries: Propel Centre for Population Health Impact—Population Health Data Repository at the University of Waterloo (http://www.propel.uwaterloo.ca/index.cfm?section=28&page=377) or the University of Toronto Data Library (http://www.chass.utoronto.ca/datalib/).