Article Text

Abstract
Objective To investigate associations between exposure to air pollution and child and adolescent mental health.
Design Observational study.
Setting Swedish National Register data on dispensed medications for a broad range of psychiatric disorders, including sedative medications, sleeping pills and antipsychotic medications, together with socioeconomic and demographic data and a national land use regression model for air pollution concentrations for NO2, PM10 and PM2.5.
Participants The entire population under 18 years of age in 4 major counties. We excluded cohort members whose parents had dispensed a medication in the same medication group since the start date of the register. The cohort size was 552 221.
Main outcome measures Cox proportional hazards models to estimate HRs and their 95% CIs for the outcomes, adjusted for individual-level and group-level characteristics.
Results The average length of follow-up was 3.5 years, with an average number of events per 1000 cohort members of ∼21. The mean annual level of NO2 was 9.8 µg/m3. Children and adolescents living in areas with higher air pollution concentrations were more likely to have a dispensed medication for a psychiatric disorder during follow-up (HR=1.09, 95% CI 1.06 to 1.12, associated with a 10 µg/m3 increase in NO2). The association with NO2 was clearly present in 3 out of 4 counties in the study area; however, no statistically significant heterogeneity was detected.
Conclusion There may be a link between exposure to air pollution and dispensed medications for certain psychiatric disorders in children and adolescents even at the relatively low levels of air pollution in the study regions. The findings should be corroborated by others.
- EPIDEMIOLOGY
- PUBLIC HEALTH
This is an Open Access article distributed in accordance with the Creative Commons Attribution Non Commercial (CC BY-NC 4.0) license, which permits others to distribute, remix, adapt, build upon this work non-commercially, and license their derivative works on different terms, provided the original work is properly cited and the use is non-commercial. See: http://creativecommons.org/licenses/by-nc/4.0/
Statistics from Altmetric.com
Strengths and limitations of this study
Longitudinal cohort approach covering the entire population under 18 in four major counties in Sweden (roughly half of the Swedish population).
High statistical power allowing for separate analyses in the four counties.
Register-based data reduce risk of certain bias.
The outcome, any dispensed medication in the group N05, is a very crude measure of mental health.
Introduction
Mental disorders are experienced by 10–20% of all children and adolescents worldwide. These disorders may severely influence children's development, educational attainment and the potential to live fulfilling and productive lives. Air pollution is a complex mixture that most likely affects human health through multiple pathways, and air pollution has been named by the WHO as one of the biggest health threats of our time.1 Oberdörster and Utell2 first suggested that the brain might be vulnerable to ultrafine ambient particulate matter. Recently, concern has been raised over the effect of air pollution on the central nervous system.3 Two early studies linked ambient photochemical oxidants to anxiety symptoms4 and depression5 in humans in California. Monthly or weekly levels of air pollution were observed to be associated with anxiety symptoms in the Nurses' Health Study,6 and with perceived stress in the Veterans Administration Normative Aging Study in the USA,7 and a number of studies have observed associations between daily fluctuations in air pollution and mental health outcomes such as depressive symptoms, suicide and emergency calls.8–16 Perceived environmental noise and low air quality have been linked to mental health outcomes in adults such as depression.17 Epidemiological studies have shown that living in areas with elevated concentration of air pollution is linked with decreased cognitive function,18–23 lower neurobehavioural testing scores in children,24 a decline in neuropsychological development in the first 4 years of life25 and elevated risk of autism spectrum disorders.26–32 Furthermore, children in Spain who attended schools with higher traffic-related air pollution have been observed to have a smaller improvement in cognitive development than children who attended schools with lower traffic-related air pollution.33 In a review from 2012 on epidemiological studies on neuropsychological effects of air pollution, the authors conclude that there is evidence for air pollution to be associated with mental development and mental decline.34 The National Institute of Environmental Health Sciences/National Institute of Health has convened an expert panel to identify research gaps and priority goals in the field of air pollution and mental disorders such as depression,3 and expressed the need for well-designed studies with good data on exposure, outcomes and possible confounders or mediators of effect.3 They were highlighting several methodological challenges when investigating air pollution and brain health. For example, parental mental health could influence exposure via socioeconomic status since there are often strong associations between socioeconomy and air pollution levels.
It has been argued that socially disadvantaged people tend to be segregated in relatively deprived areas with a worse environmental quality,35 ,36 and there are often strong socioeconomic gradients in mental health.37 Social characteristics may therefore modify the association between air pollution and mental health and also act as a major confounder. There is little consensus on the causal relationship between urbanisation and mental health, but it seems as if urban and rural environments can have pernicious and salutary consequences on mental health.38 Factors with strong urban–rural gradients related to the environment such as air pollution concentrations are often neglected as a possible cause of mental health problems. Neighbourhood poverty has, for example, been observed to affect mental health in children,39 but there were no adjustments done for neighbourhood air pollution concentrations.
The severe impact of child and adolescent mental health problems on society, together with the plausible and preventable association of exposure to air pollution, deserves special attention. In the present study, the hypothesis was that air pollution may be a risk factor for psychiatric disorders in children and adolescents. Our specific objective was to study associations between neighbourhood residential air pollution concentrations and mental health in children and adolescents. We did so in a longitudinal study, by assessing exposure to air pollution using a nationwide model, in combination with data on dispensed medications for a broad group of psychiatric disorders, and data on potential confounders from nationwide registries in a study population consisting of the entire population of the study area in Sweden.
Methods
Study area
We used a longitudinal study design where the study subjects were all individuals under 18 years of age who at any time during the study period 1 January 2007–31 December 2010 had a registered residential address in any of the four Swedish counties Stockholm, Västra Götaland, Skåne and Västerbotten (figure 1). Stockholm County is located on the eastern coast of Sweden, includes the capital and had a population of just over 2.2 million in early 2015, with a population density of 338/km2. Västra Götaland County is on the western coast and includes the second largest city in Sweden, Gothenburg; it had a population of 1.6 million people in early 2015, with a population density of 68/km2. Skåne County is the southernmost county in Sweden and contains the third largest city, Malmö, with a population of nearly 1.3 million in early 2015, with a population density of 114/km2. Västerbotten County is located in the Northern part of Sweden, with a total population of just over 260 000in early 2015, and with a population density of 5/km2. The major part of the population in Västerbotten County lives near the coast, whereas large regions in the inland are very sparsely populated. The four counties are different not just in terms of geographic location, size and population density but also with respect to migration, socioeconomic characteristics, urbanisation and air pollution concentrations.

Study area with air pollution concentrations.
Swedish National Register data
We used register data from the Swedish National Board of Health and Welfare on a group of dispensed medication for medicine related to psychiatric diagnoses defined by the Board of Health and Welfare. Data on dispensed medications are available on the entire Swedish population from 1 July 2005. The medication group used as outcome in this study includes any medication with a Swedish ATC code starting with ‘N05’, hereafter referred to as N05. N05 consists of neuroleptics (antipsychotic medications), ataractics and sleeping pills (a broad group of sedative medications including hydroxyzine and melatonin-based medications). The majority of dispensed N05 medications for children and adolescents are sedative medications and sleeping pills. It should be noted that antidepressants or attention deficit hyperactivity disorder (ADHD) medications are not included in the N05 group. We had access to the number of times each year during follow-up an individual had dispensed an N05 medication (figure 2), but for integrity reasons, we could not obtain data on the exact type of medication within the N05 group. We defined an event as a dispensed N05 medication at least once during follow-up. Individuals who had a record of an N05 dispensed medication from July 2005 (start date of the register) to 31 December 2006 (the year and a half before start of follow-up) were excluded from the analysis. An event was recorded the first year during follow-up that a N05 medication was dispensed and the event date was set to 1 July (we did not have access to the date each respective year the medication was dispensed). Each cohort member was followed up until an event occurred, loss-to-follow-up (meaning that they had no longer a registered address in the study area), death, 18th birthday or end of follow-up, whichever came first. We used an open cohort approach and continuously included cohort members from date of birth, or individuals moving to the study area from 1 January the year after they moved in. For practical reasons, an individual who moved out of the study area was censored and not included again if he or she moved back. We excluded individuals whose parents had N05 medications dispensed since the start date of the register. The total size of the cohort after exclusions was 896 117 individuals. We ran complete data models, meaning that individuals with missing data on any of the variables including in the models were excluded from analysis. The total size of the complete cohort was 552 221 individuals (figure 3).

Histogram over the number of dispensed medications during 2007 (6647 in total, 4704=1, max=49).
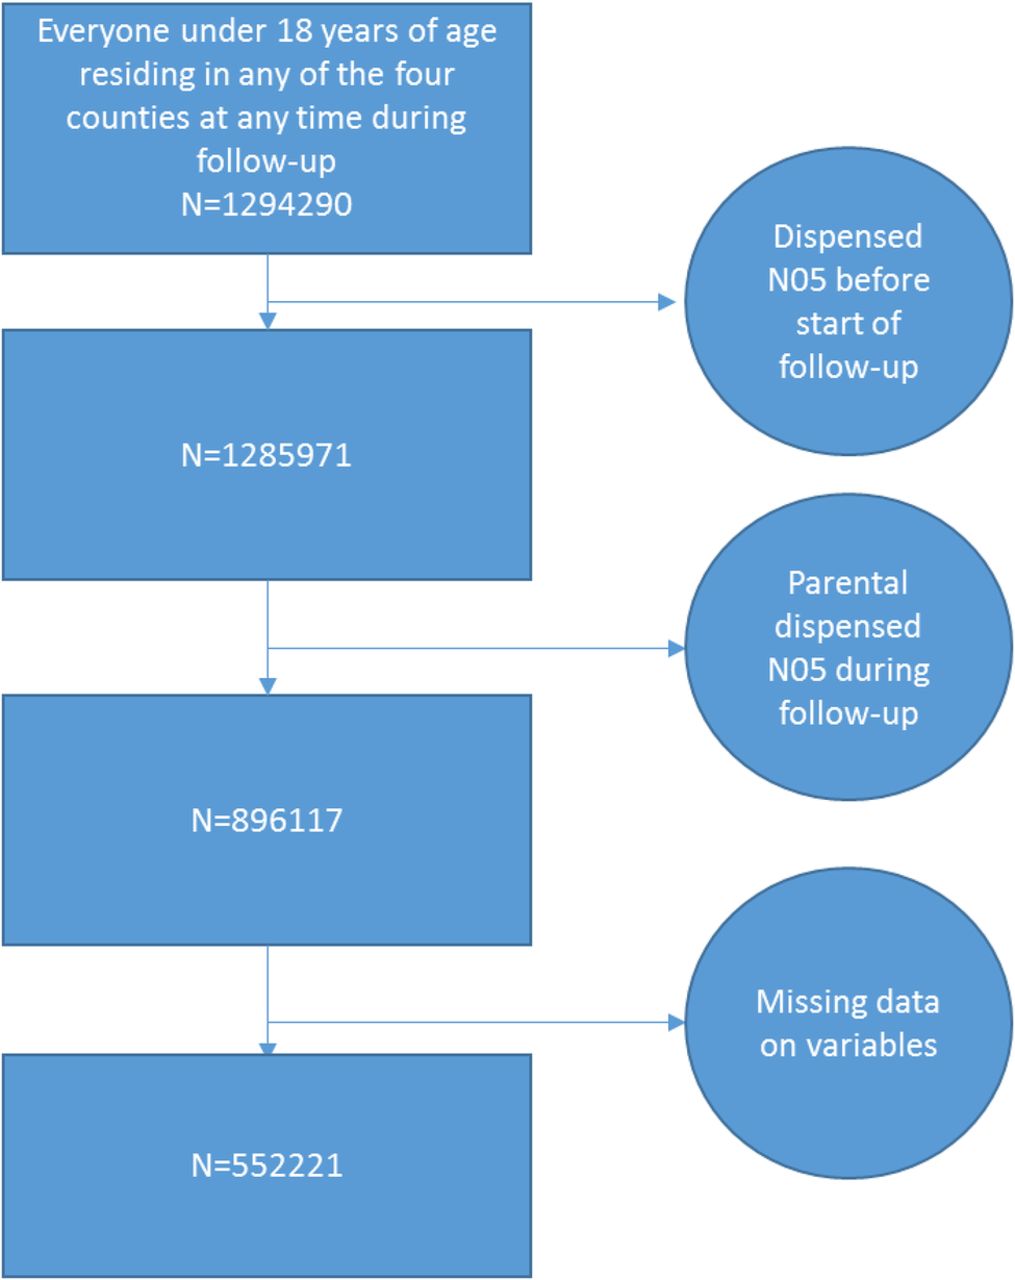
Flow chart.
Air pollution exposure assessment
The Swedish environmental research institute has developed an empirical Land Use Regression model to estimate the urban content of the contribution of nitrogen dioxide and particulate matter. The model is based on the ratio of the urban content contribution, the meteorological parameters and the population distribution. It includes the geographical distribution of the urban contribution, which means that it takes into account that the levels are not evenly distributed across a city but related to population density. This model was used together with a model for the regional background levels to calculate the exposure of NO2 and particulates for the entire Swedish population.40 We used three measures of exposure to air pollution as a marker of long-term exposure to air pollution, annual means of NO2, PM10 and PM2.5 for the year when the individual was included in the study (any year between 2005 and 2010). The base year of the land use regression model was 2010, and the estimation of the PM2.5 concentrations was done by using a ratio relation between monitored PM2.5/PM10 on a yearly and geographical basis. The underlying assumptions were thus that the concentration at study inclusion was a valid marker for long-term exposure, and that the spatial contrasts in exposure during follow-up were fairly constant. In the whole country, 17 sites with measuring data were used. The urban background level of PM10 was estimated with modelled NO2 and measured latitude-specific and season-specific ratios of PM10/NO2 in the model. For PM10, the cross-validated explained variance ranged between 80% and 95% during the year. The model has previously been showed to have fairly good accordance with a dispersion model.41 The spatial resolution was 1 km2.
Statistical analysis
The data were analysed with Cox regression assuming proportional hazards, with time as an underlying variable, resulting in HRs and their 95% CIs. We studied the exposure as continuous variables, as ratios associated with pollutant increases of 10 µg/m3. Tests for proportionality were carried out by visual inspections and by formal testing confirming the assumption of proportional hazards. In the main model, we adjusted for age at the start of follow-up (continuous variable), sex, maternal and paternal education level (four categories), maternal body mass index in early pregnancy (continuous variable) and maternal smoking during early pregnancy (three categories) and for group-level education level (continuous variable). The variables were chosen on the basis of data available in the Swedish National registers. Maternal body mass index and smoking were included in the model more as indicators of socioeconomic status than as potential causes of an association. We defined a group-level variable on socioeconomic status based on data from Statistics Sweden, on Small Areas for Market Statistics (SAMS). There are 9000 SAMS areas in Sweden (6106 in our study area), and the idea is for SAMS to represent homogeneous neighbourhoods. The variable was defined as the proportion of the population in the SAMS area with three or more years of undergraduate studies in the age category 25–65 years.
In an additional analysis, we also adjusted the models for maternal and paternal income. Further, we stratified our analyses on county and sex.
Sensitivity analyses
We also ran models where NO2 and PM10 were included simultaneously in the models, and a model where backward selection technique was used to identify the variables that should remain in the model. The variable inclusion criteria were: a p value <0.05 or a 20% change in the HR associated with air pollution.
In addition, we ran models where we excluded SAMS areas with <1000 inhabitants/km2, and a threshold analysis where we only included NO2 concentrations below 15 µg/m3. In another sensitivity analysis, we adjusted for population density. Furthermore, we investigated effect modification with respect to age and socioeconomy (at the individual and group levels) by including cross-products of those variables with the exposure variables in the models. In another sensitivity analysis, follow-up started a year later, 1 January 2008, and individuals with a medication in the registry before that were excluded from the analysis. We also ran age-specific analyses for the age groups 0–4, 5–9, 10–14 and 15–18. Finally, we investigated if patterns of missingness among our variables were approximately the same for cases and non-cases and if they were dependent on the outcome or level of exposure. We imputed missing observations using a Markov Chain Monte Carlo approach and reran the main analyses to investigate whether our estimates changed.
SAS V.9.2 software was used to create data sets and run the analyses.
Results
The HRs regarding PM10 and PM2.5 were very similar. We therefore present only the results for PM10 and NO2. There were in total 18 675 individuals who at least once had dispensed N05 during follow-up, with a total number of person-years followed up of 3 101 756 (table 1). The average length of follow-up was 3.5 years. The number of events per 1000 cohort members was 23 in Västra Götaland, 23 in Västerbotten, 20 in Stockholm and 20 in Skåne (table 1). The agreement between an event in 1 year and an event in subsequent years was not very high; for example, the κ statistic calculated for an event in 2007 and 2008 was 0.21, in 2007 and 2009 was 0.14, and in 2007 and 2010 was 0.11. The highest concentrations of NO2 were found in Stockholm (yearly median: 8.3 µg/m3) and the highest levels of PM10 were found in Skåne (yearly mean median: 15.8 µg/m3; table 1). The correlation between NO2 and PM10 was, due to the modelling of PM10, high, and ranged between 0.83 (Västerbotten), 0.97 (Skåne) and 0.98 (Stockholm and Västra Götaland). No formal statistical testing was done of the differences between cohort members with and without an event during follow-up, but the mean concentration of NO2 or PM10 did not seem to differ much between individuals with and without an event of dispensed N05 during follow-up (table 2). The age at inclusion among those who had a dispensed medication was higher than among those without an event of dispensed N05 during follow-up. Maternal body mass index was similar between the two groups, as was the group-level variable on socioeconomy (proportion with high education in the SAMS area). There were some differences with respect to maternal and paternal education levels and maternal smoking during pregnancy between individuals who dispensed medication and individuals who did not (table 2). The size and direction of the correlation coefficients between air pollution concentrations and group-level education were heterogeneous across municipalities in the study area (results not shown). Adjusting for parental income only marginally changed the results (results not shown).
Description of the four counties in the study area
Descriptive statistics of explanatory variables stratified on the outcome
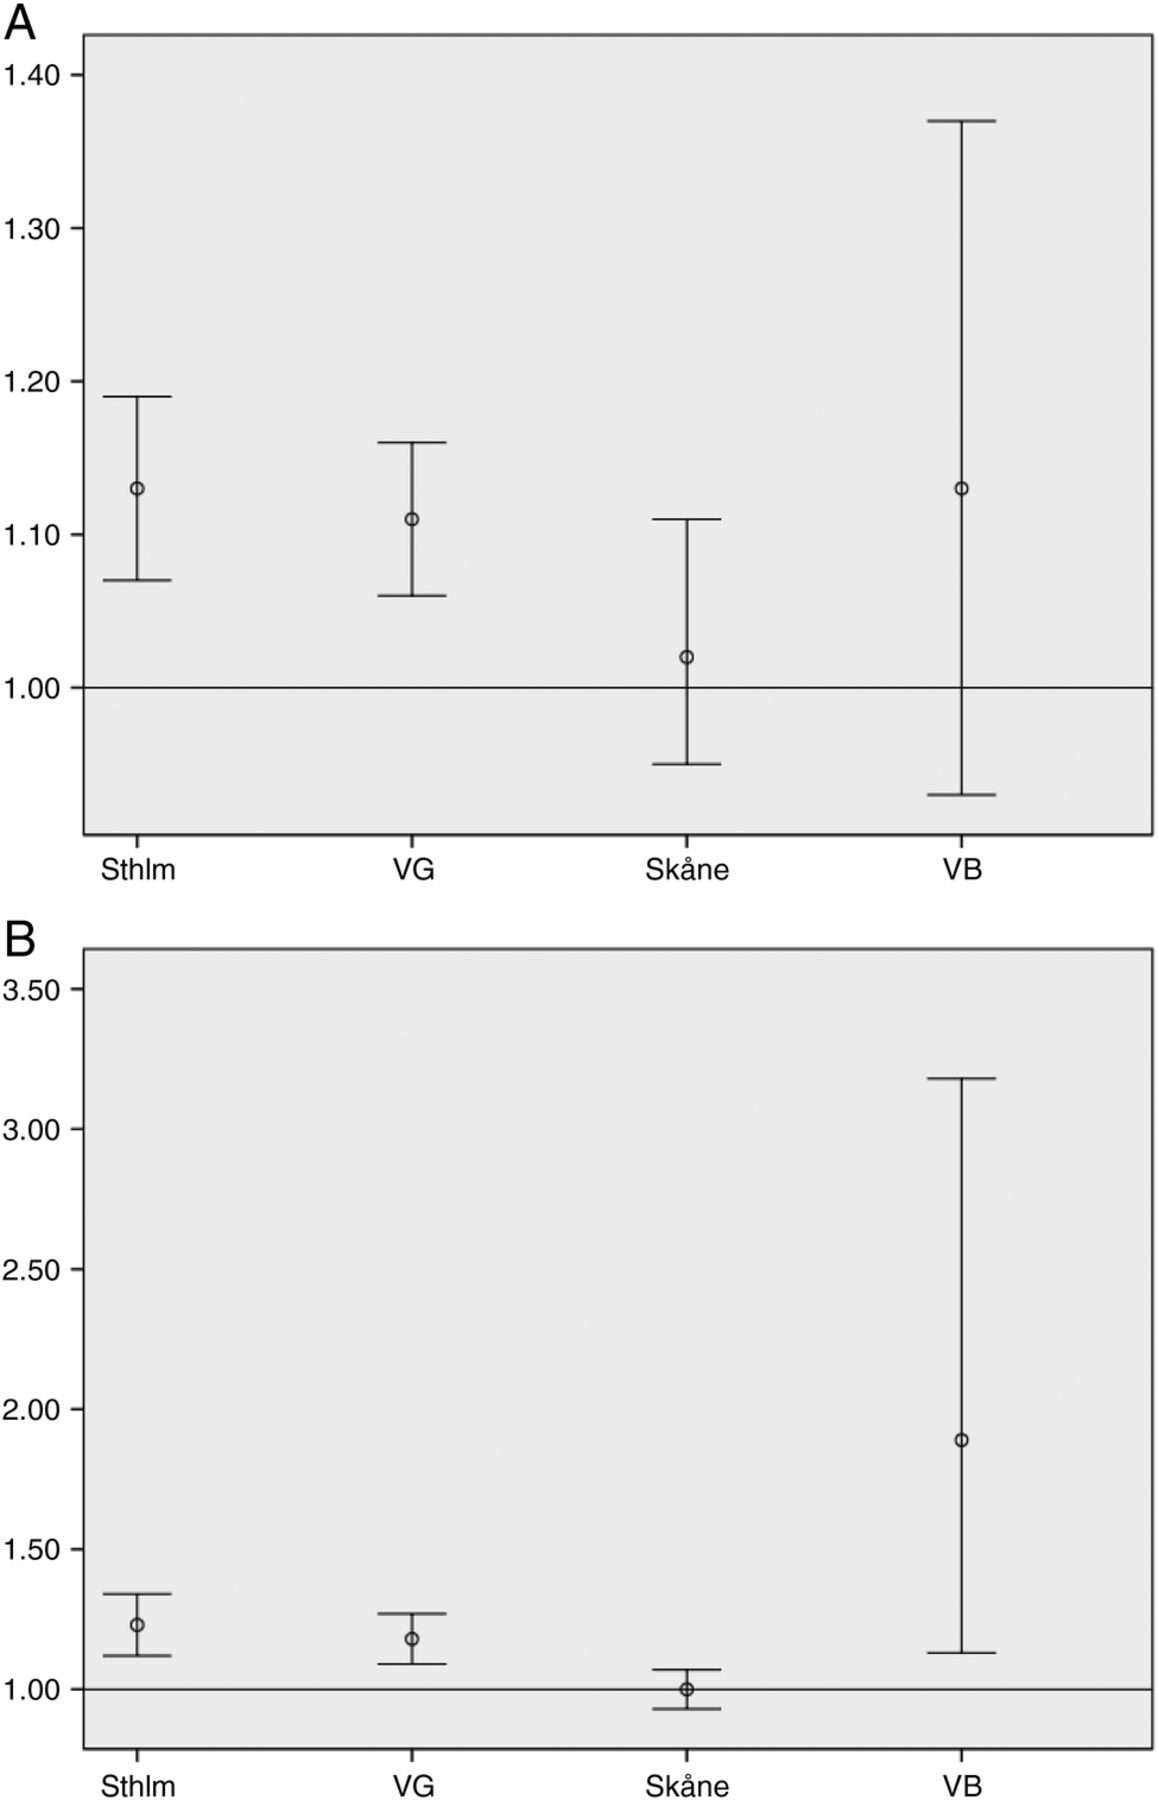
The HR in association with a 10 µg/m3 increase in NO2 adjusted for age at the start of follow-up, sex, maternal and paternal education, maternal body mass index in early pregnancy, maternal smoking during early pregnancy and group-level education levels was 1.09 (95% CI 1.06 to 1.12; table 3). The corresponding HR associated with a 10 µg/m3 increase in PM10 was 1.04 (95% CI 1.00 to 1.08). The correlation between NO2 and PM10 was too high for them to be included simultaneously in the model, because NO2 was one of the predictors of urban background PM10 in the PM10 model. When using the backward selection technique to identify what variables should be included in the model, all variables remained in the model due to their low p values, except the group-level SES variable that had a p value >0.20. The estimates with and without that variable included were very similar (results not shown). The crude HRs were close to one (no association), and the association appeared when adjusting for age. The other variables did not seem to have any substantial influence on the estimates (results not shown). The associations seemed heterogeneous across the four counties (table 3 and figure 4A,B), at least for the association with PM10 (p=0.001). For NO2, the p value for effect modification was 0.24. For example, the association with a 10 µg/m3 increase in NO2 was quite similar in Stockholm, Västra Götaland and Västerbotten (HRs of 1.13, 1.11 and 1.13, respectively), whereas there was no evident association (HR=1.03) in Skåne (table 3 and figure 4A,B). The HRs associated with a 10 µg/m3 increase in PM10 were quite similar in Stockholm and Västra Götaland (1.23 and 1.18, respectively), 1.00 in Skåne and 1.89 in Västerbotten. The high estimate in Västerbotten is uncertain, a contributing factor that may be low statistical power to detect differences. The estimates seemed similar among boys and girls (table 3), and the p value for effect modification was 0.30 for NO2 and 0.82 for PM10.
HRs and their 95% CIs for an event (dispensed N05 medications during follow-up) in association with a 10 µg/m3 increase in NO2 and PM10, adjusted for individual-level and group-level characteristics
HRs and their 95% CIs for a dispensed N05 medication during follow-up in association with a 10 µg/m3 increase in NO2 (A) and PM10 (B) in Stockholm County (Sthlm), Västra Götaland County (VG), Skåne County (Skåne) and Västerbotten County (VB).
Sensitivity analyses
When excluding the more rural areas (population density <1000 inhabitants/km2), the size of the Stockholm cohort was barely affected, whereas the size of the Västra Götaland and Skåne cohorts was less than half the original size. The HRs of those three cohorts remained stable (table 3). Regarding Västerbotten, only a third of the original cohort remained, and the size of the HRs completely changed and the loss in precision was substantial (table 3). In the threshold analysis, where we excluded neighbourhoods with concentrations above 15 µg/m3, the size of the cohorts did not change much due to the low levels of air pollution in general, and consequently neither did the HRs. However, the HR in association with the 10 µg/m3 increase in NO2 in Skåne was 1.16 (95% CI 1.02 to 1.33), which is different from the overall HR of 1.02. When adjusting for population density, the models did not perform very well (results not shown). There was no effect modification by age or socioeconomic status (results not shown). Starting follow-up a year later only marginally altered the effect estimates (results not shown). The age-specific HRs revealed no evident age trends (results not shown). Including the highly correlated NO2 and PM10 in a two-pollutant model changed the overall estimate upwards for NO2 to 1.18 (95% CI 1.12 to 1.24) and downwards for PM10 to 0.90 (95% CI 0.84 to 0.95).
The patterns of missingness among variables were approximately the same for cases and non-cases and were not dependent on the outcome or exposure level. Imputing missing data yielded similar results as the main model (results not shown).
Discussion
Principal findings
In this longitudinal study of Swedish children and adolescents, neighbourhood air pollution concentration was associated with dispensed medications for certain psychiatric disorders, after adjusting for individual-level and group-level characteristics. The association was present in three out of four counties within Sweden. To put our findings in perspective, the association seemed to be present even at annual levels of NO2 lower than 15 µg/m3, which can be compared with the WHO guideline and EU air quality standard of 40 µg/m3. However, a finer spatial resolution would have resulted in a wider concentration range especially for NO2. This is one of a small number of studies to consider the association between air pollution and mental health, and the first to do so in children. There are several studies suggesting associations between air pollution and autism spectrum disorders26–32 and cognitive function in children,23–25 ,33 and this study adds to evidence from them that air pollution may have detrimental effects on the brains of children and adolescents. Furthermore, this is the first study to use a whole population, and to use nationwide register-based data on dispensed medications as an indicator for mental health. Most of the existing evidence for a link between air pollution and mental health comes from short-term studies in adults, where daily fluctuations in air pollution concentrations are compared with the daily number of mental health events or symptoms.8–16 Furthermore, associations between longer term exposure to air pollution and anxiety and stress were recently reported in two ageing cohorts.6 ,7
Limitations and strengths of the study
There are some weaknesses and strengths of the study that should be mentioned. First, any dispensed medication in the group N05 is a very crude measure of mental health. N05 consists of neuroleptics (antipsychotic medications), ataractics and sleeping pills (a broad group of sedative medications including hydroxyzine and melatonin-based medications). Furthermore, the N05 group of medications includes antipsychotic medications, which most often are used for children with acute psychosis, children who are aggressive and acting out, children with severe neuropsychiatric disorders, children with strong anxiety or children where a bipolar condition is suspected. The majority of medications dispensed in the N05 group, however, concern children with different states of anxiety and children to whom sleeping pills are prescribed. The range of mental health problems in individuals with an event during follow-up may thus vary from mild to very severe. Also, the accordance (kappa-values) between a dispensed medication consecutive years was generally low. A dispensed medication for an individual a certain year thus did not necessarily indicated a high probability to dispense a medication the following year. This may indicate that the outcome measure as a marker of general mental health could be questioned. Access to more detailed data on type of dispensed medications would have been desirable, but we did not have access to such data. Given the results of this study, we hope to be able to get access to detailed Swedish register data on dispensed medications in the future. Moreover, we decided to dichotomise the outcome, although we could have used the number of dispensed medications per year as a continuous outcome to get a better estimate of a potential dose–response association. We decided against that since the distribution of the number of dispensed medications was much skewed, with some outliers that seemed unrealistic. Despite the crude measure of mental health in this study, we consider the outcome to be an indicator for mental health in children and adolescents in general. A major strength of the data is that they cover the entire population; thus, the whole population of the study area can be seen as a cohort. We have access to register-based data, where dispensed medications of all Swedes are registered. Selection bias and recall bias therefore do not have to be considered in our setting. Another strength of this study is the longitudinal approach, which increases the validity of the results compared to cross-sectional studies. All individuals with an event 1.5 years before start of follow-up (1 January 2007) were excluded. It would have been desirable to base the exclusion criteria on the lifetime history of dispensed medications, but the register for dispensed medications did not start until 1 July 2005; thus, no data on earlier dispensed medications were available. Individuals with a dispensed medication the year and a half before start of follow-up were excluded from the analysis, but the agreement between a dispensed medication subsequent years was rather low. Therefore, an unknown proportion of the events are not incident events. The study is therefore prone to some of the limitations of a cross-sectional study; for example, reverse causation may be an explanation of our findings. However, delaying follow-up to 1 January 2008 and the sensitivity analyses restricting the sample to only urban areas do not suggest reverse causation to be a major explanation of our findings.
As expected, individuals who had been dispensed N05 during follow-up were much more likely to have parents who had been dispensed the same medication since the start date of the register (eg, 36% of the mothers compared to 22% of the mothers for individuals who had not been dispensed N05 during follow-up). We excluded children whose parents had been dispensed a medication for N05 for several reasons: (1) parental mental health problems might influence where the family resides, and therefore also the pollution levels, (2) parental inclination to dispense medication is correlated with children's dispensed medication and (3) parental mental health problems may directly influence children's mental health and an eventual association with air pollution may therefore be explained by the parental mental health status. Adjusting for parental medication for N05 is therefore not straightforward, and we decided to exclude these individuals to get ‘cleaner’ data, although this might have resulted in an underestimation of the true effect, as well as in a decreased generalisability. Despite that, we consider the exclusion of parents with a dispensed N05 medication to be one of the major strengths of the study.
Exposure measurement error should be considered in our study. We used neighbourhood exposure models with the resolution 1 km2. Exposure contrasts within cities are therefore smoothed out in our data, which may have led to an underestimation of risk. However, the model has been validated, and we were able to use the same model in all four counties within Sweden, which is a major advantage. We used annual mean pollutant concentrations at the home address for the year of study inclusion as a marker for long-term exposure to air pollution. The modelled concentrations were based on the year 2010. The underlying assumption of this study is thus that spatial contrasts in pollutant concentrations were rather similar across follow-up. Another potential source of exposure measurement error is that modelled exposure is not necessarily a good marker for actual exposure.42 It is likely that the exposure measurement error would have led to a bias towards the null, but we have not attempted to quantify that bias. In future studies, we will have access to more detailed data on exposure to air pollution, in terms of geographical and temporal resolution and in terms of source-specific exposures.
Another strength of the study is that we have enough statistical power to analyse data in the four counties separately. The sometimes heterogeneous results between the areas raise important questions. For example, the risk estimates seemed generally close to one (no association) in Skåne, but were generally quite homogeneous in the other three counties. Excluding areas where air pollution levels >15 µg/m3 (which basically means excluding the main city centres) resulted in a statistically significant HR associated with NO2 in Skåne of 1.16. A possible reason for the results in Skåne is that the exposure model was not as valid in Skåne as in the other counties. For example, it is known that ozone is difficult to model in Skåne,43 possibly due to local production of ozone in the summertime, which could skew the results. The discrepancy between Skåne and the other three counties could also be due to differences in terms of demography, immigration, heterogeneity in dispensed N05 between different socioeconomic groups or in associations between socioeconomy and residential air pollution levels, not fully accounted for in the statistical models. We have previously observed that patterns between socioeconomy and air pollution in Skåne seem to be complex,44 but crude analyses suggest that such patterns can also be complex in other parts of the study area.
The crude HRs were close to one, but they are not meaningful unless adjusted for age. Age, in fact, seemed to be the only variable with a substantial influence on the HRs, but potential residual confounding due to socioeconomy should nevertheless be mentioned as an alternative explanation of our findings, although an additional analysis adjusting for parental income did not change the estimates. It is important to fully adjust for socioeconomy when investigating mental health outcomes in children and adolescents.37 It should be noted that while all primary and in-patient care for children and adolescents is completely free of charge for the individual (funded by tax), medications are not free up to a certain annual amount (of around €200). Dispensation of medication is therefore more sensitive to socioeconomic status than, for example, outcomes based on hospital visits or diagnoses. Since air pollution concentrations are also associated with socioeconomic status, the importance of adjusting fully for socioeconomic status in our setting cannot be stressed enough. We used parental educational level and SAMS area educational level as main indicators for socioeconomy, and we also adjusted for body mass index and smoking during early pregnancy since those variables also capture socioeconomic status to a large extent. It would have been desirable to have other data on socioeconomy and lifestyle factors, but the data on socioeconomy are limited to what can be found in the Swedish nationwide registers. However, the HRs did not seem especially sensitive to inclusion or exclusion of the socioeconomic indicators we had access to. We therefore think that the probability for residual confounding from socioeconomy to explain our findings is rather small. Residual confounding could also be present with respect to environmental factors not accounted for in our study, for example, traffic-related noise (which hypothetically could be associated with the outcome). Unfortunately, we had no access to models on traffic-related noise, and thus could not rule out noise as an alternative explanation of our findings.
Comparison to other studies and discussion of potential mechanisms
To the best of our knowledge, this is the first study to consider the association between long-term exposure to air pollution and mental health in children. However, our findings are consistent with two prior studies of exposure to air pollution in association with anxiety,6 and perceived stress,7 in older citizens and with studies on short-term exposure to air pollution and mental health outcomes in the general population.8–16 Furthermore, there is an increasing body of evidence suggesting air pollution to be associated with cognitive development in children,23–25 ,33 and with autism spectrum disorder.26–29 ,31 ,32
The marker for mental health in this study was dispensed N05 medications, a broad group of medications where the majority of dispensed medications are sedative medications and sleeping pills, but where also medications for children and adolescents with severe mental health problems such as schizophrenia and acute psychosis are included. It is possible that the association we observed is driven by small segments in this broad group. It is therefore somewhat difficult to speculate on possible mechanisms. Furthermore, we observed associations between dispensed N05 medications and also NO2 and PM10, but it was not possible to adjust the respective pollutant estimate for the other pollutant because NO2 was one of the predictors of urban background PM10 in the PM10 model. We therefore consider our results an indication for air pollution in general to be associated with dispensed N05 medications, and refrain from speculating on which specific component within the pollution mix might be driving the observed associations. Air pollution can cause inflammation and oxidative stress.45–47 It has been speculated that exposure to air pollution could induce or exacerbate anxiety (which is one of the most important patient groups who dispense N05) by increasing oxidative stress and inflammation.48 There are animal studies suggesting that oxidative stress is associated with a range of psychiatric disorders such as schizophrenia, bipolar disorder or anxiety-like behaviour,49–51 and that systemic inflammation may be associated with depressive-like/anxiety-like behaviour and memory impairment.51 ,52 Furthermore, an experimental study in mice suggests that fine particulate air pollution could cause depressive-like responses and impairments in spatial learning and memory. Mice that were exposed to fine particulate matter (PM) had an elevated hippocampal pro-inflammatory cytokine expression, whereas apical dendritic spine density and dendritic branching were decreased in the hippocampal CA1 and CA3 regions.53 Oberdörster and Utell2 first suggested that the brain might be vulnerable to ultrafine ambient particulate matter. Biological components of particles such as endotoxins, mould and pollen have been linked to neurodevelopmental disorders (eg, schizophrenia, autism and mental retardation) and neurodegenerative diseases.54 Another theory is that air pollution acts by inducing or aggravating major medical conditions, but the study design does not fully allow for a distinction between exacerbation or incident cases. We used modelled annual mean concentrations as a marker for long-term exposure to air pollution, but it is possible that only certain exposure windows are of interest. For example, fetal life may be extra sensitive.55 ,56
Conclusions and implications
In Sweden, the societal cost for mental disorders has been estimated to be 2% of Gross Domestic Product (GDP). The onset is often in adolescence or young adulthood. Remission is not always possible and for many, symptoms persist despite use of treatments. If confirmed, our findings implicate that there may be a link between exposure to air pollution and dispensed medications for certain psychiatric disorders in children and adolescents.
Acknowledgments
The Umeå SIMSAM Laboratory data infrastructure used in this study was developed with support from the Swedish Research Council (2008-7491) and with strategic support from Umeå University.
References
Footnotes
Contributors All authors contributed to the conception or design of the work, or the acquisition, analysis, or interpretation of data for the work, and drafted the work or revised it critically for important intellectual content and gave their final approval of the version to be published and agreed to be accountable for all aspects of the work in ensuring that questions related to the accuracy or integrity of any part of the work are appropriately investigated and resolved. AO, BF and LB conceived and designed the study. AO acquired and analysed the data and drafted the manuscript. MS helped acquire data and created figure 1. DOÅ helped interpret the data for the work and with the statistical analysis of the data.
Funding The work was funded by Vårdalstiftelsen with the Dnr VÅ 2011-25/430 (AO).
Competing interests None declared.
Ethics approval The study was approved by the regional ethics board in Umeå (Dnr 2010-157-31 ö).
Provenance and peer review Not commissioned; externally peer reviewed.
Data sharing statement No additional data are available.