Article Text

Abstract
Objectives To identify smaller geographic and region-specific evidence to inform population health planning for overweight and obesity.
Design Cross-sectional secondary analysis of data.
Setting Primary healthcare—17 general practices located in the Illawarra-Shoalhaven region of New South Wales (NSW).
Participants A subset (n=36 674) of the Sentinel Practices Data Sourcing project adult persons data set (n=118 794) that included information on disease status of all adult patients who had height and weight measurements recorded in their electronic health records and had visited the included general practices within the Illawarra-Shoalhaven region of NSW between September 2011 and September 2013.
Main outcome measures Age-adjusted odds ratio (aOR) of overweight and obesity was determined for high and low levels of socioeconomic disadvantage based on Socio-Economic Indexes for Areas (SEIFA)—Index of Relative Socio-Economic Disadvantage (IRSD) scores of patients' residential statistical local area.
Results In men, overweight was lowest in areas of highest socioeconomic disadvantage (aOR=0.910; 95% CI 0.830 to 0.998; p<0.001); but no statistically significant association with socioeconomic score was found for women. Overall obesity was associated with high socioeconomic disadvantage (aOR=1.292; 95% CI 1.210 to 1.379; p<0.001).
Conclusions This type of data analysis reveals multiple layers of evidence that should be assessed for population health approaches to curb the epidemic of obesity and overweight. It strongly highlights the need for preventive health initiatives to be specific to gender and socioeconomic attributes of the target population.
- PRIMARY CARE
- PUBLIC HEALTH
- EPIDEMIOLOGY
This is an Open Access article distributed in accordance with the Creative Commons Attribution Non Commercial (CC BY-NC 4.0) license, which permits others to distribute, remix, adapt, build upon this work non-commercially, and license their derivative works on different terms, provided the original work is properly cited and the use is non-commercial. See: http://creativecommons.org/licenses/by-nc/4.0/
Statistics from Altmetric.com
Strengths and limitations of this study
Reveals new insights for population health planning of obesity in Australia.
Provides an evidence base for region-specific tailoring of obesity initiatives, and argues for preventive health measures to be gender-specific and specific to socioeconomic disadvantage within populations.
Findings have limited generalisability to all of Australia.
Introduction
Australia's rate of obesity as per 2011 estimates (28.3% of the population aged 15 years and over1) was the fourth highest among 40 countries reported by the Organisation for Economic Cooperation and Development (OECD),1 behind only the USA (36.5%), Mexico (32.4%) and New Zealand (28.4%). While across OECD countries, 18% of the adult population were reported to be obese, there was significant variation across the nations with Japan and Korea reported to have rates as low as 4.1% and 4.3%, respectively.
Despite a major investment in federal and state-funded health promotion campaigns to prevent obesity in Australia,2–4 the proportion of overweight or obese adults in the population (based on measured height and weight) has continued to rise in recent decades, and exceeds the average figure of 52.6% for adults in OECD countries.1 The prevalence of overweight and obesity increased from 56.3% in 1995 to 61.2% in 2007–2008 and 62.8% in 2011–2012.5 This is largely driven by an increase in the level of obesity from 18.7% to 27.5% over the period, with the proportion of overweight adults remaining similar (35.3–37.6%).5
The most recent nationally representative data from the 2011–2013 Australian Health Survey reports that the level of overweight and obesity in adults varies according to relative geographical remoteness of areas in Australia such as major cities, regional and further more remote locations.5 Around three-quarters of men living in regional (74.6%) and remote (73.9%) areas are overweight or obese, compared with just over two-thirds (67.7%) of men living in major cities. For women, around two-thirds of women living in regional (62.4%) and remote (64.9%) areas are overweight or obese, compared with just over half (52.5%) who live in major cities. Geographical location provides a broad proxy for environmental influences on health, including socioeconomic status (SES), but pockets of socioeconomic disadvantage may be present within the same geographic jurisdiction. These may not be evident without using smaller location-level categorisation.
Considering SES as an indicator of advantage, rather than regional, remote or metropolitan residence, gender differences exist in Australians regarding the association between SES and prevalence of overweight or obesity. Using the metric of quintiles of the scores of the ‘Index of relative socioeconomic disadvantage’ developed by the Australian Bureau of Statistics, where lower scores (eg, the first quintile) indicate areas with relatively greater disadvantage and higher scores (eg, the fifth quintile) indicate areas with a relative lack of disadvantage in general;6 it has been reported that as per 2011–2013 estimates, almost two-thirds (63.8%) of Australian women in the lowest socioeconomic group are overweight or obese, compared with almost half (47.7%) of those in the highest socioeconomic group. Interestingly, this pattern was not observed for men, with similar overweight, or obesity rates for men living in areas of most disadvantage (69.0%), and those living in areas of least disadvantage (68.6%).5
While national data, such as the Australian Health Survey 2011–2013, is useful in detecting trends, it is important to use other data sources to determine smaller geographic region-specific population health metrics for overweight and obesity.7 ,8 A recently released discussion paper by the Australian Government Department of Health argues that the appropriate use of accessible patient health records is imperative for obtaining outcome information, in order to understand primary care performance, identify potential areas for improvement and create plans to achieve the national targets of delivering quality healthcare to people with complex and chronic health conditions.9
This paper demonstrates how health administrative data collected during general practitioner (GP)–patient interactions in primary care can offer an evidence-based approach to region-specific population health planning, with regard to addressing the increasing burden of overweight and obesity in a targeted manner.
Methods
A secondary analysis of a subset of a large Illawarra-Shoalhaven specific cross-sectional primary care data set was conducted. The Sentinel Practices Data Sourcing (SPDS) project database was created in September 2013 through extraction of deidentified clinical patient information from 17 general practices in the Illawarra-Shoalhaven catchment that volunteered and consented to participate in the study.7 The database included all information obtained from general practice-based patient interactions in the preceding 24 months from the time of data, that is, all interactions between September 2011 and September 2013. The data represented 39.7% of the regional population but due to variable proportional representation of each of the statistical local areas (SLAs)8 of the Illawarra-Shoalhaven, the sample may not be truly representative of the resident population.7
In this analysis, the adult subset of the SPDS data set was further refined to exclude patients without a recorded age and gender, and to include only those patients who had their height and weight recorded in their electronic health records. This yielded a sample of n=36 674 adult patients who had GP-coded data on chronic disease status, age, sex and other clinical measures.
The socioeconomic index for areas (SEIFA)—index for relative socioeconomic disadvantage (IRSD)6 score for the SLA in which each patient resided was used as an indicator of SES. The IRSD6 is one of four indices that has been created by the Australian Bureau of Statistics (ABS) from social and economic information obtained in the 2011 Census of Population and Housing. The IRSD is a general socioeconomic index that summarises a range of information about the economic and social conditions of people and households within an area. At an Australian national benchmark of 1000, a score of lower than 1000 indicates relatively greater disadvantage in general.
For our analysis, as the sample was exclusively obtained from only the Illawarra-Shoalhaven catchment of the state of New South Wales; the entire Illawarra-Shoalhaven region's SLA-based population weighted SEIFA-IRSD score of 975.37 was used as the reference cut-off. SLAs with scores lower than 975.3 were categorised as representing a ‘high’ level of socioeconomic disadvantage. SLAs with scores of >1000 were categorised as ‘nil/no’ socioeconomic disadvantage, while scores between 975.3 and 1000 were categorised as ‘low’ socioeconomic disadvantage.
Comparisons of mean differences in body mass index (BMI) across categories of study variables were performed using two-sample t test for sex and one-way analysis of variance test followed by post hoc Tukey's Honest Significance Difference (HSD) test for socioeconomic disadvantage and age. Logistic regression was used to examine the associations between socioeconomic disadvantage and odds of obesity and overweight. Effect estimates were calculated as sex-specific, age adjusted odds ratios (aORs), with associated 95% CI, using SPSS (V.21.0. Armonk, New York, USA: IBM Corp). Descriptive statistics and prevalence of overweight and obesity were calculated using Microsoft Excel (V.2013: Microsoft Corporation, Redmond Washington, USA).
The study was performed under the SPDS project7 ethics approval from the Human Research Ethics Committee (Health and Medical) of the University of Wollongong (HE 12/447).
Results
BMI data was available for 36 674 patients with baseline demographic characteristics as shown in table 1.
Sample characteristics of 36 674 patients
Mean BMI for the sample was 28.4 (6.19) and was higher in men compared with women (p<0.001) (table 2). Mean BMI varied across age groups (p<0.001) and across socioeconomic disadvantage categories (p<0.001). Statistically significant differences (p<0.001) were found between the BMI of patients living in areas of ‘high’ compared with ‘low’ socioeconomic disadvantage, and between patients living in areas of ‘high’ compared with ‘nil’ socioeconomic disadvantage (table 2). Differences between ‘low’ and ‘nil’ socioeconomic disadvantage were not statistically significant.
Sample body mass index (BMI) statistics
There was an increase in the prevalence of overweight and obesity by age, but prevalence of obesity declined in the oldest age group (table 2). Overall, the prevalence of being overweight was higher in men (41.0%) compared with women (29.8%), but prevalence of obesity was similar in both genders (34.7% and 34.3%, respectively). While prevalence of obesity was higher in the ‘high’ socioeconomic disadvantage category (36.4%) compared with the category of ‘nil’ disadvantage (34.5%), overweight prevalence was higher in the ‘nil’ category (36.4%) compared with 34.5% in both ‘high’ and ‘low’ socioeconomic disadvantage categories.
The ORs of overweight and obesity indicate a lower odds of persons residing in areas of ‘high’ socioeconomic disadvantage to be overweight, compared to regions with ‘nil’ socioeconomic disadvantage (table 3). This association is in the opposite direction for obesity with a higher OR values for ‘high’ socioeconomic disadvantage.
OR (95% CI) for overweight and obesity
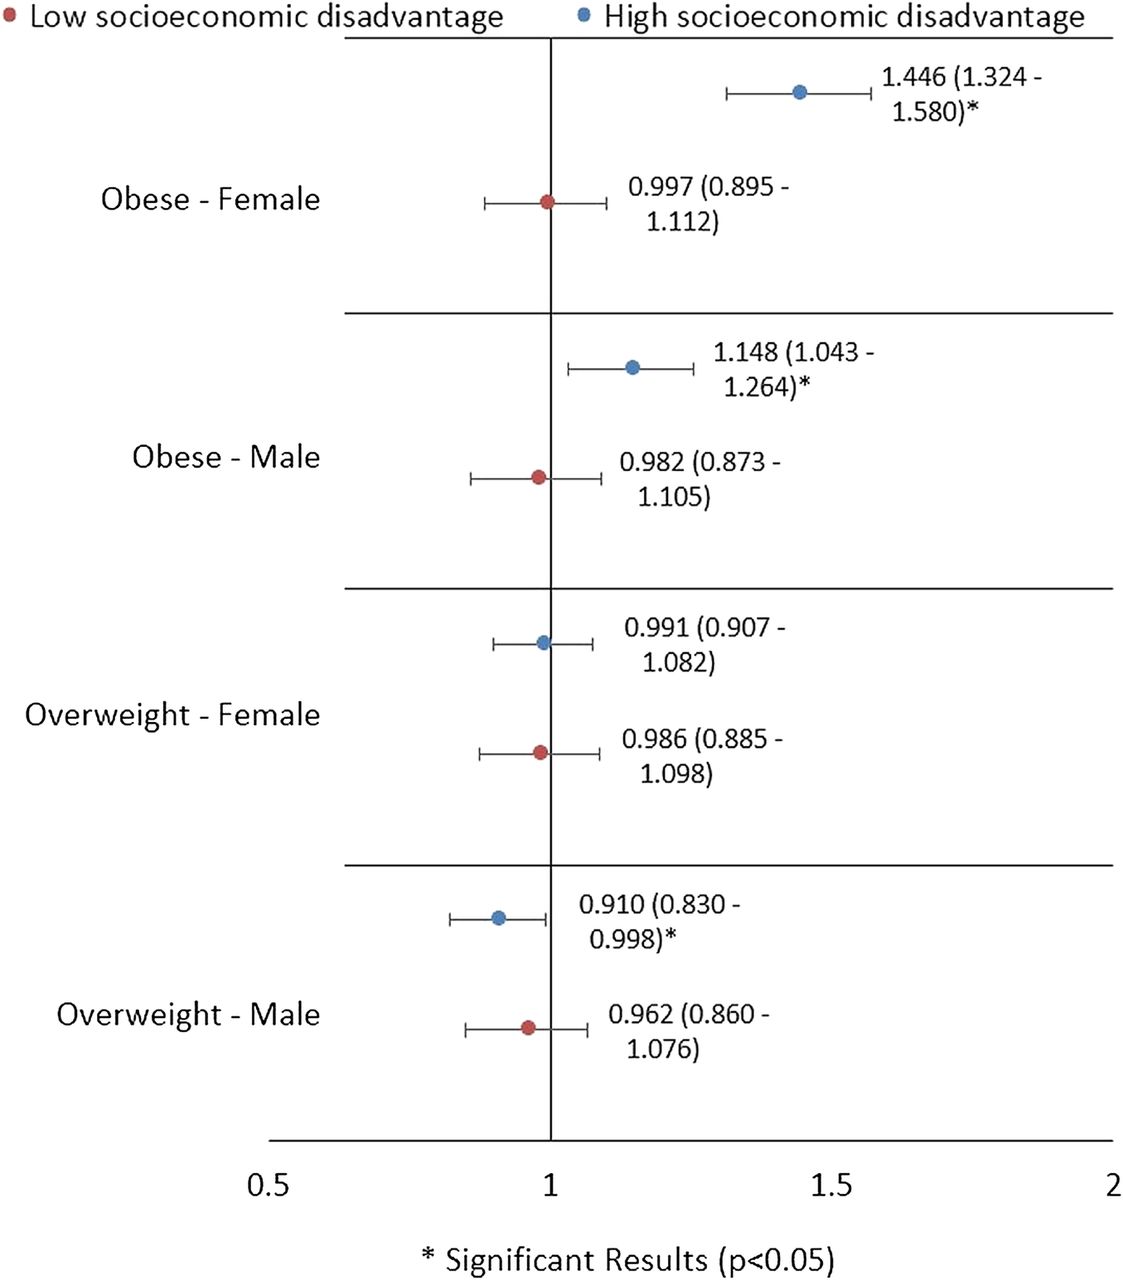
Figure 1 plots the age-adjusted gender-stratified ORs for overweight and obesity, based on exposure to relatively ‘high’ and ‘low’ levels of socioeconomic disadvantage, compared to the reference category of ‘nil’ socioeconomic disadvantage. In men, there was a lower odds of being overweight in those living in areas of ‘high’ socioeconomic disadvantage (aOR=0.910; 95% CI 0.830 to 0.998; p<0.001), but this association was not evident in women.

Forest plot of age-adjusted and gender-stratified ORs for overweight based on exposure to relatively high and low levels of socioeconomic disadvantage, by sex (n=36 674).
Discussion
Our results add to the growing body of evidence that demonstrates an inverse relationship between SES and obesity.10–15 It is well recognised that the direction of the association depends on the country's level of socioeconomic development and its position along the demographic transition. Generally, in high-income countries, there is an inverse relationship, at least for adult women, whereas in low-income countries, higher levels of obesity are seen in both men and women in those that are relatively more affluent in the population.13 ,16 In middle-income countries, or in countries with medium human development indices the association becomes largely mixed for men, and mainly negative for women.10 ,17 This particular shift appears to occur at an even lower level of per capita income than suggested by an earlier comprehensive review.12 By contrast, obesity in children appears to be predominantly a problem of the rich in both low-income and middle-income countries.
The current analysis demonstrates that significant variability exists in the BMI levels of Australian adults according to the socioeconomic categorisation of area of residence. For both men and women, there was a higher odds of obesity in areas of high socioeconomic disadvantage, while in men only there was a lower odds of overweight in those areas. This analysis makes a strong case for a targeted approach to population-level planning for primary healthcare services in health administrative catchments of regional Australia.
Our analysis has two important implications. First, preventive health initiatives for weight management need to be customised to be specific, both for gender and socioeconomic disadvantage. In areas of high SES disadvantage, primary care providers could have more streamlined approaches to direct obese patients to existing weight loss programmes, such as the free government-funded, population-based Get Healthy Information and Coaching Service that was launched in 2009.3 An evaluation of the initiative18 demonstrated that an accompanying mass-media campaign that advertised the service was particularly effective at reaching males, 18–49-year-olds, and those in the lowest two quintiles of advantage. However, those who accessed the service and registered for the longer term 6-month telephone coaching programme (rather than receive a one-off counselling session) were more likely to have been referred by GPs/health professionals, family or friends, or through their workplace. This information suggests that primary care providers are influential in encouraging uptake of weight reduction programmes.
Conversely, in areas of low SES disadvantage, efforts could be focused on preventing further weight gain in adults who are in the overweight range. A pilot study from the same region has reported that introduction of routine weighing of patients every time they attended their GPs over the period of a year resulted in a significant average weight loss of 2.5 kg in those patients who were obese, even in the absence of weight loss interventions.19 Thus, even during a brief encounter, primary care practitioners may potentially influence behaviour. This simple change in practice may be effective but requires further testing on a wider scale.
The second important implication of the study findings is the demonstration that primary care-level data can be efficiently linked to small-area socioeconomic information, and thereby provides an additional layer of evidence for use by population health planners. Weight and height data collected during patient–GP interactions over a period of 2 years was retrospectively extracted from desktop software packages of general practices participating in the SPDS project.7 In addition to available national and/or state-level data, we propose that such region-specific data could be used to better inform local primary care priorities and develop relevant general practice-based preventive health initiatives.
In order to address the epidemic-scale prevalence of overweight and obesity in Australia, a combination of individual-level interventions and population-level strategies are most likely needed to encourage lifestyle behaviour change. Our study findings suggest a need for interconnectedness between these approaches. It could be argued that GPs are not best placed to provide weight loss advice, or record and monitor weight management measures due to lack of skills in health-promotion techniques, inadequate training in nutrition education and being time poor.20 ,21 On the other hand, the large government investment in population-targeted obesity prevention programmes has not carefully considered how to engage primary care providers in referring their patients to such services, despite this stakeholder group being a highly regarded source of nutrition information.22 Undoubtedly, policy-level interventions are also required to change the food environment to encourage adoption of healthier eating patterns. Interventions that affect price of foods, including taxes and subsidies, have been shown to be most effective in groups with lower SES, and may therefore reduce inequalities in health between rich and poor.
Our study has some limitations which warrant caution with interpretation of the findings. The SPDS data set is a cross-sectional snapshot of primary care interactions collated from a single health administrative catchment in a regional area of New South Wales, Australia that represented 39.7% of the catchment's population in 2013–2014. Using this database, we have previously reported7 higher than national average estimates for the age-adjusted prevalence of a number of chronic diseases in this population, including hypertension (11.9% vs 10.4%) and anxiety disorders (5.0% vs 3.8%). The data set only includes individuals who had accessed GP services over a 2-year period, and hence, may have resulted in a higher estimate of the prevalence of chronic diseases, and overweight and obesity. Findings from this data set, therefore, have limited external validity to the catchment's general resident population. The study findings are, however, particularly relevant to local planning and prioritising of health needs and resources, and support roll out of the surveillance system to all general practices within a health administrative catchment area.
Conclusion
We propose that data on major health risk factors that are regularly collected during patient visits to their GPs, facilitated through the Medicare-funded primary healthcare system in Australia, provides an opportunity for identification of hot spots for overweight and obesity in health administrative catchments of regional Australia. This type of analysis allows for region-specific population health planning at the primary care level, and targeting of health messages.
In areas of lower socioeconomic disadvantage, those who are already overweight need to be monitored through regular checking of weight, and encouraged to prevent further weight gain, while in areas of high socioeconomic disadvantage, referral to existing federal and state-funded weight loss programmes is needed. More innovative methods of delivering health interventions need to be examined for men living in regions of low to nil socioeconomic disadvantages. The challenge will be to deliver services that are both acceptable and effective to people living in these geographical areas, and that focus on breaking down barriers to achieving healthier lifestyles. The socioeconomic disparity identified in the odds of overweight and obesity in regional Australia confirms that one size does not fit all, at least with regard to population-level social marketing campaigns and provision of primary care services to manage chronic diseases.
Acknowledgments
The authors would like to acknowledge the support provided by the clinical as well as administrative staff at all general practices that participated in the Sentinel Practices Data Sourcing (SPDS) project. Their inputs and enthusiasm in database cleansing and providing an accurate, deidentified data extract was invaluable. The author would like to acknowledge the financial and other support from the COORDINARE – South Eastern NSW PHN (formerly the Illawarra-Shoalhaven Medicare Local), which funded the Sentinel Practices Data Sourcing (SPDS) project under the Illawarra-Shoalhaven Medicare Local funding from the Australian Government Department of Health.
References
Footnotes
Contributors AG formulated the study design and was responsible for the conceptualisation of the study. AG also performed the data extraction and all statistical analysis, conducted data interpretation, carried out literature search and collated contributions from coauthors to draft the manuscript. KEC contributed to study design and conceptualisation, provided editorial input, conducted data interpretation and carried out literature search. MJB reviewed the statistical methodology and data analysis, and contributed to editing the final manuscript. All authors read and approved the final manuscript.
Funding This work was funded by COORDINARE – South Eastern NSW PHN (formerly the Illawarra-Shoalhaven Medicare Local).
Competing interests None declared.
Ethics approval The Sentinel Practices Data Sourcing (SPDS) project was approved by the Human Research Ethics Committee (Health and Medical) of the University of Wollongong (HE 12/447).
Provenance and peer review Not commissioned; externally peer reviewed.
Data sharing statement No additional data are available.