Article Text

Abstract
Objectives To investigate the contribution of ultra-processed foods to the intake of added sugars in the USA. Ultra-processed foods were defined as industrial formulations which, besides salt, sugar, oils and fats, include substances not used in culinary preparations, in particular additives used to imitate sensorial qualities of minimally processed foods and their culinary preparations.
Design Cross-sectional study.
Setting National Health and Nutrition Examination Survey 2009–2010.
Participants We evaluated 9317 participants aged 1+ years with at least one 24 h dietary recall.
Main outcome measures Average dietary content of added sugars and proportion of individuals consuming more than 10% of total energy from added sugars.
Data analysis Gaussian and Poisson regressions estimated the association between consumption of ultra-processed foods and intake of added sugars. All models incorporated survey sample weights and adjusted for age, sex, race/ethnicity, family income and educational attainment.
Results Ultra-processed foods comprised 57.9% of energy intake, and contributed 89.7% of the energy intake from added sugars. The content of added sugars in ultra-processed foods (21.1% of calories) was eightfold higher than in processed foods (2.4%) and fivefold higher than in unprocessed or minimally processed foods and processed culinary ingredients grouped together (3.7%). Both in unadjusted and adjusted models, each increase of 5 percentage points in proportional energy intake from ultra-processed foods increased the proportional energy intake from added sugars by 1 percentage point. Consumption of added sugars increased linearly across quintiles of ultra-processed food consumption: from 7.5% of total energy in the lowest quintile to 19.5% in the highest. A total of 82.1% of Americans in the highest quintile exceeded the recommended limit of 10% energy from added sugars, compared with 26.4% in the lowest.
Conclusions Decreasing the consumption of ultra-processed foods could be an effective way of reducing the excessive intake of added sugars in the USA.
- ultra-processed
- added sugars
- dietary intake
- NHANES
- US
This is an Open Access article distributed in accordance with the Creative Commons Attribution Non Commercial (CC BY-NC 4.0) license, which permits others to distribute, remix, adapt, build upon this work non-commercially, and license their derivative works on different terms, provided the original work is properly cited and the use is non-commercial. See: http://creativecommons.org/licenses/by-nc/4.0/
Statistics from Altmetric.com
Strengths and limitations of this study
Use of a large, nationally representative sample of the US population, increasing generalisability.
Use of data on added sugars rather than total sugars or sugar-sweetened beverages, which correspond to the guidelines relevant area of prioritisation.
Unlike most articles which have focused on specific food items such as soft drinks or fast food, our study evaluates the impact of a comprehensive group of products whose consumption is increasing exponentially in most countries.
Dietary data obtained by 24 h recalls are subject to potential error and bias.
Information indicative of food processing is not consistently determined for all food items in National Health and Nutrition Examination Survey, which could lead to modest overestimation or underestimation of the consumption of ultra-processed foods.
Introduction
Increasing policy attention has focused on added sugars, including by the WHO,1 the UK National Health System,2 the Canadian Heart and Stroke Foundation,3 the American Heart Association (AHA)4 and the US Dietary Guidelines Advisory Committee (USDGAC).5
These reports concluded that a high intake of added sugars increases the risk of weight gain,1 ,4 ,5 excess body weight5 and obesity;3 ,5 type 2 diabetes mellitus;3 ,5 higher serum triglycerides5 and high blood cholesterol;3 higher blood pressure5 and hypertension;5 stroke;3 ,5 coronary heart disease;3 ,5 cancer;3 and dental caries.1 ,3 ,5 Moreover, foods higher in added sugars are often a source of empty calories with minimum essential nutrients or dietary fibre,6–8 which displace more nutrient-dense foods9 and lead, in turn, to simultaneously overfed and undernourished individuals.
All reports recommended limiting intake of added sugars.1 ,3–5 In the USA, the USDGAC recommended limiting added sugars to no more than 10% of total calories. This is a challenge, as recent consumption of added sugars in the USA amounted to almost 15% of total calories in 2005–2010.10 ,11
To design and implement effective measures to reduce added sugars, their dietary sources must be clearly identified. Added sugars can be consumed either as ingredients of dishes or drinks prepared from scratch by consumers or a cook, or as ingredients of food products manufactured by the food industry. According to market disappearance data from 2014, more than three-quarters of the sugar and high fructose corn syrup available for human consumption in the USA were used by the food industry.12 This suggests that food products manufactured by the industry could have an important role in the excess added sugars consumption in the USA. However, to assess this role, it is essential to consider the contribution of manufactured food products to both total energy intake and the energy intake from added sugars, and, more relevantly, to quantify the relationship between their consumption and the total dietary content of added sugars. To address these questions, we performed an investigation utilising the 2009–2010 National Health and Nutrition Examination Survey (NHANES).
Subjects and methods
Data source, population and sampling
We utilised nationally representative data from the 2009–2010 NHANES, specifically the dietary component What we eat in America (WWEIA).13
NHANES is a continuous, nationally representative, cross-sectional survey of the non-institutionalised, civilian US residents.14 The NHANES sample was obtained by using a complex, stratified, multistage probability cluster sampling design based on the selection of counties, blocks, households and the number of people within households.14 In order to improve the estimate precision and reliability, NHANES 2009–2010 oversampled the following subgroups: Hispanic, Non-Hispanic black, Non-Hispanic white and Other persons at or below 130% of the federal poverty level and Non-Hispanic white and Other persons aged 80+ years.14
The survey included an interview conducted in the home and a subsequent health examination performed at a mobile examination centre (MEC). All NHANES examinees were eligible for two 24 h dietary recall interviews. The first dietary recall interview was collected in-person in the MEC15 while the second was collected by telephone 3–10 days later but never on the same day of the week as the MEC interview.16 Dietary interviews were conducted by trained interviewers using the validated17–19 US Department of Agriculture Automated Multiple-Pass Method (AMPM).20 For children under 9 years of age, the interview was conducted with a proxy; for children between 6 and 8 years of age, in the presence of the child. Children aged 9–11 years provided their own data assisted by an adult household member (assistant). The preferred proxy/assistant was the most knowledgeable person about the child's consumption on the day before the interview. If the child had more than one caregiver, several individuals could contribute to the intake data.15 ,16
Among the 13 272 people screened in NHANES 2009–2010, 10 537 (79.4%) participated in the household interview and 10 253 (77.3%) also participated in the MEC health examination.21 Of these, 9754 individuals provided 1 day of complete dietary intakes, of which 8406 provided 2 days.22
We evaluated 9317 survey participants aged 1 year and above who had 1 day 24 h dietary recall data and had not been breast fed on either of the 2 days. These individuals had similar sociodemographic characteristics (gender, age, race/ethnicity, family income and educational attainment) to the full sample of 10 109 interviewed participants aged 1 year and above.
Food classification according to processing
We classified all recorded food items (N=280 132 Food Codes for both recall days) according to NOVA, a food classification based on the extent and purpose of industrial food processing.23–25 This classification includes four groups: ‘unprocessed or minimally processed foods’ (such as fresh, dry or frozen fruits or vegetables, grains, legumes, meat, fish and milk); ‘processed culinary ingredients’ (including table sugar, oils, fats, salt, and other substances extracted from foods or from nature, and used in kitchens to make culinary preparations); ‘processed foods’ (foods manufactured with the addition of salt or sugar or other substances of culinary use to unprocessed or minimally processed foods, such as canned food and simple breads and cheese) and ‘ultra-processed foods’ (formulations of several ingredients which, besides salt, sugar, oils and fats, include food substances not used in culinary preparations, in particular, flavours, colours, sweeteners, emulsifiers and other additives used to imitate sensorial qualities of unprocessed or minimally processed foods and their culinary preparations or to disguise undesirable qualities of the final product). A detailed definition of each food group and examples of food items classified in each group are shown in online supplementary table S1. The rationale underlying the classification is described elsewhere.26–29
For all food items (Food Codes) judged to be a handmade recipe, the classification was applied to the underlying ingredients (Standard Reference Codes -SR Codes-) obtained from the United States Department of Agriculture (USDA) Food and Nutrient Database for Dietary Studies (FNDDS) 5.0.30 Refer to online supplementary material (OSM) for further details.
Assessing energy and added sugar contents
For this study, we used Food Code energy values as provided by NHANES.
For handmade recipes, we calculated the underlying ingredient (SR Code) energy values using variables from both FNDDS 5.030 and USDA National Nutrient Database for Standard Reference, Release 24 (SR24).31 Refer to OSM for further details.
Data on added sugars per Food Code and per SR Code were obtained by merging the Food Patterns Equivalents Database (FPED) 2009–2010 and the Food Patterns Equivalents Ingredients Database (FPID) 2009–2010.32 Added sugars are defined in these databases as “sugars that are added to foods as an ingredient during preparation, processing, or at the table. Added sugars do not include naturally occurring sugars (eg, lactose in milk, fructose in fruits). Examples of added sugars include brown sugar, cane sugar, confectioners’ sugar, granulated sugar, dextrose, white sugar, corn syrup and corn syrup solids, molasses, honey, and all types of syrups such as maple syrup, table syrups, and pancake syrup.”32 These two databases express the content of added sugars in teaspoons per 100 g. Teaspoons were converted into grams using the factor 4.2 g/teaspoon and into kcal using the factor 3.87 kcal/g.
Data analysis
We utilised all available day 1 dietary data for each participant. Food items were sorted into mutually exclusive food subgroups within unprocessed or minimally processed foods (n=11), processed culinary ingredients (n=4), processed foods (n=4) and ultra-processed foods (n=18), as shown in table 1. First, we evaluated the contributions of each of the NOVA food groups and subgroups to total energy and to the energy from added sugars. Next, we calculated the average content of added sugars in the overall US diet and in fractions of this diet composed by each of the NOVA food groups and subgroups. We also calculated the dietary content of added sugars in the group of unprocessed or minimally processed foods combined with the group of processed culinary ingredients, as foods belonging to these two groups are usually combined together in culinary preparations and therefore consumed together.
Distribution of the total energy intake and of the energy intake from added sugars according to food groups, and the mean content of added sugars of each food group
We used Gaussian regression to estimate the association between the dietary contribution of ultra-processed foods and the dietary content of added sugars, each expressed as proportions of total energy. This association was also explored after adjusting for the proportion of added sugars in non-ultra-processed energy intake. The dietary contribution of ultra-processed foods was transformed using restricted cubic spline functions to allow for non-linearity.
The average content of added sugars in the overall diet was compared across quintiles of the dietary contribution of ultra-processed foods. Poisson regression was used to assess whether the percentage of diets with more than 10% or 20% of total energy from added sugars increased across quintiles. This increase was also evaluated across demographic subgroups in stratified analysis. Tests of linear trend were performed in order to evaluate the effect of quintiles as a single continuous variable.
All regression models were adjusted for age (1–5, 6–11, 12–19, 20–39, 40–59, 60+ years), sex, race/ethnicity (Mexican-American, Other Hispanic, Non-Hispanic white, Non-Hispanic black, Other race including Multi-racial), ratio of family income to poverty (categorised on the basis of Supplemental Nutrition Assistance Program (SNAP) eligibility as 0.00–1.30, >1.30–3.50 and >3.50 and above)14 and educational attainment of respondents, for participants aged 20+ years, and of household reference persons otherwise (<12, 12 and >12 years). Since 908 participants had missing values on family income and/or educational attainment, multivariable-adjusted analysis included 8409 individuals. The analysis which also adjusted for the added sugar content of all non-ultra-processed foods grouped together included 8335 individuals.
The NHANES sample weights were used in all analyses to account for differential probabilities of selection for the individual domains, non-response to survey instruments, and differences between the final sample and the total US population. The Taylor series linearisation variance approximation procedure was used for variance estimation in all analysis in order to account for the complex sample design and the sample weights.14
To minimise chance findings from multiple comparisons, statistical hypotheses were tested using a two tailed p<0.001 level of significance. Data were analysed using Stata statistical software package V.12.1.
Results
Distribution of total energy intake by food groups
The average US daily energy intake in 2009–2010 was 2069.5 kcal, and nearly three in five calories (57.9%) came from ultra-processed foods (table 1).
Unprocessed or minimally processed foods contributed 29.6% of total calories, processed foods an additional 9.4%, and processed culinary ingredients the remaining 2.9%. The most common ultra-processed foods in terms of energy contribution were breads; soft drinks, fruit drinks and milk-based drinks; cakes, cookies and pies; salty snacks; frozen and shelf-stable plates; pizza and breakfast cereals. Meat, fruit and milk provided the most calories among unprocessed or minimally processed foods; ham and cheese, the most calories among processed foods; and table sugar and plant oils, the most calories among processed culinary ingredients.
Distribution of energy intake from added sugars by food groups
The average US daily intake of added sugars was 292.2 kcal (table 1). Notably, almost 90% of this (89.7%) came from ultra-processed foods. The main sources of added sugars among ultra-processed foods were: soft drinks (17.1% of US intake of added sugars); fruit drinks (13.9%); milk-based drinks (4.6%); cakes, cookies and pies (11.2%); breads (7.6%); desserts (7.3%); sweet snacks (7.1%); breakfast cereals (6.4%); and ice creams and ice pops (5.9%). In contrast, only 8.7% of the added sugars in the US diet came from processed culinary ingredients (table sugar consumed as part of dishes or drinks prepared from scratch by consumers or a cook), and only 1.6% from processed foods.
The average content of added sugars in ultra-processed foods (21.1% of calories) was eightfold higher than in processed foods (2.4%) and fivefold higher than in unprocessed or minimally processed foods and processed culinary ingredients grouped together (3.7%) (table 1).
Association between consumption of ultra-processed foods and added sugar intake
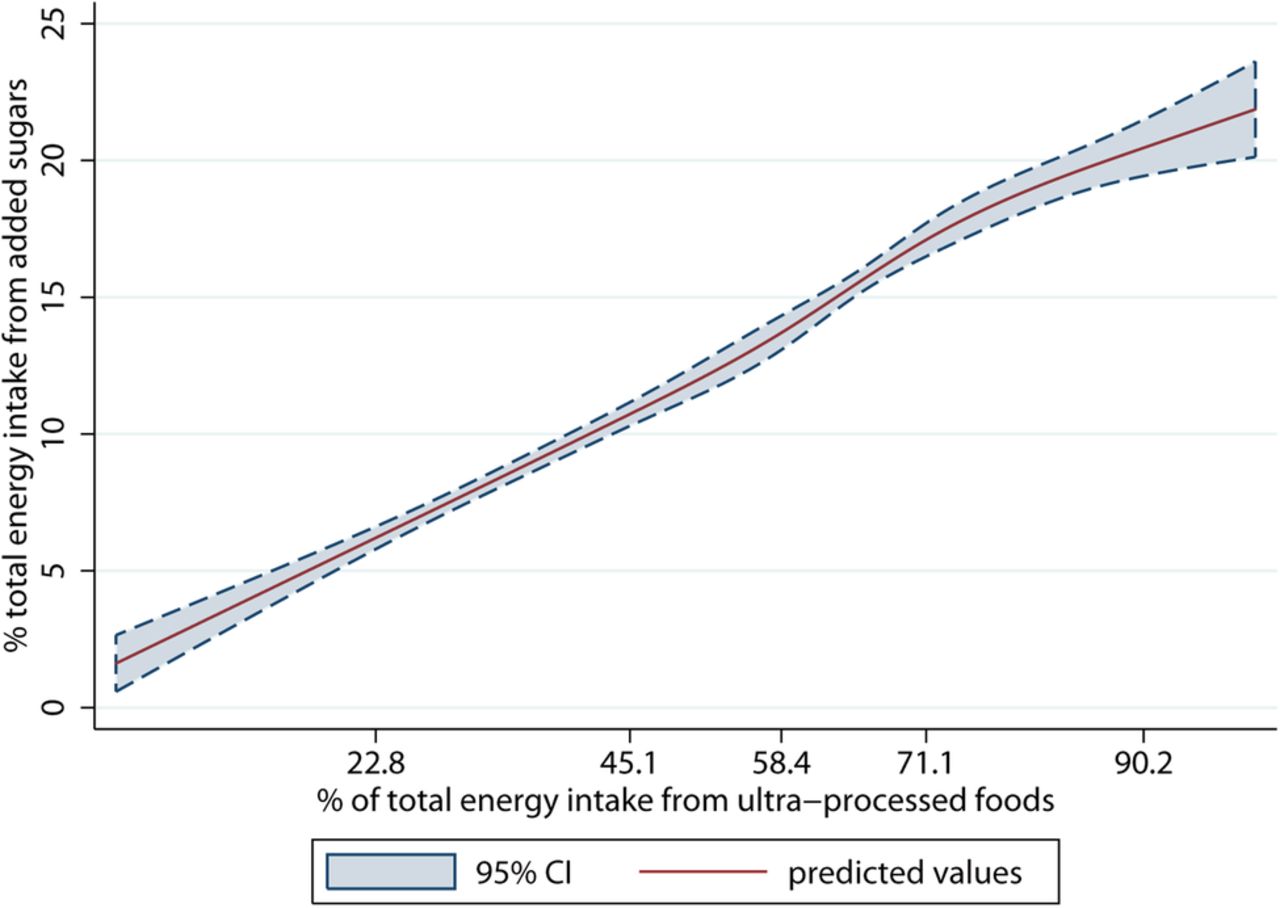
In unadjusted restricted cubic splines Gaussian regression analysis, a strong linear association was identified between the dietary contribution (percentage of calories) of ultra-processed foods and the dietary content (percentage of calories) in added sugars (coefficient for linear term=0.20, 95% CI 0.17 to 0.23) (figure 1).
The dietary content in added sugars regressed on the dietary contribution of ultra-processed foods evaluated by restricted cubic splines. US population aged 1+ years (National Health and Nutrition Examination Survey 2009–2010) (N=9317). The values shown on the x-axis correspond to the 5th, 27.5th, 50th, 72.5th, and 95th centiles for percentage of total energy from ultra-processed foods (knots). Coefficient for linear term=0.20 (95% CI 0.17 to 0.23). There was little evidence of non-linearity in the restricted cubic spline model (Wald test for linear term p<0.0001; Wald test for all non-linear terms p=0.27).
There was little evidence of non-linearity in the restricted cubic spline model (Wald test for linear term p<0.0001; Wald test for all non-linear terms p=0.27). The strength of the association remained fairly the same after adjusting for age, sex, race/ethnicity, family income, educational attainment and proportion of added sugars in non-ultra-processed energy intake (coefficient for linear term=0.19, 95% CI 0.17 to 0.22). Overall, each increase in 5 percentage points of energy in consumption of ultra-processed foods was associated with 1 higher percentage point of energy in the consumption of added sugars.
Across quintiles of energy-adjusted ultra-processed food consumption, the intake of added sugars increased substantially and monotonically from 7.5% of total calories in the lowest quintile to 19.5% in the highest quintile. Across the same quintiles, the proportion of individuals consuming more than 10% of total energy from added sugars (59.6% in the total population) increased from 26.4% to 82.1%, respectively. An even more pronounced increase was seen in the proportion of individuals consuming more than 20% of their total energy from added sugars: from 4.7% in the lowest quintile to 41.2% in the highest quintile (table 2). Similar increases were seen in stratified analysis by major demographic subgroups (see online supplementary table S2). The magnitude and the statistical significance of the association between the dietary contribution of ultra-processed foods and the dietary content in added sugars did not change with adjustment for sex, age, race/ethnicity, family income and educational attainment.
Indicators of the dietary content in added sugars according to the dietary contribution of ultra-processed foods
Discussion
In this analysis of nationally representative data, we confirmed the excessive consumption of added sugars in the USA.10 ,11 We also provide new evidence that ultra-processed foods represent more than half of all calories in the US diet, and contribute nearly 90% of all added sugars. Added sugars represented 1 of every 5 calories in the average ultra-processed food (21.1%), far higher than the content of added sugars in processed foods (2.4%) and in unprocessed or minimally processed foods, and processed culinary ingredients grouped together (3.7%). A strong linear relationship was found between the dietary contribution of ultra-processed foods and the dietary content of added sugars. Moreover, the risk of exceeding the recommended upper limit of 10% energy from added sugars was far higher when ultra-processed food consumption was high, and risk differences were even more pronounced for exceeding a limit of 20% energy. Notably, only those Americans in the lowest quintile of ultra-processed food consumption met the recommended limit of <10% energy from added sugars. To the best of our knowledge, this is the first study to assess the consumption of ultra-processed foods and establish its relationship with excessive added sugar intake in the USA.
The high consumption of added sugars in the USA is most likely contributing to excess obesity, type 2 diabetes, dyslipidaemia, hypertension and coronary heart disease.1 ,3–5 Consequently, most dietary guidelines now recommend limiting added sugar consumption. However, such guidelines are not always clear on how to put this recommendation into practice. Our study suggests that in the USA, limiting the consumption of ultra-processed foods may be a highly effective way to decrease added sugars. A reduction in ultra-processed foods should also increase the intake of more healthful, minimally processed foods such as milk, fruits and nuts, and freshly prepared dishes based on whole grains and vegetables, which would produce additional health benefits beyond the reduction in added sugar. Consistent with this approach, in Brazil, where the consumption of added sugars is as high as in the USA,33 the new dietary guidelines launched in 2014 emphasise the importance of not replacing unprocessed or minimally processed foods and freshly prepared dishes by ultra-processed foods.34
Few studies have assessed the impact of levels of food processing on the nutrient profile of the US diet. One analysis using data from NHANES 2003–200835 used a food classification system36 including ‘Mixtures of combined Ingredients’ and ‘Ready-to-eat’, which are mostly ultra-processed foods, and together contributed to about half of the total energy intake and three-quarters of energy intake from added sugars. Another study evaluated household barcoded purchasing data from 2000 to 2012 using a classification system guided by the one used in our study.37 In 2012, the mean per capita purchase of ‘highly processed foods’, a category similar to ultra-processed foods, corresponded to 61.0% of all calories and had higher adjusted median total sugar content than ‘less processed foods’. This report did not evaluate added sugars nor the contribution of processed foods to sugar intake. It also did not capture non-barcoded items such as unpackaged fresh fruit, vegetables and meat, or highly processed foods such as ready-to-eat store-prepared items. An investigation in Canada, using 2001 household purchasing data, found that ultra-processed foods are high in free sugars and that only households in the lowest quintile of ultra-processed food purchasing might have met the recommended limit of <10% energy from free sugars (9.2%).38 Being based on household purchasing data, these two prior studies and others based on the NOVA classification system23 ,39–42 could not evaluate the fraction of wasted food nor purchases at restaurants, which represent a substantial proportion of US calories. Our findings build on and considerably extend these prior reports by evaluating food processing and added sugar intake using contemporary, nationally representative dietary intake data in the USA.
Our study has several strengths. We studied a large, nationally representative sample of the US population, increasing generalisability. Use of data on added sugars, rather than total sugars or sugar-sweetened beverages, corresponds to the relevant area of prioritisation of recent national and international guidelines. Our investigation was based on individual consumption data, rather than market disappearance or household purchasing data which cannot account for differences between amounts purchased and amounts actually consumed.
Potential limitations should be considered. As with most population measures, dietary data obtained by 24 h recalls are imperfect. However, the standardised methods and approach of NHANES minimise potential error and bias, particularly for assessing population averages as focused on in the present study. Previous studies suggest that people with obesity may under-report consumption of foods with caloric sweeteners43 such as desserts and sweet baked goods.44 ,45 If so, these biases may lead to an underestimation of the dietary contribution of ultra-processed foods and the overall intake of added sugars, but should have much less effect on the association between these. Although NHANES collects some information indicative of food processing (ie, place of meals, product brands), these data are not consistently determined for all food items, which could lead to modest overestimation or underestimation of the consumption of ultra-processed foods.
In conclusion, we found that ultra-processed foods contribute almost 60% of calories and 90% of added sugars consumed in the USA. Only Americans in the lowest quintile of ultra-processed food consumption met the recommended guidelines for intake of added sugars. Decreasing the consumption of ultra-processed foods could be an effective way of reducing the excessive intake of added sugars in the USA.
References
Supplementary materials
Press release
Press release
Files in this Data Supplement:
Supplementary Data
This web only file has been produced by the BMJ Publishing Group from an electronic file supplied by the author(s) and has not been edited for content.
- Data supplement 1 - Online supplement
Footnotes
Contributors CAM, EMS and DM designed the research. EMS, LGB and MLdCL took care of data management. EMS, J-CM and MLdCL analysed the data. EMS, DM and CAM wrote the paper. CAM and EMS had primary responsibility for the final content. All the authors read and approved the final manuscript. All the authors had full access to all of the data (including statistical reports and tables) in the study and can take responsibility for the integrity of the data and the accuracy of the data analysis.
Funding This research received funding from Conselho Nacional de Desenvolvimento Científico e Tecnológico, Edital MCTI/CNPq/Universal 14/2014.
Competing interests DM reports ad hoc honoraria or consulting from Bunge, Haas Avocado Board, Nutrition Impact, Amarin, Astra Zeneca, Boston Heart Diagnostics, GOED, and Life Sciences Research Organisation; and scientific advisory boards, Unilever North America and Elysium Health.
Provenance and peer review Not commissioned; externally peer reviewed.
Data sharing statement No additional data are available.