Article Text

Abstract
Objectives To estimate the present value of current and future funding needed for HIV treatment and prevention in 9 sub-Saharan African (SSA) countries that account for 70% of HIV burden in Africa under different scenarios of intervention scale-up. To analyse the gaps between current expenditures and funding obligation, and discuss the policy implications of future financing needs.
Design We used the Goals module from Spectrum, and applied the most up-to-date cost and coverage data to provide a range of estimates for future financing obligations. The four different scale-up scenarios vary by treatment initiation threshold and service coverage level. We compared the model projections to current domestic and international financial sources available in selected SSA countries.
Results In the 9 SSA countries, the estimated resources required for HIV prevention and treatment in 2015–2050 range from US$98 billion to maintain current coverage levels for treatment and prevention with eligibility for treatment initiation at CD4 count of <500/mm3 to US$261 billion if treatment were to be extended to all HIV-positive individuals and prevention scaled up. With the addition of new funding obligations for HIV—which arise implicitly through commitment to achieve higher than current treatment coverage levels—overall financial obligations (sum of debt levels and the present value of the stock of future HIV funding obligations) would rise substantially.
Conclusions Investing upfront in scale-up of HIV services to achieve high coverage levels will reduce HIV incidence, prevention and future treatment expenditures by realising long-term preventive effects of ART to reduce HIV transmission. Future obligations are too substantial for most SSA countries to be met from domestic sources alone. New sources of funding, in addition to domestic sources, include innovative financing. Debt sustainability for sustained HIV response is an urgent imperative for affected countries and donors.
- PUBLIC HEALTH
This is an Open Access article distributed in accordance with the Creative Commons Attribution Non Commercial (CC BY-NC 4.0) license, which permits others to distribute, remix, adapt, build upon this work non-commercially, and license their derivative works on different terms, provided the original work is properly cited and the use is non-commercial. See: http://creativecommons.org/licenses/by-nc/4.0/
Statistics from Altmetric.com
Strengths and limitations of this study
The study uses most up-to-date cost, cost-effectiveness, coverage and epidemiological data to estimate funding needed for HIV treatment and prevention in nine sub-Saharan African countries that account for 70% of HIV burden in Africa.
The study uses rigorous modelling to estimate the present value of current and future funding needs in nine sub-Saharan African countries under different scenarios of intervention scale-up between 2015 and 2050.
The estimates extending for the first time from 2015 to 2050 suggest future obligations ranging from US$98 billion to maintain current coverage levels for treatment and prevention with eligibility for treatment initiation at CD4 count of <500/mm3 to US$261 billion if treatment were to be extended to all HIV-positive individuals and prevention scaled up.
The study quantifies the significant shortfall between financing obligations and future funding available from all sources for countries with high HIV burden to show that none of these countries can meet future obligations.
Projected estimates of financing obligations are limited by inherent uncertainties with modelling regarding future costs and availability of future interventions for HIV.
Introduction
Few would doubt the progress achieved in global health since 2000. The annualised rate of decline for under-five mortality per 1000 live births accelerated from 1.9 in 1990–2000 to 2.6 in 2000–2011.1 In 1990–2000, age-standardised HIV incidence per 100 000 population rose, on average, at an annualised rate of 1.3, and that from mortality by 13.6. But in 2000–2013, after a peak in 2005, the HIV incidence and mortality declined by an annualised average of 3.92 and 1.54 per 100 000 population, respectively.2
Despite the progress, the HIV/AIDS epidemic remains a major global threat, requiring sustained investments in health systems and disease control.3–5 In 1990, an estimated 8.5 million people were living with HIV/AIDS, 1.9 million children and adults were infected with HIV, and 350 000 succumbed to AIDS-related deaths.6
In 2002, just 300 000 people in low-income and middle-income countries (LMIC) were receiving ART.7 By 2015, this number had risen to nearly 16 million.8 New infections and increased longevity of HIV-infected persons receiving antiretroviral treatment (ART) meant that by 2014, the number of people living with HIV/AIDS had risen to 37 million. Yet, in sub-Saharan Africa (SSA), where 70% of the global total of 37 million HIV-infected people lives, less than half the persons needing ART receive it, and key prevention interventions have not reached UNAIDS targets,9 in spite of the evidence on the health and economic benefits of HIV prevention and ART.9–12
ART prevents onward transmission of HIV.13 ,14 While some have suggested that scaling up ART might place constraints on health systems in the short run, others have shown that increasing ART uptake reduces hospitalisation from AIDS, and lessens utilisation of other healthcare services for treated patients in the long run, releasing health system capacity to treat other illnesses.15–18
Many countries in the world are committed to ensuring access to HIV treatment for those individuals needing treatment.19 Long-term ART has a cost, however, and creates financing obligations, which HIV-affected countries need to meet from domestic and external sources of financing. Earlier studies have considered long-term costs and expenditures, as well as health and economic benefits of HIV prevention and treatment.11 ,12 Other studies have argued that long-term commitment for HIV prevention and treatment create a ‘fiscal liability’ for governments in countries which have high prevalence of HIV.20
In this study, we estimate the present value of future funding needed for HIV response in nine SSA countries with the highest burden of HIV, defined by the total number of people living with HIV, which have the most complete data, and represent the dominant types of HIV epidemics in SSA: South Africa, Zimbabwe, Zambia, Malawi (high prevalence >10%), Kenya, Uganda, Tanzania (5–10%), Nigeria and Ethiopia (<5%) (table 1). In total, these nine countries account for 75% of the total number of people living with HIV in SSA. We estimate future costs of HIV treatment and prevention at different levels of scale-up, analyse the gaps between current and future funding, and discuss the policy implications of future financing needs.
Grossdomestic product (GDP) per capita (2014, current US$) and HIV prevalence in selected sub-Saharan African countries
Methods
We use the Goals, AIM and DemProj modules from Spectrum,21 a publicly available modelling tool developed by international collaborators and currently used by UNAIDS. We apply, in our modelling, the most up-to-date cost and coverage data to provide a range of estimates for future financing obligations. While other HIV models, such as STDSIM which uses microsimulation,22 and analytical models, such as BBH23 co-developed by authors involved in this study, we choose Spectrum for the study to ensure easy replicability of our results, and for timely production and replication of results to help inform major funding decisions in SSA countries that are developing investment plans for HIV. Replicability is important in the context of the study presented here, because we hope to inform long-term government and donor funding decisions in SSA countries.
Using 2014 Spectrum files (currently, UNAIDS has released updated 2015 Spectrum files, available here: http://apps.unaids.org/spectrum/), we adjust epidemiological parameters for model fit based on instructions and parameter ranges provided by the Goals manual.24 We include key prevention services—prevention of mother-to-child transmission (PMTCT) screening and treatment, voluntary counselling and testing, condom distribution, voluntary medical male circumcision (VMMC), and interventions on vulnerable populations such as female sex workers, men who have sex with men, and injection drug users. Rates of VMMC in Nigeria, Kenya and Ethiopia are already above the UNAIDS target level. These countries, historically, have had high VMMC rates, believed to be driven by cultural and religious practices. Therefore, there is no reason to believe that they will require additional financing to maintain their already high rates of circumcision. Thus, for these three countries, we exclude the costs of VMMC in the total estimates. For the remaining countries, under the scale-up scenario, we assume a one-time scale-up of VMMC in 2015, and for subsequent years provide VMMC only to men who newly enter the cohort. For PMTCT, we assume universal screening of all pregnant women for HIV in line with PMTCT guidelines. We calculate the annual number of pregnant women using a modified version of the Centers for Disease Control and Prevention (CDC) point-in-time estimates approach (see online supplementary appendix for details). We also assume that 2.84% of patients on ART will transition from first-line to second-line regimen annually.25
Supplementary appendix
We estimate for the nine countries the financing needs for different scale-up scenarios by varying treatment initiation threshold (eligibility at CD4 count CD4 <500/mm3 and all HIV-positive individuals) and coverage level for prevention and treatment interventions (at ‘current’ coverage levels, and a ‘scale-up scenario’ reaching ‘universal’ coverage as defined by UNAIDS). We ran the model for two health system capacity levels for each of the two different treatment eligibility guidelines to generate four scenarios: (1) scenario 1—treatment initiation threshold at CD4 <500/mm3 and current ART and prevention coverage levels; (2) scenario 2—all HIV-positive individuals initiated on ART and current ART coverage and prevention levels maintained; (3) scenario 3—treatment initiation threshold at CD4 <500/mm3 with ART and prevention coverage scaled up to universal coverage and (4) scenario 4—all HIV-positive individuals initiated on ART, with ART coverage and prevention levels scaled up to reach universal coverage.
We estimate resources required for the nine countries for time horizons up to 2015, 2025, 2035 and 2050. In line with the UNAIDS HIV investment framework, we add 20% to the prevention and treatment costs to account for structural costs.26
We use unit cost data for treatment-related services from two sources: the MATCH study (Ethiopia, Malawi, Rwanda, South Africa, Zambia)27 and Menzies et al28 (Botswana, Ethiopia, Nigeria, Uganda). While noting limitations, to our knowledge, the two studies are the most representative costing studies to date. With the assumption that non-antiretroviral (ARV) costs, including costs for personnel, supplies, infrastructure, laboratory, facility-level training, equipment, building maintenance and administrative support, vary by the country's economic status, we regress the non-ARV costs by Gross Domestic Product (GDP) per capita of study countries to derive the linear relationships that allow us to estimate the non-ARV costs for other countries.
We set first-line ARV cost at US$132 per person per year (2012 USD), as suggested by the MATCH study, and second-line ARV cost at US$366 (2013 USD) as suggested by the Clinton Health Access Initiative. Unit costs for key prevention services were based on regional averages used by the 2011 HIV Investment Framework.13 We converted all unit costs that were to 2014 USD using the Consumer Price Indices from the Bureau of Labor Statistics.29
To account for future increase in cost of resources (eg, human resources, supplies, etc), we conduct separate analyses that assume a rate of increase in line with average GDP per capita. We use International Monetary Fund (IMF) World Economic Outlook projected GDP per capita growth rate of 2.5% for SSA. As the IMF publishes projections through 2020 only, and we extrapolate through 2050, we assume an annual growth rate of GDP per capita of 2.5%, in line with the outer years of IMF projections.30 This set of estimates is provided in the online supplementary appendix. We estimate the present value of costs at 2014 USD, which form future funding obligations for SSA using discount rates of 3% as recommended by WHO,31 and 5% as used in earlier studies.32
We use data from Resch et al33 to quantify health expenditures in SSA for HIV from domestic and international sources to illustrate the gap between current expenditures and funding obligation. Viewing these financing obligations as ‘HIV debt’, we compare them to the countries’ current total public debt.i We derive ratios comparing the countries’ current total public debt to GDP per capita, HIV debt to GDP per capita, and the sum of the two debts to GDP per capita.
We provide a summary of the current and universal coverage levels for different interventions modelled, and the assumptions made regarding costs and health outcomes in the online supplementary appendix.
Results
We first present the financing needs for 2015 for the nine sub-Saharan countries, unadjusted for future increase in cost of resources at the level of GDP per capita increase. With eligibility for treatment initiation at CD4 count of <500/mm3, where current treatment and prevention coverage levels are maintained with a growing population level (scenario 1) requires US$4.1 billion. Projected annual costs with 3% discounting are US$3.2 billion, US$2.4 billion and US$1.8 billion in 2025, 2035 and 2050, respectively. Changing the eligibility for treatment initiation to all HIV-positive individuals at current coverage levels (scenario 2), increases the projected cost to US$5.0 billion in 2015, declining thereafter to US$3.7 billion, US$2.5 billion and US$1.8 billion in 2025, 2035 and 2050, respectively.
Expanding access to achieve universal treatment coverage for SSA, with eligibility for treatment initiation at CD4 count of <500/mm3 (scenario 3) would require annual resources of US$11.2 billion in 2015. With 3% discounting projected costs for 2025, 2035 and 2050 would be US$8.5 billion, US$6.1 billion and US$4.5 billion, respectively.
Extending treatment eligibility to all HIV-positive individuals and expanding prevention (scenario 4) would increase the annual cost projection to US$12.8 billion in 2015, declining thereafter to US$8.7 billon, US$6.1 billion and US$4.5 billion in 2025, 2035 and 2050, respectively. In figure 1, we see that the resources required for all four scenarios decrease steadily over time, and the scale-up scenarios decrease at a steeper rate than the current coverage scenarios.

Annual resources required by nine sub-Saharan countries (US$ billions) from 2015 to 2050 (3% discounting).
We next provide the present value of future financing needs (using discount rates of 3% and 5%) for the nine SSA countries under the four HIV treatment scenarios and three time horizons.
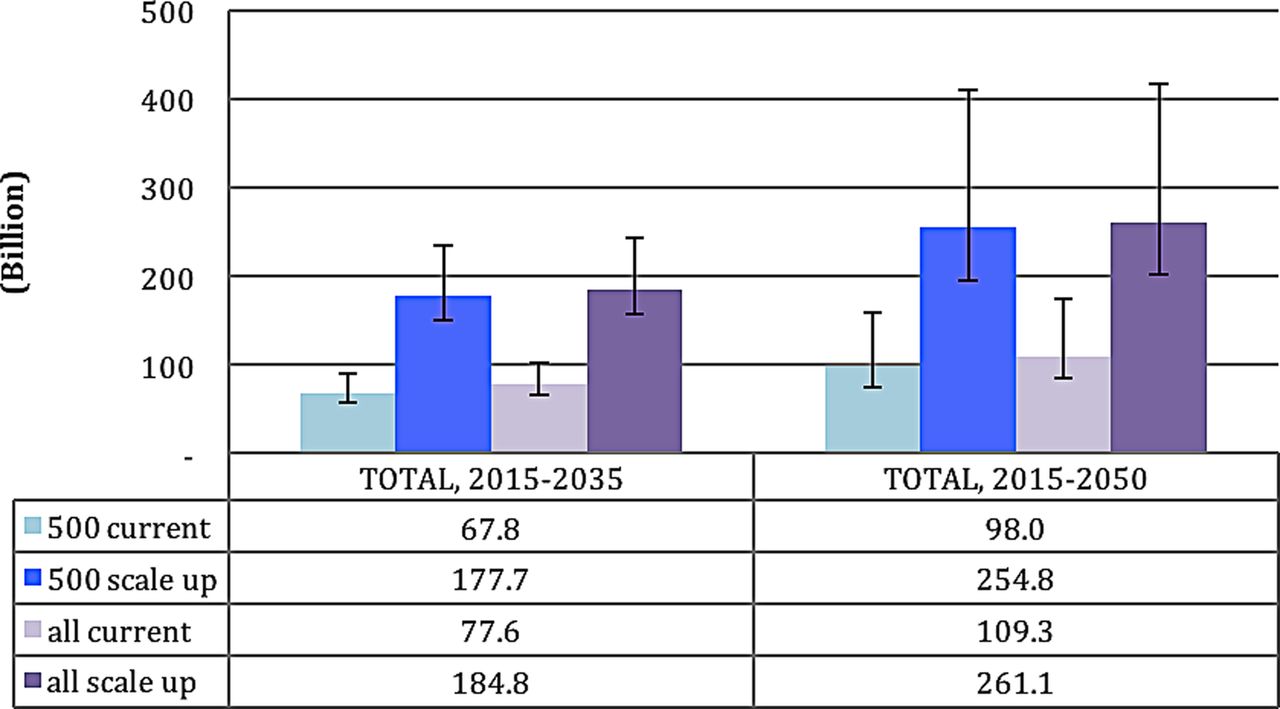
Under scenario 1 (treatment initiation at CD4 count of <500/mm3 and current coverage levels maintained) the present values of future financing needs for the nine countries at 3% discount rate are US$68 billion for 2015–2035 and US$98 billion for 2015–2050, respectively. At 5% discount rate for scenario 1, the present values of future obligations for 2015–2035 and 2015–2050 are US$58 billion and US$75 billion, respectively. If all HIV-positive infected individuals were eligible for treatment, and current coverage levels maintained (scenario 2), at discount rates of 3% and 5%, the present value of obligations for 2015–2050 would be US$109 billion and US$85 billion, respectively (figure 2).

Cumulative resources required by nine sub-Saharan countries (US$ billions) in between 2015–2035 and 2015–2050 (the numbers show projections with 3% discounting; the error bars show result for 0% and 5%) by different scenarios of service coverage. Note: Bars represent estimates using 3% discounting. Lower and upper bounds of lines represent estimates using 0% and 5% discounting, respectively.
Under scenario 3 (universal coverage with eligibility for treatment initiation at CD4 count of <500/mm3), the present value of financing needs for the nine countries for 2015–2050 would be US$255 billion and US$196 billion at 3% and 5% discount rates, respectively. Under scenario 4, where all HIV-positive infected individuals were eligible for treatment with universal coverage, for 2015–2050, the present value of financing obligations would rise to US$261 billion and US$202 billion at 3% and 5% discount rates, respectively (figure 2).
We then estimate the present value of resources required by the nine sub-Saharan countries for 2015–2050 at 3% discount rate with the costs of human resource and supplies increasing by the projected annual growth of GDP per capita of 2.5%. These estimates suggest the cumulative resources required to be US$146 billion for scenario 1, US$378 billion for scenario 2, US$161 billion for scenario 3, and US$384 billion for scenario 4 (online supplementary figure S1, with annual resources required presented in online supplementary figure S2).
Figure 3 explores the distribution of resources required between treatment, prevention and structure costs for the four scenarios. For all four scenarios, we see a steady decline in the proportion of treatment cost over time, and an increase in the proportion of prevention costs. The decline in treatment costs can be explained by the fact that the number of adults on treatment decreases with time. As expected, prevention costs increase over time because they are invested mostly in non-infected populations, which increases with population growth.

Distribution and trend of treatment, prevention and structural costs for nine sub-Saharan countries in 2015–2050 for the four scenarios of treatment initiation and intervention scale up, with 3% discounting 500 current: scenario 1—treatment initiation at CD4 count of <500/mm3 and current coverage levels maintained All current: scenario 2—treatment initiation for all HIV positives and current coverage levels maintained 500 scale up scenario 3—universal coverage with eligibility for treatment initiation at CD4 count of <500/mm3 All scale-up: scenario 4—universal coverage with eligibility for treatment initiation for all HIV positives. Blue: treatment costs, orange: prevention costs, green: structural costs.
While total prevention costs increase over time due to rapid expansion of the population, per capita investment in HIV treatment declines rapidly, as with the declines observed in incidence, prevalence and mortality, as the benefits of prevention and treatment are realised (figure 4).ii

Per capita annual resources required by nine sub-Saharan countries ($US) from 2015 to 2050 (3% discounting).
We next provide for the nine sub-Saharan countries with different HIV prevalence and levels of GDP per capita (table 1) expenditures from domestic and international sources, and estimates of resource needs for treatment, key prevention services, and structural costs in 2015.
Figure 5 shows the resources required in 2015, by comparison with the countries’ level of domestic and international sources.

Total expenditures on HIV from domestic and international sources combined (current US$) in selected sub-Saharan African countries, compared with estimated resource needs for treatment, prevention and structural interventions in 2015 under different coverage levels and eligibility for treatment. EAE, external AIDS expenditure; GEA, Government Expenditure on AIDS; RNE, resource needs estimate. GEA and EAE estimates are from Resch et al 2015.
Figure 5 shows that current spending for HIV in the selected countries is driven by external donor assistance. Of all the countries studied, South Africa has the largest resource needs, but it also contributes the largest proportion (82%) of resource needs at current coverage rates from domestic budgets. Nigeria and Kenya represent the countries with the next highest burden and resource needs, but they contribute only 21% from domestic expenditure while 79% is funded through external aid. All other countries contribute between 10% and 14% of their current resource needs (at current coverage rates) from domestic sources.
With scale-up of treatment under both treatment threshold scenarios, the estimated resource needs in all countries would increase by at least twofold, and will require significant increases in funding if the funding gap is to be closed.
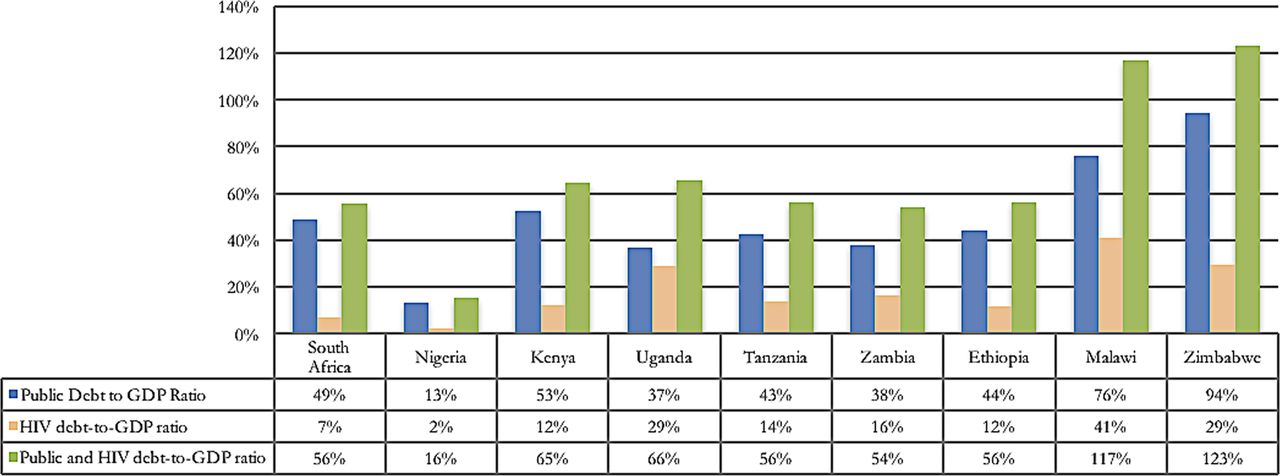
The current public (external and internal) debt-to-GDP ratio, HIV debt-to-GDP ratio (with ‘HIV debt’ defined as resources required for treatment and key prevention services from 2015 to 2035, with 3% annual discount rate), and total debt-to-GDP ratio (adding public and HIV debts) for nine SSA countries, are presented in figure 6. While in 2014, the ratio of public debt-to-GDP was 76% for Malawi and 37% for Uganda, we estimate that with the addition of new funding obligations for HIV—which arise implicitly through commitment to achieve higher than current ART coverage levels—overall ‘financial obligations’ (the sum of debt levels and the present value of the stock of future HIV obligations) rise to 117% for Malawi, and 66% for Uganda).
Public debt, HIV obligations and Public and HIV debt-to-GDP ratios. Data sources: Current Total Debt for each country derived from the International Monetary Fund30 Debt Sustainability Analysis—Country Report.
Discussion
In the nine SSA countries, the estimated resources required for HIV prevention and treatment in 2015–2050 are large. At 3% discount rate, they range from US$98 billion to maintain current coverage levels for ART and prevention with eligibility for treatment initiation at CD4 count of <500/mm3 to US$261 billion if ART were to be extended to all HIV-positive individuals and prevention scaled up. This range extends from US$136 billion to US$359 billion if costs of human resources and supplies increase at the rate of GDP per capita.
These financing needs create long-term financing obligations with fiscal challenges, as Haacker notes.21 As ‘hidden debt’, these obligations pose fiscal and debt sustainability challenges for the sub-Saharan countries that lack the domestic financial resources, fiscal flexibility and economic strength.
There is an ethical responsibility to continue financing for those receiving ART, and not abandon them to death.34 The responsibility extends to people in equal need of ART but who have not yet gained access to treatment. A durable HIV response,35 ,36 underpinned by sustained financing37 and effective health systems, is critical to protect the gains and sustain HIV response. However, Lule and Haacker38 raise concerns on the fiscal dimension of HIV for affected countries, which need to understand the magnitude of future expenditures for HIV, and the health and economic benefits of these expenditures.
We show that ‘front-loading’ investments in HIV scale-up now to ensure high levels of coverage will significantly reduce future HIV incidence and prevalence by realising the long-term preventive effects of ART to reduce HIV transmission. Investing upfront also translates into lower future expenditures as indicated by figures 3 and 4, but lower treatment costs are partly offset by the scaling up of prevention expenses.
These expenditures need to be funded from somewhere. Potential sources of funding include domestic financing, development assistance for health (DAH) and innovative financing.
Domestic financing is the most important source of funding for HIV. In 2011, however, only 8 of the 48 SSA countries had reached the Abuja target of allocating 15% of government budget to health.34 Fiscal space considerations mean that government budgets of HIV-affected countries will be constrained. Potential sources of additional domestic financing include higher tax revenues, with expansion of the formal sector with economic growth, and more effective tax collection, new revenues natural resources, health insurance (as sub-Saharan countries move to implement universal health coverage) and better channelling of health and HIV budgets to cost-effective interventions.
With global economic malaise and the climate of austerity, DAH has plateaued since 201039 and is unlikely to increase significantly in the near term. But the long-term funding needs for HIV have created ‘contingent liabilities’ for affected countries. While these contingent liabilities are ‘off balance sheet’ or ‘off budget’, and hence may not be recorded officially as debt, they must be met. ‘Debt sustainability’ remains a critical issue not just for HIV-affected countries but also donors who are encumbered by high levels of sovereign debt. Concessional finance or debt guarantees from the World Bank and the Global Fund could help HIV-affected countries to borrow on more favourable terms to invest in HIV prevention, effectively leverage international financial flows, and replace the short donor replenishment cycles that are mismatched with long-term financing needs.
Innovative financing, which in 2002–2012 raised more than US$6.0 billion40 from the Airline Solidarity Levy,41 the Children's Investment Fund Management,42 and the International Finance Facility for Immunization,43 offers a further source of funding, including from social impact bonds, social development bonds, diaspora bonds, sovereign bonds securitised against future revenue streams from extractive industries, and consumption taxes on alcohol and tobacco. Innovative financing also offers the opportunity to integrate donor and domestic responses and ‘front-load’ HIV spending, as have been done through Advance Market Commitments for pneumococcal vaccine.44
In addition to new additional financial resources, efficiency savings in health systems could create substantial fiscal space by achieving higher HIV treatment and prevention coverage without budgetary increases. The IMF estimates that up to 50% of health expenditures, equal to 1–3% of total GDP in LMIC, may be wasted.45
Our estimates have met the limitations experienced by earlier studies aimed at projecting future costs of HIV. First, limited systematic cost and outcome data increases the uncertainties on future costs and benefits of interventions, especially as the theoretical and empirical understanding of the relationships between coverage rates, unit costs and scale of programmes is not well developed. Second, Spectrum modelling does not incorporate a dynamic health systems component that takes into account individual behaviour to enrol in health services to receive ART at a given system capacity. There is, hence, a need for agent-based dynamic models that capture individual behaviours and their interaction with health systems. Third, the need for prevention services may be linked to incidence and projected prevalence over time, which are likely to decline as incidence levels fall. However, we took a conservative approach in assuming that the commitment to prevention remains the same, independent for underlying need for prevention services.
HIV-positive individuals receiving ART will experience immune suppression from long-term effects of ART and HIV infection, and develop comorbidities,46 as well as chronic illness due to ageing, unrelated to HIV or ART. These morbidities will result in additional costs for health systems.32 This is why, as with the HIV Investment Framework, we included in our model 20% cost for health systems in addition to costs of prevention and ART.11
More than 35 years into the HIV epidemic, the quality and quantity of data are unacceptably low, and uncertainties about costs, benefits and future technologies for HIV remain. However, notwithstanding data limitations, and the uncertainty these create, our estimates suggest substantial long-term financing obligations, which must be met to sustain the fight against HIV.
References
Footnotes
Contributors RA conceived the study. AYC, OO and SS undertook the analysis with guidance from RA. RA wrote the first draft with inputs from AYC, OO and SS. All authors contributed to the subsequent versions of the manuscript and have seen and approved the final manuscript.
Funding The Rush Foundation and Harvard University. This paper was published as part of RethinkHIV. RethinkHIV is a consortium of senior researchers, funded by the RUSH Foundation, who evaluate new evidence related to the costs, benefits, effects, fiscal implications and developmental impacts of HIV interventions in sub-Saharan Africa.
Competing interests None declared.
Provenance and peer review Not commissioned; externally peer reviewed.
Data sharing statement No additional data are available.
↵i Total external debt is defined by the World Bank as ‘the sum of public, publicly guaranteed, and private nonguaranteed long-term debt, use of IMF credit, and short-term debt’ (http://data.worldbank.org/indicator/DT.DOD.DECT.CD).
↵ii The variation in the annual resources required over time reflects not only the changes in HIV incidence and prevalence but also population growth, since prevention services are scaled linearly by population size. For example, resources required in the scale-up scenarios are greater than status quo scenarios due to population growth, even though HIV incidence and prevalence decrease faster in the former. To simplify the interpretation of these figures, we artificially excluded the effect of population growth to derive the present value of financing obligations for 2015–2050. Holding the population size and per capita resources required constant at the 2015 level, the total resources required for the four scenarios are presented in the online supplementary figure S3.