Article Text

Abstract
Objectives To assess the effects of a home-based telehealth intervention on the use of secondary healthcare and mortality.
Design Observational study of a mainstream telehealth service, using person-level administrative data. Time to event analysis (Cox regression) was performed comparing telehealth patients with controls who were matched using a machine-learning algorithm.
Setting A predominantly rural region of England (North Yorkshire).
Participants 716 telehealth patients were recruited from community, general practice and specialist acute care, between June 2010 and March 2013. Patients had chronic obstructive pulmonary disease, congestive heart failure or diabetes, and a history of associated inpatient admission. Patients were matched 1:1 to control patients, also selected from North Yorkshire, with respect to demographics, diagnoses of health conditions, previous hospital use and predictive risk score.
Interventions Telehealth involved the remote exchange of medical data between patients and healthcare professionals as part of the ongoing management of the patient's health condition. Monitoring centre staff alerted healthcare professionals if the telemonitored data exceeded preset thresholds. Control patients received usual care, without telehealth.
Primary and secondary outcome measures Time to the first emergency (unplanned) hospital admission or death. Secondary metrics included time to death and time to first admission, outpatient attendance and emergency department visit.
Results Matched controls and telehealth patients were similar at baseline. Following enrolment, telehealth patients were more likely than matched controls to experience emergency admission or death (adjusted HR 1.34, 95% CI 1.16 to 1.56, p<0.001). They were also more likely to have outpatient attendances (adjusted HR=1.25, 1.11 to 1.40, p<0.001), but mortality rates were similar between groups. Sensitivity analyses showed that we were unlikely to have missed reductions in the likelihood of an emergency admission or death because of unobserved baseline differences between patient groups.
Conclusions Telehealth was not associated with a reduction in secondary care utilisation.
- PREVENTIVE MEDICINE
This is an Open Access article distributed in accordance with the Creative Commons Attribution Non Commercial (CC BY-NC 4.0) license, which permits others to distribute, remix, adapt, build upon this work non-commercially, and license their derivative works on different terms, provided the original work is properly cited and the use is non-commercial. See: http://creativecommons.org/licenses/by-nc/4.0/
Statistics from Altmetric.com
Strengths and limitations of this study
We evaluated the effect of a large telehealth service on emergency hospital admissions, within an observational study of routine clinical practice, using hospital administrative data.
The effectiveness of telehealth might be different, in routine practice, to clinical trials, as healthcare professionals can tailor the telehealth services to the local context over time and might also recruit patients with different characteristics than those in trials.
We compared telehealth patients with local patients who were eligible for telehealth but were receiving usual care. These were matched to the characteristics of telehealth patients (demographics, diagnoses of health conditions, previous hospital use and predictive risk score) using a machine-learning algorithm.
We conducted sensitivity analyses to assess whether confounding could plausibly have altered our findings.
The retrospective nature of the study avoided the risk of a Hawthorne effect, but we had to exclude approximately 22% of telehealth patients whose diagnosis we could not confirm within the hospital administrative data.
Introduction
Telehealth has been proposed as a way to improve the management of long-term health conditions such as diabetes, chronic obstructive pulmonary disease and heart failure.1 It involves the regular and remote transmission of medical information (such as blood oxygen or weight) between patients and healthcare professionals. The hope is that, by encouraging patients to monitor aspects of their own health and by providing timely feedback from professionals, telehealth might lead to better patient outcomes. In turn, policymakers hope that telehealth will avoid unnecessary unplanned (‘emergency’) hospital admissions, which are costly as well as undesirable to patients.2
Early meta-analyses about the effect of telehealth were positive,3 but recent, large randomised controlled trials have tended to be ambiguous or negative about the effects of telehealth on hospital utilisation. The largest trial, the Whole Systems Demonstrator, compared telehealth with usual care in over 3000 patients with diabetes, chronic obstructive pulmonary disease or heart failure. This showed lower rates of emergency hospital admissions and deaths among telehealth patients than controls, but these findings may have been linked to unexpected patterns among controls.4 Other large trials found no effects on time to hospital admission following an exacerbation in chronic obstructive pulmonary disease,5 and no change in readmissions for heart failure.6 Randomisation is used to produce comparable treatment groups, but randomised controlled trials can have limited applicability to medical decision-making, as either the treatments or patient groups might differ to routine practice.7 This has now been confirmed in a formal analysis of the generalisability of the Whole Systems Demonstrator trial.8
In this study, we assess the effect of telehealth on hospital utilisation and mortality when delivered in routine practice. Although our study was not randomised, we used machine-learning methods to select, from a wider pool of potential controls, a matched subset of patients that was similar to the telehealth group with respect to observed baseline characteristics.9 These methods have been proposed for evaluative studies of telehealth,10 but the few existing matching studies in this area11–13 have not subjected their findings to rigorous sensitivity testing to explore whether the reported treatment effects might be attributable to unobserved differences in the baseline characteristics of intervention and control groups.14
Methods
The North Yorkshire and York Primary Care Trust commissioned a telehealth programme for patients with chronic obstructive pulmonary disease, heart failure or diabetes, in July 2010, making it an early adopter of telehealth in England.2 We conducted a retrospective study that linked telehealth patients to hospital administrative data, and selected a matched control group of patients from within North Yorkshire. Local controls were preferred as this minimises bias in studies of hospital admissions compared with strategies that select controls from similar geographical areas.15 Controls were matched for important prognostic variables including predictive risk score, demographic characteristics, diagnoses of health conditions and prior hospital utilisation. The study was conducted in line with the original evaluation protocol (see online supplementary material) except that general practice data were not available, thus limiting the number of secondary endpoints that could be assessed.
Telehealth intervention
The patient's clinician determined if telehealth was appropriate for the patient based on a number of considerations (box 1). The telehealth equipment consisted of the home-based Tunstall mymedic monitoring ‘hub’, and a set of peripheral devices that measured aspects of a patient's health. Which peripheral devices were used depended on the patient's diagnosis but could include: weighing scales; pulse oximeters; blood pressure monitors; thermometers; blood glucose metres; peak-flow monitors or spirometres; coagulation metres; and 1-lead ECG. Standard configurations for patients with chronic obstructive pulmonary disease are shown as an example in the online supplementary table S1. In addition, an automated health questionnaire was delivered through mymedic. This asked patients about their general health status.
Referral criteria for telehealth
Eligible patients could be referred into the telehealth programme from community teams, general practice, or on discharge from a secondary care facility, such as a cardiology department. The referral criteria were broad and overlapping, and also changed over time. The service recruited patients:
Diagnosed with one of the targeted chronic conditions (chronic obstructive pulmonary disease, heart failure and diabetes)
With one of the targeted chronic conditions and two or more emergency (unplanned) hospital admissions in the previous 12 months
Deemed to be at risk of having an emergency admission in future, for example, through identification by the Adjusted Clinical Groups predictive risk model44
With high anxiety levels who usually defer to unplanned or emergency services and who could benefit from this level of support
Who accessed general practice services, the out of hours services or the emergency services frequently
Patients who the referring clinician deemed would benefit from telehealth
In addition, patients had to be considered capable of using the equipment (this included understanding instructions and the patient informed consent form). Patients were not eligible for telehealth if their home was not suitable for it, for example, if there was no regular telephone line or no access to a mobile (cellular) telephone for transmission of the telemonitored data and for communication with the monitoring centre.
Referring clinicians gave patients personal schedules for telemonitoring, which were coded into mymedic. Tuition was provided to patients in the use of the equipment when it was installed. Typically, patients were required to use the telehealth peripherals once a day, although some patients took readings more often. The recordings were transmitted automatically to a triage centre, operated by Tunstall. If a recording exceeded a threshold set by the referring clinician, then an agent at the triage centre contacted the patient to ask them to repeat the measurement. The agent also asked further questions regarding the patient's health. If the reading continued to exceed the threshold or if the intervention of a healthcare professional was required, then the situation was escalated to the monitoring clinician.
Study populations
We studied patients enrolled in the North Yorkshire telehealth programme between the time it started (July 2010) and the time it was decommissioned following a reorganisation of the National Health Service (NHS) in England (31 March 2013). We restricted our attention to patients with a diagnosis of chronic obstructive pulmonary disease, congestive heart failure or diabetes recorded in inpatient administrative data within the three previous years. This was done so that we could standardise our criteria across our intervention and control groups. The matching algorithm described below aimed to adjust for other characteristics that might be associated with receipt of telehealth beyond these criteria.
We excluded a small number of intervention patients who did not transfer telehealth readings. We also excluded (from both intervention and control groups) participants in the initial pilot programme that ran from September 2009 to May 2010 and those in another telehealth service for residents of care homes.
Study endpoints and sample size calculation
The main hypothesis was that telehealth affected (in either direction) the time to the first emergency hospital admission or death following enrolment in telehealth. The study reflected events up until the service was decommissioned on 31 March 2013.
At the outset of this study, we conducted a sample size calculation to check whether we were likely to have data on a sufficiently large number of telehealth patients to draw robust conclusions. In line with other studies in this area,16 we wanted to be able to detect a 15–20% relative change in the time to first emergency admission or death (as measured by the hazard ratio (HR)), at power 90% and two-sided p value <0.05. Sample size calculations assumed: individuals were recruited into the telehealth service at a uniform rate; 25% of matched control patients experienced an emergency admission or death each year; and 95% of telehealth patients were linked to administrative data for this study. The calculation determined that 715 telehealth patients were needed to detect a relative change of 20% in the primary endpoint.
Secondary endpoints were time to death; and time to the first emergency admission, elective admission, outpatient attendance, emergency department (ie, accident and emergency) visit, and admission for an ambulatory care-sensitive condition. Ambulatory care-sensitive conditions are those conditions for which admissions are considered preventable by primary care services.17 ,18 We could not assess impacts on general practice contacts, as these data were not available.
Data sources and linkage
Tunstall transferred identifiable data for telehealth participants (including the national unique patient identifier or ‘NHS number’, sex, date of birth and postcode) to the NHS Health and Social Care Information Centre (HSCIC). HSCIC acted as a trusted third party and linked telehealth participants to national administrative data on secondary care activity (the Hospital Episode Statistics, or HES).19 The data linkage method required an exact or partial match on several of the identifiable fields at once.
After the data had been linked, HSCIC transferred pseudonymised HES identifiers for the telehealth participants to the evaluation team then based at the Nuffield Trust, together with the date of patient enrolment in the telehealth programme, year of birth, sex and small geographical area code. Thus, the evaluation team had no access to identifiable patient data. The Ethics and Confidentiality Committee of the National Information Governance Board confirmed that data could be linked in this way without explicit patient consent for the purposes of studies of this nature.
Baseline variables
Baseline variables were derived for intervention and potential control patients using HES data. For telehealth patients, these were calculated at the date of registration in the telehealth system. For matched controls, variables were calculated at certain index dates that were produced by the matching algorithm (described below, box 2).
Matching algorithm
Rather than include each potential control patient only once in the matching process, we calculated predictive risk scores for each potential control patient at 33 ‘index dates’, corresponding to months spanning the enrolment period (July 2010–March 2013). Thus, there were up to 33 possible ‘observations’ of each potential control patient, with the baseline variables and risk score calculated with respect to each index date. Such replication meant that an individual could contribute observations that were more closely matched to a telehealth patient than if the individual was only included once. We removed observations for which the potential control patient had died before the index date or where there did not exist an inpatient hospital admission that resulted in a diagnosis of chronic obstructive pulmonary disease, congestive heart failure or diabetes within 3 years prior to the index date.
Having assembled a data set containing telehealth patients and up to 33 observations for each of the potential controls, the data set was stratified by age.20 Within each age strata, we used a calliper approach whereby the pool of potential matches of similar age for a given telehealth patient was narrowed down to those patients with a similar predictive risk score (within 20% of 1 standard deviation).22 From within this restricted set, individual matches were selected using genetic matching,44 a computer-intensive search algorithm that can produce more closely matched control groups than traditional matching approaches.8 One matched control was selected per intervention patient, with replacement.
The set of baseline variables was based on an established predictive risk model for emergency hospital admissions.20 These variables were: age band; sex; small area-based socioeconomic deprivation score;21 16 individual health conditions; the number of long-term health conditions; and previous emergency, elective and outpatient hospital use. The 16 individual health condition variables were formed from the primary and secondary diagnosis codes in the previous 3 years of inpatient data (table 1). We used the definitions from previous studies to derive admissions for ambulatory care-sensitive conditions.17 ,18
Baseline characteristics of the study groups before and after matching
In addition to these baseline variables, we also estimated the baseline risk of emergency hospital admission in the 12 months following enrolment. The models were based on the variables used in the published predictive risk model,20 but reweighted to reflect patterns of hospital utilisation observed for non-telehealth residents of North Yorkshire. Models were constructed using logistic regression on a monthly basis throughout the enrolment period and validated on split samples. The estimated β coefficients from the validated models were then applied to telehealth patients to produce their baseline risk scores, as is recommended practice when using predictive risk scores in matching studies.22
Selecting matched controls
The matching algorithm (box 2) aimed to select, from the wider population of potential controls, a subgroup of matched controls who were similar to the patients in the telehealth group with respect to baseline variables.9 Our main diagnostic was ‘balance’, or the similarity of the distribution of baseline variables between telehealth and matched control groups. We assessed balance using the standardised difference, defined as the difference in means as a proportion of the pooled standard deviation.23 It is not recommended to use formal statistical tests because they depend on the size of the groups as well as on their similarity, and thus can be misleading.24 Although the standardised difference would ideally be minimised without limit, 10% is often used as a threshold to denote meaningful imbalance.25 As the standardised difference only measures a difference in means, we also assessed the ratio of variances in the two groups.26
Only after matched control groups had been selected were the study endpoints calculated.
Statistical approach
Comparisons of the time-to-event endpoints were made graphically using Kaplan-Meier charts,27 and then analytically using Cox regression28 with robust standard errors29 to account for the matched nature of the data.23 Unadjusted and adjusted analysis was carried out, with the adjustment using the baseline variables considered for the matching algorithm. All patients were censored on 31 March 2013, when the telehealth service was terminated. For secondary endpoints not involving mortality, we considered patients who died as being censored at their date of death.
The use of national administrative data to define variables meant that we considered there was a limited amount of missing data, because patients could be tracked even if they moved out of the North Yorkshire area, provided that they remained within England.
Secondary analysis
The main threat to the validity of non-randomised studies is confounding due to intervention and control groups differing at baseline in terms of variables that are also predictive of outcome. While intervention and matched control groups appeared similar, we were concerned that some differences might be unobserved. Therefore, we conducted two secondary analyses. First, for the subset of patients enrolled before 30 September 2012 (for whom we had at least 6 months’ of follow-up data), we performed difference-in-difference analysis.30 This was expected to remove the impact of confounding variables provided that the association between these confounding variables and the outcome is constant over time.31 In this analysis, we calculated the differences in the number of emergency admissions, for example, between the 6 months prior to enrolment and the subsequent 6 months, and compared these differences between intervention and matched control groups using mixed multiple linear regression models, with adjustment for baseline variables.
Second, we conducted sensitivity analysis to test the robustness of our findings to time varying, unobserved confounding.32 This involved simulating a hypothetical unobserved confounder, which was assumed to be binary valued. We assumed a range of values for the associations between the unobserved confounder and intervention status (telehealth or not telehealth) and between the unobserved confounder and outcome (emergency admissions). We used a method developed by Carnegie et al33 to determine how strong these associations would have to be for our findings to be altered.
Results
Study populations
Of the 1261 patients ever enrolled into the telehealth programme, 754 patients passed the inclusion and exclusion criteria for this study and 716 patients were matched to controls (figure 1). A total of 32 865 local residents were included in the pool of potential controls (leading to 763 858 observations after assigning multiple index dates).

Selection of telehealth patients for analysis.
Before matching, telehealth patients had higher average predictive risk scores than potential controls (0.33 vs 0.22) and more emergency admissions in the previous year on average (1.34 vs 0.77 per patient) (table 1). After matching, the controls had similar characteristics to the telehealth patients (table 1). For example, both groups had an average predictive risk score of 0.33. All standardised differences were below the targeted 10% threshold, except for the number of elective admissions in the month prior to enrolment, for which the standardised difference was 14.0%.
Comparisons of hospital utilisation and mortality
Patients were followed up for an average of 10.4 months for the primary endpoint (618.8 person-years) (table 2). During this period, telehealth patients were at higher risk of an emergency admission or death than matched controls, with 68.5% of telehealth patients experiencing an emergency admission or death (95% CI 62.3% to 75.4%), compared with 50.1% of matched controls (95% CI 45.1% to 55.7%) (table 2). Cox regression confirmed this difference as statistically significant, with an adjusted HR of 1.34 (95% CI 1.16 to 1.56), p<0.001).
Results of the Cox regression
Of the other secondary endpoints, there was evidence of a higher risk of (figure 2):
Emergency admission (adjusted HR 1.40, 95% CI 1.20 to 1.64, p<0.001);
Admission for an ambulatory care-sensitive condition (adjusted HR 1.58, 95% CI 1.31 to 1.90, p<0.001);
Outpatient attendance (adjusted HR 1.25, 95% CI 1.11 to 1.40, p<0.001);
Emergency department visit (adjusted HR 1.29, 95% CI 1.10 to 1.51, p=0.002);
Admission for a non-ambulatory sensitive condition (adjusted HR 1.26, 95% CI 1.04 to 1.52, p=0.021).

Kaplan-Meier curves for primary and secondary endpoints (n=716 telehealth patients; 716 matched controls) (ACS, ambulatory care sensitive; OP, outpatient).
Mortality risk was not significantly different between telehealth and matched control groups (adjusted HR 1.17, 95% CI 0.81 to 1.69, p=0.404).
Sensitivity analysis for unobserved confounding
The difference-in-difference analysis showed a trend towards more emergency admissions among intervention patients than controls, but the effect size was smaller than in the primary analysis and did not reach statistical significance (difference 0.10 admissions per head, 95% CI −0.06 to 0.26, p=0.220) (see online supplementary table S1 and figures S1 and S2).
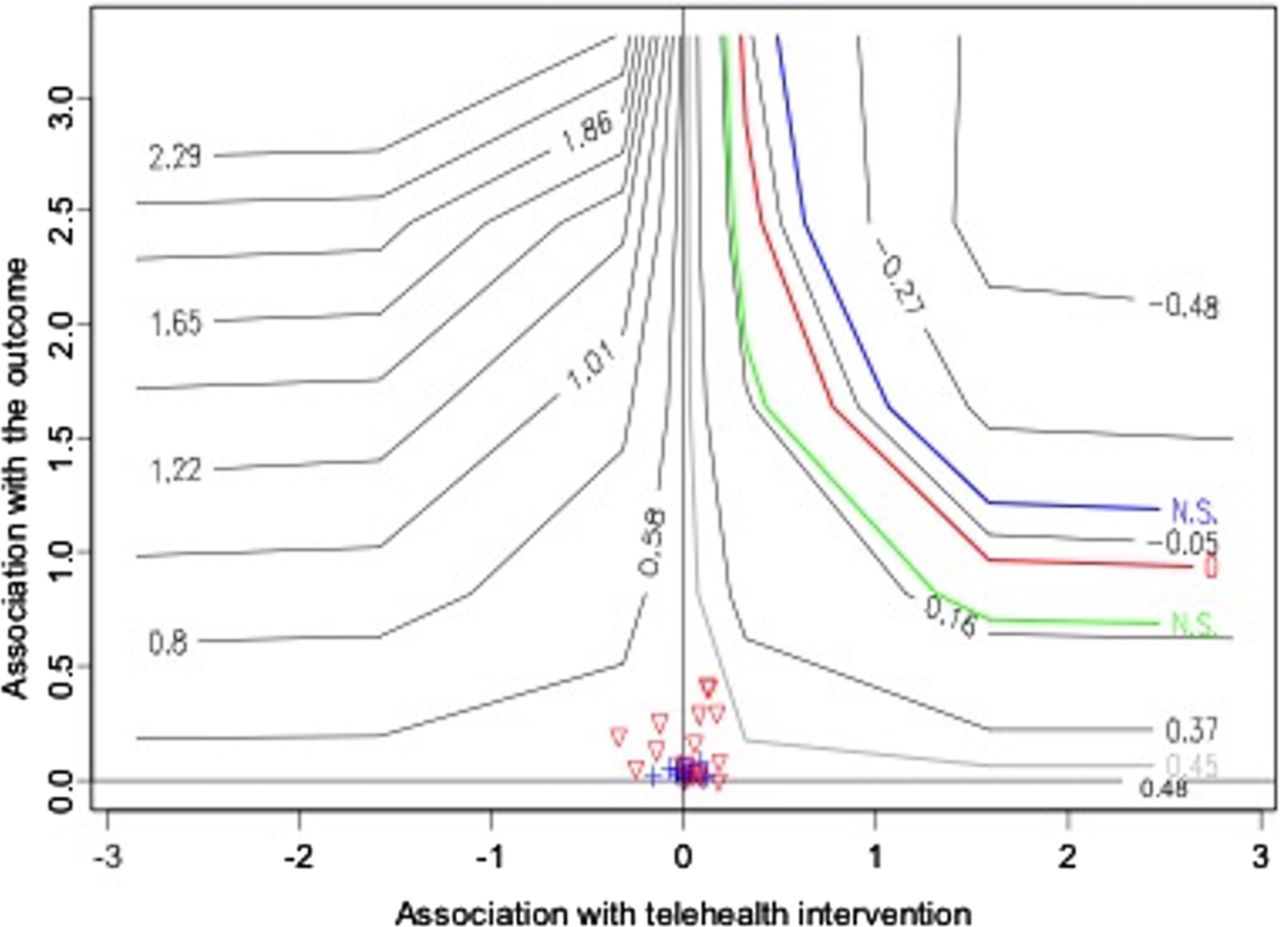
Figure 3 shows the results of the sensitivity analysis that simulated an unobserved confounder. In this figure, the blue line shows the amount of confounding that would have had to occur to obscure a statistically significant reduction in emergency admissions. The green line shows the amount of confounding needed to explain our finding that patients receiving telehealth were associated with significantly more emergency admissions than were controls. While we cannot measure unobserved variables, we did have data on several observed variables (such as age) and plot these on the figure as crosses and triangles. As can be seen, these observed variables are clustered well below the blue and green contours. This suggests that, for our findings to have been significantly biased by an unobserved confounder, this confounder would have to be much more strongly associated with intervention status and outcome than seems reasonable, given the variables we observed.

Sensitivity analysis for the effect of unobserved confounding. The two parameters in this analysis are the association between a baseline variable and (log-transformed) time to emergency hospital admission or death (vertical axis), and the association between a baseline variable and selection into the telehealth intervention (horizontal axis). These parameters are known for baseline variables that were observed, and are shown by the crosses and triangles (the triangles indicate the observed baseline variables that had negative associations; these have been transformed to positive values by multiplying by −1). The various contours show the effect of hypothetical unobserved baseline variables. The green line represents the maximum amount of unobserved confounding that can be tolerated for our conclusions that telehealth reduced the time to emergency admission or death to remain statistically significant. The blue line describes those parameters resulting in a statistically significant finding in the opposite direction (ie, an increase in the time to emergency admission or death), while the red curve describes the parameter values for which the estimated effect of telehealth is zero. The degree of confounding required for any of these situations can be compared with that indicated by the observed baseline variables. The light grey contour represents the estimate of the observed confounder furthest from the origin, that is, the strongest effect of any observed confounder. In order to show a beneficial effect of the telehealth intervention, an unobserved variable would need to be more strongly associated with both the intervention and outcome than any observed variable, which includes strongly prognostic variables such as age and gender.
Discussion
Statement of findings
We compared a sample of patients enrolled in a large telehealth programme in a predominately rural area in England to a well-balanced matched control group using person-level data. We found that, contrary to the aims of the programme, telehealth patients had a higher likelihood of an emergency admission, and accident and emergency department attendance, than matched controls. The secondary analysis showed that, while unobserved confounding might explain some of the increase in emergency admissions, it is unlikely that we missed reductions in these admissions.
Strengths and weaknesses of this study
We were able to link administrative data to the vast majority (95%) of telehealth patients who passed the inclusion and exclusion criteria for the study. A small proportion of patients could not be linked due to incorrect or missing personal identifiers but, on the assumption that these data were missing at random, our sample was representative of the population that received telehealth in routine practice. While we focused on those patients with previous inpatient admissions, this constituted all but a small minority (3.6%) of total referrals. We standardised our comparisons by restricting them to those patients with a record of chronic obstructive pulmonary disease, congestive heart failure or diabetes. This meant that we excluded 22.4% of referrals.
The administrative data sets used have advantages, such as minimising the issue of misreporting of service use by patients.34 Further, we were able to construct complete histories of hospital care utilisation over several years, even if patients moved to other parts of England. However, the data quality was not directly under our control.35 Potential problems with administrative data include inaccurate reporting due to inconsistent coding practices across hospitals,34 although this was mitigated by the use of local control patients and by combining diagnostic fields over several years. Although administrative data provide only limited insight into the quality and appropriateness of care, we were able to examine admissions for ambulatory sensitive conditions.17 ,18 As these conditions are considered manageable in primary care, we would have hoped that telehealth would reduce them, but instead we observed a pattern that was consistent with our overall findings of increased utilisation.
Telehealth and control patients were matched such that they were similar at baseline in respect to established predictors of hospital use. However, as in any observational study of this type, we cannot entirely rule out the possibility that the groups at baseline differed in terms of variables that were also predictive of the outcome. Our study was designed to minimise the risk of confounding by: applying similar eligibility criteria for telehealth and control groups; selecting controls locally from within the North Yorkshire area15; using a matching algorithm that achieved very good balance between the study and control groups on observed variables; and performing regressions to adjust for any residual imbalances on observed variables after matching. However, there are limits to the amount of information recorded in the administrative data. For example, it is possible that telehealth patients systematically had more severe conditions than matched controls, or different attitudes towards managing their conditions or using emergency care (though these characteristics are correlated with variables that we were able to include in the matching algorithm, such as prior planned and unplanned hospital utilisation).36
Our secondary analyses showed that, while it is conceivable that the increases detected in emergency admissions were due to confounding, it is very unlikely that we missed reductions in these admissions. First, we observed similar mortality rates between intervention and matched control groups, which supports the notion that the groups were similar in terms of disease severity. Comparisons of endpoints that are unlikely to have been affected by the intervention have been recommended as a way to detect a lack of comparability in observational studies,37 and it is reassuring that no differences were found in mortality rates in the current study. Second, our difference-in-difference analysis, likewise, found a trend towards increased emergency hospital admissions among telehealth patients. This did not reach statistical significance at the 5% level, but the difference-in-difference analysis had lower statistical power than our primary analysis, since it was applied to a subgroup of patients (n=672/716) and examined hospital admissions over 6 months, rather than the average of 10.4 months per patient in the primary analysis. Finally, we performed a more sophisticated sensitivity analysis that directly simulated the impact of a theoretical unobserved confounder. This analysis quantified the level of confounding that would be needed to render our finding of increased hospital admissions not statistically significant—this seemed implausible, given the associations found for observed variables such as patient age.
Compared with many randomised controlled trials in this area, the current study has the advantage of reflecting telehealth as delivered in routine clinical practice. Randomised designs can prevent the adaption of telehealth services in response to learning,38 but we, in contrast, reflected decisions about services that were made by local teams. The retrospective nature of the study also meant that we could not have inadvertently influenced outcomes, such as can happen in prospective studies through the Hawthorne effect.39
It is possible that effects would have been observed over longer time periods than was possible in this study, or that there may have been effects on other endpoints not considered in this study, such as use of primary care, quality of life, or the control of glycated haemoglobin or blood pressure in patients with diabetes.40 Telehealth might have had a greater effect on individuals with certain conditions or those recruited from certain settings, although our post hoc subgroup analysis (see online supplementary material) did not uncover any evidence for this.
Comparison with other studies and possible explanations
Our findings are consistent with several large randomised controlled trials that have reported ambiguous or negative effects of telehealth.4–6 However, the large-scale care coordination/telehealth programme administered by the US Veterans Health Administration (VHA) has reported reductions in admissions. Although an early study of the impact of the VHA programme was uncontrolled,41 a subsequent study has reported similar findings against a matched control group.13 The VHA programme is a highly integrated intervention with a care coordination component in a setting marked by a strong investment in electronic patient records. Results from the VHA may affirm that the ultimate effectiveness of telehealth depends on the context, targeting and integration of the supporting environment.
There are a number of possible explanations for why telehealth was associated with higher rates, or at least not reduced rates, of emergency admission than usual care in this study. First, patients might not have adhered to the recommended monitoring schedule. We found that patients provided readings on 62% of days during the programme. Second, the alerts made to monitoring teams might not have been sufficiently predictive of deteriorations in health, or might not have given the monitoring clinicians sufficient opportunity to deliver effective preventive care.42 Third, more intensive monitoring might have increased patient awareness of risks to their health or could have led to the identification of additional health needs. Fourth, telehealth might not have been fully integrated into the wider healthcare system, such that problems were escalated to secondary care, rather than treated in the community. NHS North Yorkshire and York intended to redesign care pathways for patients supported by the provision of telehealth. While some progress was made, it was beyond the scope of our study to assess whether the new pathways had evolved to an effective level by the time of the dissolution of the telehealth programme.
Conclusions
The North Yorkshire telehealth programme did not reduce emergency hospital admissions and, indeed, may have led to increases, though there may have been improvements in outcomes not analysed during the current study (including quality of life). Decision makers must consider whether to use scarce resources by investing in other forms of preventive care, for which there is more of an evidence base, or whether to pursue telehealth on the assumption that the benefits from these new technologies can take some time to materialise. Telehealth is an example of a ‘complex intervention’,37 in that there are several interacting components that aim to achieve multiple outcomes through a variety of means. Thus, the effect of telehealth might depend on the surrounding context (including level of integration and financial incentives); how the telehealth service is designed (such as the choice of peripheral devices, algorithm and monitoring system); and how users and professionals engage with telehealth. We could not rule out the possibility that beneficial outcomes might have, with more time and refinement, materialised in North Yorkshire.
If telehealth is pursued, it may be desirable to create information systems to enable these services to respond to learning and to seek to improve their effectiveness over time. The methods used in this study, including linkage to administrative data, selection of matched control groups and sensitivity analysis, could be adapted to enable effectiveness to be tracked in close to real time.
Acknowledgments
The authors would like to thank Tunstall Healthcare Ltd, for organising the data on telehealth participants; staff of the former NHS Yorkshire and York Primary Care Trust, for their assistance during the study; and the NHS Information Centre for health and social care, for providing invaluable support and acting as a trusted third party for the linkage to national hospital data. Analyses were performed using SAS V.9.3 (SAS Institute, Raleigh, North Carolina, USA) and R V.2.15 (http://www.r-project.org).
References
Supplementary materials
Supplementary Data
This web only file has been produced by the BMJ Publishing Group from an electronic file supplied by the author(s) and has not been edited for content.
- Data supplement 1 - Online supplement
Footnotes
Contributors AS and MB designed the study. AS and CA performed the analysis, and prepared the draft manuscript. EF liaised with the programme, about participant data, and organised the data linkage. All the authors reviewed the manuscript. AS was the study guarantor and confirms that this paper is an accurate representation of the study findings. The named authors conducted this study independently of Tunstall and NHS North Yorkshire and York; the authors were solely responsible for the decision to submit this manuscript for publication.
Funding The study was funded by the Technology Strategy Board under the Model for Optimising Saleable Telehealth (MOST) grant (TP No: 2904-25255).
Competing interests None declared.
Provenance and peer review Not commissioned; externally peer reviewed.
Data sharing statement No additional data are available.