Article Text

Abstract
Objectives Over the past 10 years, the burden of chronic diseases in Korea has increased. However, there are currently no quantitative estimates of how changes in diet and metabolic factors have contributed to these shifting burdens. This study aims to evaluate the contributions of dietary and metabolic risk factors to death from cardiometabolic diseases (CMDs) such as cardiovascular conditions, strokes and diabetes in Korea, and to estimate how these contributions have changed over the past 10 years (1998–2011).
Design and methods We used data on 6 dietary and 4 metabolic risk factors by sex, age and year from the Korea National Health and Nutrition Examination Survey. The relative risks for the effects of the risk factors on CMD mortality were obtained from meta-analyses. The population-attributable fraction attributable to the risk factors was calculated by using a comparative risk assessment approach across sex and age strata (males and females, age groups 25–34, 35–44, 45–54, 55–64, 65–74 and 75+ years) from 1998 to 2011.
Results The results showed that a suboptimal diet and high blood pressure were the main risk factors for CMD mortality in Korea. High blood pressure accounted for 127 096 (95% uncertainty interval (UI): 121 907 to 132 218) deaths from CMD. Among the individual dietary risk factors, a high intake of sodium (42 387 deaths; 95% UI: 42 387 to 65 094) and a low intake of fruit (50 244 deaths; 95% UI: 40 981 to 59 178) and whole grains (54 248 deaths; 95% UI: 47 020 to 61 343) were responsible for the highest number of CMD deaths in Korea.
Conclusions Indicating the relative importance of risk factors in Korea, the results suggest that metabolic and dietary risk factors were major contributors to CMD mortality.
- burden of disease
- dietary risk
- metabolic risk
- cardiometabolic disease
- cardiovascular disease
This is an Open Access article distributed in accordance with the Creative Commons Attribution Non Commercial (CC BY-NC 4.0) license, which permits others to distribute, remix, adapt, build upon this work non-commercially, and license their derivative works on different terms, provided the original work is properly cited and the use is non-commercial. See: http://creativecommons.org/licenses/by-nc/4.0/
Statistics from Altmetric.com
Strengths and limitations of this study
This is the first investigation to analyse data from a national survey based on data from individuals to evaluate the changing diet in Korea.
This study estimates the impact of dietary and metabolic risk factors on cardiometabolic diseases (CMDs) in Korea using data on risk factor–disease relationships, as well as several years of data from the nationally representative Korean National Health and Nutrition Examination Survey (KNHANES).
This study identifies national priorities for improving diet and reducing cardiometabolic risk factors to improve CMD health in Korea.
This analysis was based on a limited number of dietary factors assessed in KNHANES.
Introduction
Along with rapid socioeconomic changes, cardiometabolic diseases (CMDs) including cardiovascular disease (CVD) and diabetes mellitus (DM) are the leading cause of mortality worldwide, accounting for 38 million deaths annually.1 Consistent with the global trend, the burden of CMDs has dramatically increased in Korea.2 ,3 According to data from Statistics Korea, more than 45% of deaths in Korea are caused by non-communicable diseases such as CVD and DM.4
The increased prevalence of suboptimal lifestyles and metabolic risk factors are important modifiable risk factors for CMDs.5–7 A previous global burden of disease (GBD) study reported that the global and regional burdens of chronic diseases were attributable to many risk factors and advocated systematic assessment of the multiple dietary risk factors for CMD using comparative risk assessment (CRA).8 There have been previous efforts to estimate the contributions of selected dietary and metabolic risk factors based on national estimates from various regions using the CRA approach.9–12 However, most of the current estimates of dietary risk factors have focused on Western countries, making it hard to identify population-specific effects. So far, in Asian countries only one study has examined the burden of disease in a Chinese population and emphasised the necessity of nation-specific estimates for chronic diseases to reflect region-specific changes in health and the need for surveillance systems.13
Similarly, the burden of disease in Korea shows unique characteristics, based on the nation's distinctive epidemiological and sociocultural contexts.2 Korea has experienced rapid sociocultural change, including swift economic growth, and continuous Westernisation, which has been accompanied by an ageing society, a decline in physical activity, an increase in energy intake and an increase in body weight.2 ,14 In addition, Korea has a unique diet characterised by a higher level of refined carbohydrates and pickled vegetables than Western and other Asian countries.15 Consequently, it is necessary to characterise and estimate the effects of dietary risk factors on mortality from chronic disease in the Korea population. However, it is hard to obtain an accurate estimation of the effects of dietary and metabolic risk factors on CMDs in Korea. Quantitative estimates of the changes in the burden of CMDs caused by dietary and metabolic factors could provide a better understanding of the ways alterations in diet have contributed to these shifting burdens.
The aim of the current study was to evaluate the contributions of dietary and metabolic risk factors to chronic diseases such as CVD, stroke and DM in Korea. We also aimed to estimate how these contributions have changed over the past 10 years (1998–2011).
Methods
We conducted a population-level CRA analysis of six dietary and four metabolic risk factors in order to estimate the number of deaths from chronic diseases in Korea. Detailed information on CRA is available elsewhere.8 Briefly, using CRA, we estimated the number of deaths that would have been prevented during the period of analysis if the current distribution of exposure to each risk factor had been changed to a hypothetical alternative distribution.
Selection of risk factors
Dietary and metabolic risk factors in this analysis were selected based on the following criteria, as described previously:10 ,16 (1) there was probable or convincing evidence that the risk factors affected CVD, strokes or DM and (2) data from a national health and nutrition survey in Korea were available. The dietary risk factors included low intakes of fruit, vegetables and whole grains, and high intakes of processed meats, unprocessed meats (red meats) and sodium (table 1). The metabolic risk factors included high fasting plasma glucose (FPG), total cholesterol (TC), systolic blood pressure (SBP) and body mass index (BMI).
Data sources for age, sex and year-specific estimates of dietary intakes, metabolic risk factor exposure levels, optimal risk factor distributions, aetiological effects of risk factors on disease, and disease-specific mortality
Data sources
The exposure distribution for each risk factor was obtained from the Korea National Health and Nutrition Examination Survey (KNHANES). The relative risk (RR) for each risk factor and disease was collected from published systematic reviews and meta-analyses of epidemiological studies,16–24 ,26 ,27 and the number of deaths by specific cause was obtained from the Korean Statistical Information Service (KOSIS).
Dietary risk factors
The dietary risk factors were obtained from KNHANES, a nationwide cross-sectional survey conducted annually since 1998 by the Ministry of Health and Welfare. Details on KNHANES are available elsewhere.28 Briefly, the data for KNHANES are collected using a health interview, a health examination and a nutrition survey. A nationally representative sample was chosen among the Korean population using household records provided by the Korean Population and Housing Census. Twenty households from each survey section were selected using a stratified, multistage probability cluster sampling method that considered each participant's geographical area, age and sex. We used five KNHANES surveys (1998–2011) to estimate the transitional effect over the years. Data on 63 items from the KNHANES food frequency questionnaire (FFQ) were used to assess intake of each dietary factor. The FFQ evaluated how often the subjects had consumed each particular food over the previous 12 months on a 10-point scale (9=3 times per day, 8=twice per day, 7=once per day, 6=4–6 times per week, 5=2–3 times per week, 4=once per week, 3=2–3 times per month, 2=once per month, 1=6–11 times per year, and 0=almost never). The scores were converted into the daily consumed amount by multiplying the serving size according to Korea Rural Development Administration (KRDA) guidelines.29 The mean and SD of the intake of each dietary factor by sex, age and year were estimated using the residual method after adjusting for total energy intake.30 To obtain the national distribution of dietary risks, we limited analysis to KNHANES participants who had no missing data in the nutrition survey. Participants with implausible data and a value 3 SD above or below the mean were also excluded. Subjects who consumed rice less than once a day on a regular basis were excluded as having implausible diets, perhaps due to a recording or data entry error, given that rice is a staple food in Korea and rarely consumed less than once a day.31 ,32 After exclusion, the total sample size in KNHANES 1998–2011 ranged from 41 810 for fruit intake to 42 524 for whole grain intake (see online supplementary table S1).
supplementary data
Metabolic risk factors
Levels of metabolic risk factors were also obtained from KNHANES. Anthropometric measurements were acquired by trained experts who followed standard protocols.28 The body weights and heights of the subjects were measured to the nearest 0.1 kg and 0.1 cm, respectively. BMI was calculated as weight (kg)/height squared (m2). Systolic blood pressure (SBP) was measured three times with a mercury sphygmomanometer (Baumanometer, New York, New York, USA) applied to the right arm in the sitting position and the average calculated. To assess serum levels of biochemical markers, blood samples were collected from an antecubital vein after 10–12 hours of fasting. FPG (mmol/L) and TC (mmol/L) were measured using a Hitachi Automatic Analyzer 7600 (Hitachi, Tokyo, Japan). To obtain the national distribution of dietary risks, we limited analysis to those participants in KNHANES who had no missing data in the nutrition survey. Participants with implausible data and a value 3 SD above or below the mean were also excluded. To obtain the distribution of each risk factor, we used approximately 45 000 subjects (ranging from 44 387 for FPG to 46 297 for BMI) who met the described criteria (see online supplementary table S1).
Aetiological effects of risk factors on disease-specific mortality
Each risk factor and disease was paired according to established evidence (table 1).5 ,25 To calculate the population attributable fraction (PAF) and uncertainty, we obtained the RR of CVD, stroke and diabetes mortality (or incidence) per unit of exposure from the most recent systematic reviews, meta-analyses of randomised controlled trials and observational studies, in conjunction with population exposure data from KNHANES, and theoretical minimum-risk exposure distribution (TMRED) values from the GBD study.16 ,24 For risk factors–disease pairs not examined in recently published papers, we conducted de novo meta-analysis following a previous study.16 The aetiological effects of risk factors were adjusted for potential confounders such as age, sex, education, socioeconomic status, physical activity, smoking and alcohol use. The details are provided elsewhere.12
Theoretical minimum-risk distributions
To measure the mortality effects of different levels of exposure for all populations according to dietary risk factors in order to allow for comparison, we used an alternative optimal exposure level (table 1). This is known as TMRED, which is based on epidemiological studies or the levels observed in low-exposure populations. TMRED values were obtained from the literature.16 ,25 The TMRED for risk factors with protective effects was defined as the intake levels at which they had beneficial effects (eg, a high intake of fruit, vegetables and whole grains). The standard optimal intake for protective factors was based on levels observed in populations with a high intake. For dietary risk factors and metabolic risk factors with harmful effects (eg, a high intake of processed or unprocessed meats, and sodium, and high FPG, SBP, BMI and TC), the optimal level was obtained from the exposure levels associated with the lowest level of harm. The TMREDs were zero for risk factors for where zero exposure led to minimum risk (eg, processed meats) that observed in some population subgroups around the world.
Disease-specific deaths
The number of disease-specific deaths by sex, age and year was obtained from KOSIS, which provides official statistics for Korea. KOSIS provided data on mortality from 235 causes between 1998 and 2011. The causes of mortality were coded according to the International Classification of Diseases. In the present study, we used the mortality data for deaths attributable to DM (E10–E14), ischaemic heart disease (IHD, I20–I25), ischaemic stroke (I63, I67), haemorrhagic stroke (I60–I62), aortic aneurysm and dissection (I71), hypertensive heart disease ( I11) and rheumatic heart disease (I00–I09). The number of cause-specific deaths over the years was aggregated by sex and age group.
Statistical analyses
Estimation of temporal differences across years
To identify the overall temporal pattern of each risk factor and PAF from 1998 to 2011, a non-parametric trend test was conducted at a significance level of 0.05. A conventional parametric approach to a trend test is one based on a linear regression model. However, the results of an exploratory data analysis suggested that the empirical distributions of a given risk factor varied dramatically across years, so it was likely that the assumptions underlying a linear regression model did not hold. The non-parametric trend test of Cuzick33 was employed as an alternative approach and is an extended version of the Wilcoxon rank-sum test to compare mean values among groups of interest. All analyses were conducted using Stata 12.0 and R v.3.2.2.
Estimation of deaths attributable to risk factors
We calculated the PAF for each continuous risk factor with the following equation: where
where  is the level of exposure and m is the maximum exposure level. P(
 ) represents the actual distribution of the exposure in the population, while P′(
 ) is the optimal level of exposure distribution. RR(
 ) is the RR of mortality at exposure level
  .
.
The PAF estimates the proportional reduction in disease-specific deaths that would occur if exposure to the risk factor was at the optimal level. We calculated the number of deaths from IHD, ischaemic stroke, haemorrhagic stroke, DM and CVD attributable to causally related risk factors by multiplying their PAF by the total specific mortality. We conducted all analyses separately by sex, age group (25–34, 35–44, 45–54, 55–64, 65–74 and 75+ years) and year (1998, 2001, 2005, 2007, 2008, 2009, 2010, 2011). We restricted the analyses to participants aged ≥25 years as data on risk factors and mortality data were limited.
Estimation of uncertainty and sensitivity analysis
We calculated the uncertainty of attributable mortality caused by sampling variability. To quantify the uncertainty for attributable deaths, we applied a second order Monte Carlo simulation to each risk factor. Briefly, this simulation approach combines the uncertainties of the exposure distributions and the RRs in each age–sex group. We generated 1 000 draws from the exposure distribution for each age–sex group as characterised by its mean and SE (which was assumed to be normal). Independently of the exposure, we drew 1 000 times the log-normal distribution of the RR for each risk factor on the disease outcomes. Those draws were used to generate 1 000 mortality estimates for each age–sex group, and they reported 95% of the uncertainty intervals (UIs) based on the resulting distributions of the 1 000 estimated attributable deaths. Sensitivity analysis was performed to choose the optimal level of each risk factor.
Results
Distribution of dietary and metabolic risk factors by sex, age and year
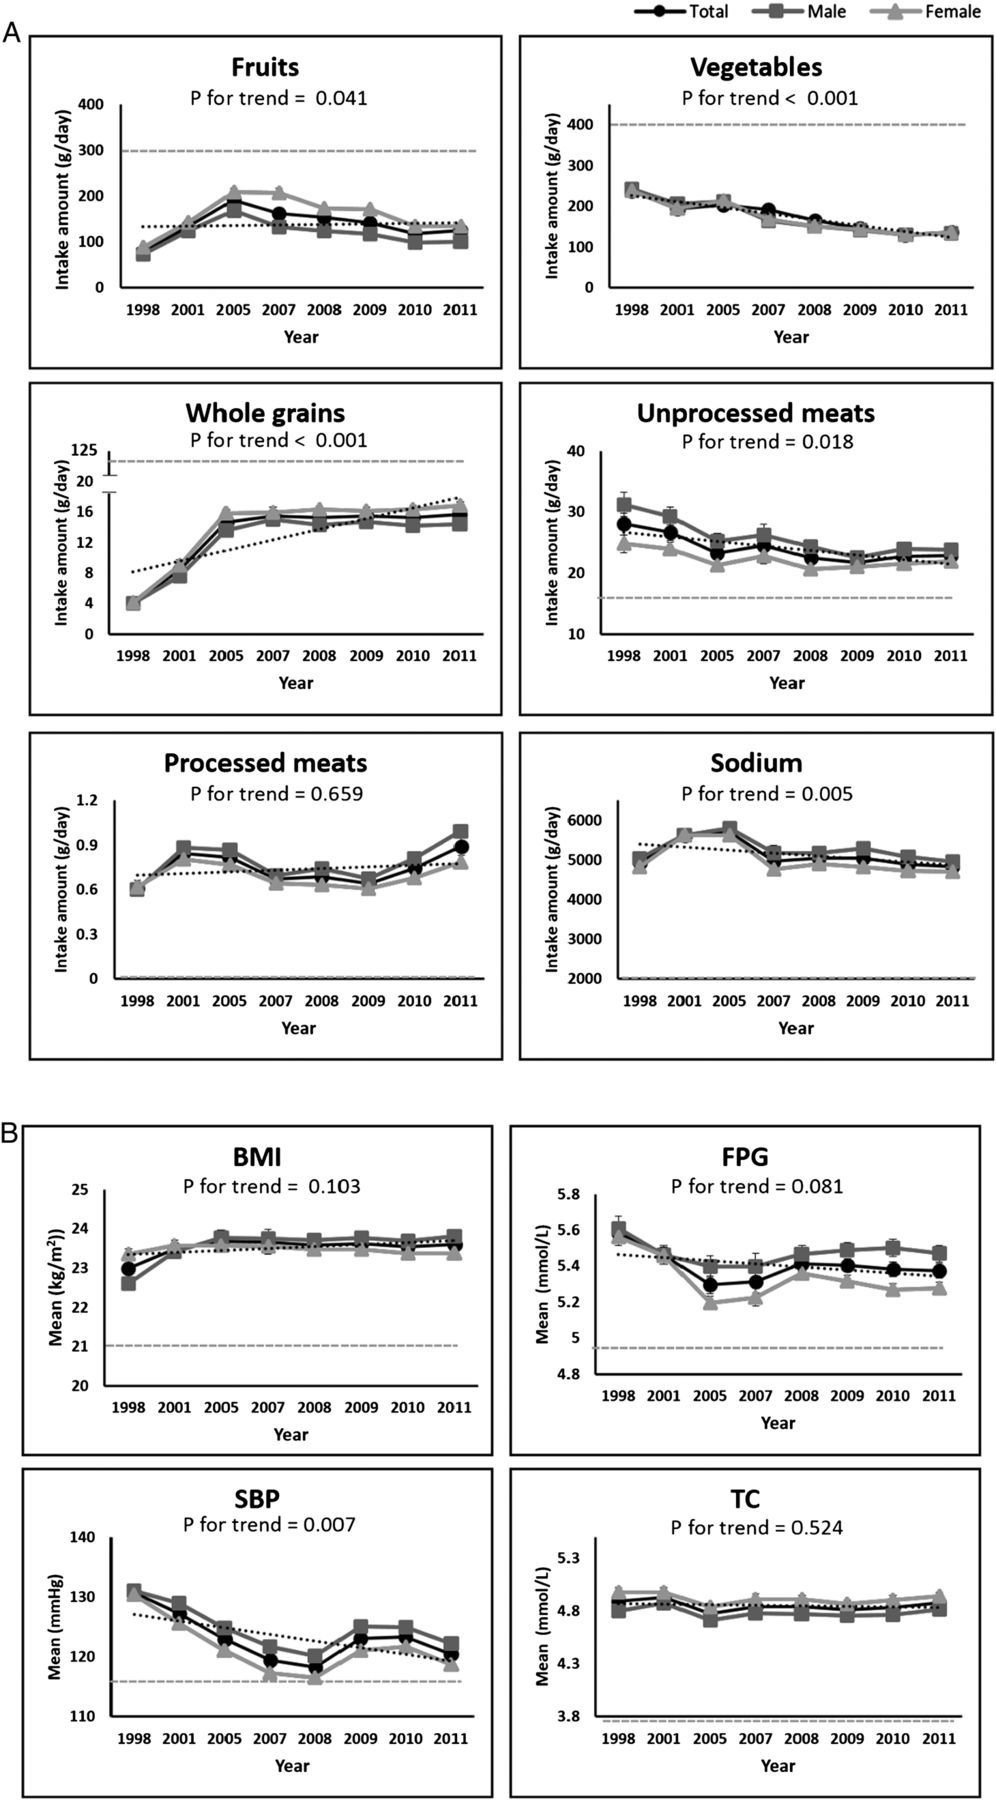
Across the period of analysis (1998–2011), all dietary risk factors in Korea showed non-optimal levels. The national intakes of protective dietary factors (fruits, vegetables and whole grains) were lower than the TMRED, while the intakes of harmful dietary factors (processed meats, unprocessed meats and sodium) were higher than the TMRED. As shown in figure 1, among protective dietary factors, intake of fruit and whole grains increased by 60% from 78.1±2.9 g/day in 1998 to 125.3±5.4 g/day in 2011 and by 120% from 4.4±0.3 g/day in 1998 to 9.64±0.6 g/day in 2011, respectively, while intake of vegetables decreased by 43% (from 238.2±6.0 g/day to 136.5±4.7 g/day). Among harmful dietary factors, the consumption of processed meats and red meats increased by 69% (from 1.8±0.1 g/day to 3.0±0.2 g/day) and 11% (from 34.7±1.2 g/day to 38.4±1.8 g/day), respectively, while consumption of sodium decreased by 2% (from 4929.2±163.8 g/day to 4830.2±118.2 mg/day). Between 1998 and 2011, the intake patterns for all dietary risk factors were similar between men and women, except for fruit and whole grains (figure 1). During the studied period, the consumption of fruit and whole grains was consistently higher in women than in men, while other dietary risk factors were lower in women than in men (figure 1).

Trends in (A) diet and (B) metabolic risk factors in Korea from 1998 to 2011. Each plot and error bar indicate intake mean and SE, respectively. A squared dashed line indicates the optimal level for each risk factor. A dotted line indicates the trend of risk distribution across years. p Values were derived from non-parametric trend tests (p<0.05). BMI, body mass index; PFG, plasma fasting glucose; SBP, systolic blood pressure; TC, total cholesterol.
Between 1998 and 2011, metabolic risk factors in Korea on average were above optimal levels. The distribution of metabolic risk factors in the total population varied little by year. Among the metabolic risk factors, BMI and TC increased by 5% (from 23.0±0.1 kg/m2 to 23.6±0.1 kg/m2) and 3% (from 4.89±0.04 mmol/L to 4.88±0.04 mmol/L), respectively, whereas FPG and SBP decreased by 5% (from 5.6±0.1 mmol/L to 5.4±0.0 mmol/L) and 6% (from 130.7±1.0 mm Hg to 120.5±0.7 mm Hg), respectively (figure 1). Between 1998 and 2011, BMI, FPG, SBP and TC levels increased with age in women, while BMI and TC showed a decreasing trend in elderly men (see online supplementary figures S1 and S2). Younger women showed more favourable levels of all metabolic risk factors than men. For example, women aged 25–34 years had optimal SBP levels across the years (ranging from 101.5±0.4 mm Hg to 112.6±0.3 mm Hg). Similarly, younger men had more favourable levels of metabolic risk factors than older men.
CVD, stroke and DM mortality by age, sex and year
Over the period of analysis (1998–2011), CVD, stroke and DM were responsible for 259 203 deaths in men and 316 479 deaths in women (for a total of 575 682 deaths) in Korea (see online supplementary table S2). Deaths from chronic diseases showed a dramatic increase between 1998 and 2007, followed by a slight decrease after 2008. Deaths from CMD increased over the analysis period, except for haemorrhagic stroke. Elderly women showed a higher mortality from diseases than men across the years.
CVD, stroke and DM mortality attributable to dietary risk factors by year
Between 1998 and 2011, low intakes of fruit and whole grains and high intakes of sodium were the leading dietary risk factors for chronic disease mortality in Korea (figure 2). The ranking of dietary risk factors varied over the years. Low fruit intake was the leading dietary risk factor for CMD mortality in 1998, accounting for 6 835 CMD deaths (95% UI: 5 794 to 7 757), but its effects showed a decreasing trend thereafter. After 1998, low intake of whole grains became the leading dietary risk factor for CMD mortality, which was responsible for 54 248 deaths (95% UI: 40 981 to 59 178) during the study period. A high sodium intake was responsible for the largest number of CMD deaths from 2001 to 2007 (9 888 deaths (95% UI: 8 165 to 11 341) in 2001 and 9 172 deaths (95% UI: 6 866 to 11 213) in 2007, respectively). The risk due to a high intake of sodium showed a slightly decreasing pattern. Although it was not ranked as the highest risk dietary factor, the risk from a low intake of vegetables also showed an increasing pattern over the years (from 2 291 deaths (95% UI: 1 726 to 2 868) in 1998 to 4 072 deaths (95% UI: 2 927 to 5 144) in 2011; table 2). The high intake of meat had almost no effects on Koreans during the period.
Number of cardiometabolic mortality attributable to each risk factor from 1998 to 2011 with 95% uncertainty intervals

Mortality from cardiometabolic disease attributable to individual dietary and metabolic risk factors, by disease and year in Korea. Data are shown for all adults. See table 2 for actual values of risk factor attributable deaths and 95% uncertainty intervals. Note that the number of deaths attributable to individual risk factors cannot be included because of multi-causality and mediated effects. BMI, body mass index; DM, diabetes; HSTK, haemorrhagic stroke; IHD, ischaemic heart disease; ISTK, ischaemic stroke; PFG, plasma fasting glucose; SBP, systolic blood pressure; TC, total cholesterol; TSTK, total strokes; WG, whole grains.
CVD, stroke and DM mortality attributable to metabolic risk factors by year
With regard to metabolic risk factors, high levels of SBP stood out as the leading metabolic risk factor for CMD mortality over the years, being responsible for 127095.7 CMD deaths (95% UI: 121 907 to 132 218; figure 2). Although high SBP was the leading risk factor during the years, the contribution of blood pressure decreased over the period of analysis, falling from 15 469 deaths (95% UI: 15 124 to 15 813) in 1998 to 13 495 deaths (95% UI: 12 864 to 14 100) in 2011 (table 2). A non-optimal BMI was responsible for the second highest number of deaths over the period. High levels of TC and FPG had smaller effects than SBP and BMI during the analysis period (see online supplementary figure S3).
CVD, stroke and DM mortality attributable to dietary and metabolic risk factors by age and sex
The number of CMD deaths caused by dietary and metabolic risk factors increased with age, in line with the increase in the number of CMD deaths in the older age groups. However, the attributable fraction of these risk factors decreased with age (see online supplementary figures S4 and S5), particularly for dietary risk factors. Older age groups showed higher attributable fractions of metabolic risk factors such as SBP and FPG, while in participants aged 25–44 years, the highest proportion of CMD deaths was attributable to dietary risk factors and several metabolic risk factors, including BMI and TC. In the younger population, SBP and FPG showed no or little effect on CMD deaths, as younger men and women had optimal metabolic levels (see online supplementary figures S4 and S5). The proportion of CMD deaths caused by a low intake of fruit and whole grains and a high intake of sodium was greater among men than among women, while no noticeable difference was observed in deaths caused by other dietary risk factors (see online supplementary table S3). Deaths from CMD caused by metabolic risk factors were consistently higher among men than among women (see online supplementary table S3).
Sensitivity analysis
The results of the sensitivity analyses are given in online supplementary figure S6. The results showed that change in the optimal levels of SBP (from 115 to 110 mm Hg), FPG (from 5.3 to 4.9 mmol/L) and TC (from 4.0 to 3.8 mmol/L) increased the mortality attributable to each risk factor by 20–40% in 2010 and 2011. The change in optimal BMI levels from 23 to 21 kg/m2 results in more a than doubling in attributable mortality in both years.
Discussion
The present study evaluated and quantified the contribution of six dietary risk factors and four metabolic risk factors to CVD, stroke and DM mortality in Korea by age and sex from 1998 to 2011 using comparative risk assessment method. This study demonstrates the association between trends in risk factors and burden of disease. While confirming the importance of high blood pressure for CMD mortality, the results also showed that a suboptimal diet was the leading risk factor for CMD mortality in Korea from 1998 to 2011. This is consistent with an earlier GBD study reporting that a suboptimal diet is the leading risk factor for chronic disease in most regions of the world.5 ,25
This study demonstrates the effect of the increased prevalence of metabolic risk factors on CMD mortality in the Korean population. In accordance with the previous GBD study, high SBP was shown to be the leading risk factor, with high BMI as the second leading risk factor across the years.25 ,34 Although high SBP levels showed a decreasing trend, approximately 50% of strokes and 45% of IHD deaths were attributable to high blood pressure in Koreans, in agreement with the previous GBD study.35 The result for SBP is consistent with global and national blood pressure trends, including modestly lower SBP levels over the period of analysis (1998–2011).35–37 In contrast to blood pressure, the risk of high BMI increased over time in the Korean population. BMI levels rose globally, accompanying adverse obesity-related changes in metabolic conditions.3 Nearly 45% of the diabetes burden and 20% of the IHD burden are attributable to obesity in Korea.
Metabolic risk factors are associated with shorter life expectancy due to the increased possibility of developing CVD.10 ,11 Furthermore, metabolic risk factors may be mediators of other risk factors including changes in the diet and decreasing levels of physical activity.38 ,39 Effective interventions to reduce the burden of metabolic risk factors should be implemented.
After metabolic risk factors, we found that among individual dietary risk factors, high sodium intake and low intake of fruit and whole grains were responsible for the highest number of CMD deaths in Korea. Suboptimal dietary patterns were associated with substantial morbidity, mortality and medical costs.40 According to a previous study, dietary risk factors or risk factors strongly related to diet are expected to cause nearly 75% of all deaths and result in 60% of all disability-adjusted life years by 2020.5 ,41 The most noticeable feature of dietary risks in Korea was that the intakes of fruit, vegetables and whole grains were much lower than the levels recommended by the TMRED and WHO guidelines.1 ,42 The intake of sodium was also much higher than suggested by the guidelines. The causes of this problem might be nation-specific and multifaceted. Despite an increase in whole grain intake during the study period, the risk of a low intake of whole grain has increased and become the leading dietary risk factor for CMD since 1998. The low intake of whole grains and high intake of sodium in Korea is partly due to the country's dietary habits, which include the regular consumption of seasoned soup, salty fermented food and refined rice. Furthermore, our results indicate an increased risk of low fruit and vegetable intake between 1998 and 2011, which might reflect changes in lifestyle and factors linked to the economic transition in Korea, such as increased food prices.43 Along with adoption of a Westernised lifestyle, increased fast food consumption and a Westernised diet have also aggravated dietary problems. Moreover, the increased participation of women in the workforce has reduced the time available to prepare healthy food.31 These findings highlight the need for interventions to improve the accessibility and affordability of healthy foods to reduce CMD risks in Korea.
Our study clearly showed that the mortality burden of dietary risk factors in Korea had slightly increased since 1998, especially in the younger population. Between 1998 and 2011, the burden of CMD mortality attributable to sodium and SBP showed a decreasing trend, whereas mortality burdens associated with vegetables, whole grains and BMI showed an increasing trend. The shifting trends in the burden of CMDs in the Korean population may be due to socioeconomic changes such as rapid economic development and urbanisation. Korea has one of the world's fastest-growing economies, with rapid industrial change. Such sociocultural changes contribute to an unhealthy lifestyle, giving rise to dietary risks from the increased availability, affordability and consumption of unhealthy food.31 ,44 Additionally, changes in epidemiological trends, including decreased levels of metabolic risks and cardiovascular death rates in Korea, have also been attributed to changes in the magnitude of the burden of CMD risk.31 The findings from the current study highlight the importance of considering epidemiological transition when estimating population health.
In addition, we quantified the contribution of dietary risk factors (eg, sodium) to the burden of CMD deaths as mediated by metabolic risks (eg, SBP). For example, although high blood pressure has remained the leading risk factor in Korea, it is closely related to the consumption of sodium.22 The sodium intake in Korea is more than double the WHO dietary recommendation and increases the risk of hypertensive disease.37 ,45 The WHO issued a global call for salt management to reduce the prevalence of hypertension-related diseases in cost-effective ways. In line with the WHO recommendation, the Korean government has been running a low salt campaign since 200546 to achieve an overall reduction in the Korean population's salt intake. As the results have shown, the national sodium intake has reduced since 2005, resulting in a decrease in CVD deaths. This result suggests dietary risk factors may affect CMDs through their effects on metabolic risk factors, while disease-specific deaths are caused by multiple risk factors acting simultaneously. Moreover, the results support the theory that a suboptimal diet is affected by factors at the individual, community and national level.47
We also focused on understanding the comparative importance of the risk factors by age and sex over time. The results showed that the younger population was prone to more harmful dietary risks causing CMD deaths.48 A study of a Western population49 demonstrates that young adults have a higher intake of animal products and sugar-sweetened drinks. Due to their metabolic status, people under the age of 50 are affected more by their diet than the elderly. A longitudinal cohort study demonstrated that higher intakes of fruit and vegetables in young adulthood were responsible for lower odds of prevalent CVD.50 Additionally, high levels of exposure to dietary and metabolic risks were responsible for a large number of CMD deaths, particularly in men. A previous study reported that this gender difference was attributable both to biological differences51 and to differences in socioeconomic status and lifestyle, including health awareness and diet quality.51 ,52 The results suggest that political initiatives to prevent CMD mortality should be based on an understanding of age- and sex-specific effects.
Our analysis has several strengths. To our knowledge, this was the first investigation to analyse data from a national survey collecting data from individuals to evaluate diet and changes in diet over time in Korea. The results provide detailed results focusing on the nation-specific impacts of dietary and metabolic risk factors on CMDs to identify national priorities for the management and prevention of CMDs. Additionally, we used current aetiological effect sizes of diet–disease relationships. We used RRs from meta-analyses of observational studies adjusted for potential confounders such as age, sex, education, socioeconomic status, physical activity, smoking and alcohol use. We also accounted for uncertainty in current risk factor levels, the effects of the risk factors on CMD mortality, and current cause-specific mortality by age, sex and time, propagating this uncertainty into the final results.
Potential limitations should also be considered when interpreting our findings. The data on food amounts were based on the FFQ rather than the actual amount. Therefore, there is a possibility that intake amounts have been overestimated or underestimated. Nevertheless, the FFQ in KNHANES has substantial reproducibility and validity,53 and has been used to measure the long-term dietary pattern in a specific target population.54 Second, we could not distinguish fruit from fresh fruit and fruit juice or vegetables from pickled vegetables and fresh vegetables, as KNHANES did not investigate those items separately. To account for this, in the vegetable category, we excluded Korean cabbage (kimchi), which is the major source of pickled vegetables in the Korean diet. However, there is a possibility that vegetable intake was underestimated as the daily intake of kimchi in Korea represents 40–50% of the daily total vegetable intake of Koreans.55 Third, the latest data were excluded from the main results as KNHANES adopted different methods in later years. Fourth, although we used the confounder-adjusted RR, the possibility of residual confounding cannot be excluded. Sixth, the analysis of risk factors has focused on selected dietary and metabolic risk factors. Further study including behavioural risk factors such as alcohol use and smoking is required in the current population. Additionally, although a high sugar intake appears to increase risk for CMDs, this factor was excluded from analysis since KNHANES did not investigate consumption of sugar or sugar-sweetened drinks in detail. Seventh, we used generalised RRs from multiple ethnic groups including US, European and Asian populations, rather than Korean-specific RRs. However, using RRs that have been found to be generalisable across populations strengthens the analysis and allows comparison of the burdens estimated for Korea with those from other countries.
In summary, we found that both metabolic and dietary risk factors were major contributors to CMD mortality in Korea, and we investigated their relative importance over the years. Our findings highlight the need for the evaluation, adoption and implementation of dietary recommendations reflecting shifting trends for the prevention of CMDs in Korea. Moreover, the findings quantify the effects of major metabolic risk factors on CMDs. The results of the current study can contribute to the development of evidence-based national government policies to manage and improve the major risk factors for CMDs in Korea.
References
Footnotes
Contributors M-JS and GS conceived the study. M-JS acquired the data. YC, FC and GS developed the statistical analysis plan. YC and J-HP analysed the data. YC, GS and M-JS prepared the first draft of manuscript. YC, J-TL, DM, GS and M-JS contributed to the writing of the manuscript. All authors reviewed and approved the manuscript.
Funding This research was supported by the Basic Science Research Program through the National Research Foundation of Korea (NRF) funded by the Ministry of Education, Science and Technology (NRF-2015R1A2A1A15054758 to M-JS).
Competing interests None declared.
Provenance and peer review Not commissioned; externally peer reviewed.
Data sharing statement No additional data are available.