Article Text

Abstract
Objectives To estimate the prevalence of, and explore potential risk factors for, taste and smell dysfunction in the general population of the USA.
Design A cross-sectional study.
Setting A cross-sectional analysis of data collected in the National Health and Nutrition Examination Survey (NHANES 2013–2014).
Participants A total of 3519 men and women aged 40 years and older who participated in NHANES 2013–2014.
Main outcome measures Using the NHANES Pocket Smell Test, smell impairment was defined as failing to correctly identify 6 or more of the 8 odours. Taste impairment was defined as failing to correctly identify quinine or sodium chloride.
Results The estimated prevalence was 13.5% for smell impairment, 17.3% for taste impairment and 2.2% for taste and smell impairment. For smell, but not taste, prevalence estimates increased with age and were higher in men and ethnic minorities. In backward stepwise logistic regression, low educational attainment, low family income and a history of asthma or cancer were independently associated with a higher prevalence of smell impairment, whereas light-to-moderate alcohol consumption (1–3 drinks/day) was associated with a lower prevalence of this condition. After multivariate adjustment, being non-Hispanic Black Americans, consuming ≥4 drinks of alcohol per day and having a history of cardiovascular disease (CVD) were independently associated with a higher prevalence of taste impairment.
Conclusions Based on a nationally representative multistage probability survey among the US population aged 40 years and older, smell and taste dysfunction affected ∼20.5 million (13.5%) and 26.3 million (17.3%) individuals, respectively. Age, gender, ethnicity, educational attainment, family income, light-to-moderate alcohol consumption and history of asthma or cancer were significant risk factors for smell dysfunction, whereas only ethnicity, heavy alcohol consumption and CVD history were associated with a higher prevalence of taste dysfunction.
- Taste Impairment
- Smell Impairment
- Prevalence
- Risk factors
This is an Open Access article distributed in accordance with the Creative Commons Attribution Non Commercial (CC BY-NC 4.0) license, which permits others to distribute, remix, adapt, build upon this work non-commercially, and license their derivative works on different terms, provided the original work is properly cited and the use is non-commercial. See: http://creativecommons.org/licenses/by-nc/4.0/
Statistics from Altmetric.com
Strengths and limitations of this study
The present study provides a nation-representative estimates of the prevalence of taste and smell impairment among men and women aged 40 years and above in the US population.
This study demonstrates associations of age, gender, ethnicity, educational attainment, family income, alcohol consumption and history of asthma, cancer or cardiovascular disease with chemosensory disorders on a nationwide scale.
This is a cross-sectional study, which limits its ability to infer causal relationships between risk factors and taste and smell impairments.
Introduction
Smell and taste disorders pose a major threat to public health, significantly compromising quality of life, food preferences, nutritional status and safety from airborne toxins, fire, smoke, spoiled food and leaking natural gas.1–4 It is now well established that a disproportionate number of the elderly experience smell dysfunction that has direct consequences for health and safety.3 ,5 ,6 For example, in one longitudinal study of 1162 non-demented older persons, the mortality rate over a 4-year period was 45% for those with lowest baseline olfactory test scores, when compared with a rate of 18% in those with the highest test scores, even after controlling for age and other confounders.7
Although a large literature suggests that chemosensory disorders are relatively common,2 ,8–16 there remains a lack of consensus as to the prevalence of such disorders in population-based epidemiological studies.8 ,12 ,17–22 Previous studies attempting to address this issue have provided prevalence estimates ranging from 2.7% to 24.5% for smell dysfunction,8–11 ,13 ,17 ,19 ,20 and 0.6% to 20% for taste dysfunction.10 ,17 ,20 ,22 Such variation likely reflects differences in test methods, criteria for defining dysfunction and both sample sizes and sampling procedures, as well as variations in sex, age, health and ethnic composition of the sampled populations.
The relatively recent addition of olfactory and gustatory testing to the National Health and Nutrition Examination Survey (NHANES), a survey that focuses on representative samples of non-institutionalised persons from 15 counties or other geographic jurisdictions randomly selected within the USA each year, provides a unique opportunity to obtain sound nationwide estimates of prevalence of chemosensory dysfunction. An evaluation of the olfactory data collected during a single-year survey (2012) reported a 12.4% prevalence for smell dysfunction in the sampled population, although estimates of taste dysfunction were not presented.21 In the present study, based on a larger sample size from the NHANES 2013–2014 survey among US population aged 40 years and older, we aimed to estimate the prevalence of olfactory and taste dysfunction in the US population, and explore potential risk factors for these conditions.
Methods
Study participants
NHANES is a cross-sectional survey designed to assess the health and nutritional status of adults and children in the USA. Each year, the survey examines a nationally representative sample of about 5000 people who are located in 15 counties randomly selected across the country. The taste and smell examination was a new health examination component which was performed among participants aged 40 years and older.18 A total of 3708 men and women were enrolled in the taste and smell examination. A short screening questionnaire and a test of perceived taste intensity were then used to assess eligibility for the study.23 Participants were excluded from smell and taste examinations if they were: (1) pregnant or lactating; (2) allergic to quinine (pertinent to the quinine taste test only) or (3) unable to correctly rate the brightness of a standard series of three lights in an LED luminescence panel (pertinent to understanding the procedures of the taste test only). These exclusions left 3114 participants who completed the quinine and sodium chloride (NaCl) taste tests and 3519 participants who completed the 8-item smell test. The mean (SEM) age of NHANES participants (n=3114) included in the taste test was 57.5 (0.3) years; 48.6% were men. Regarding ethnic distribution, 72.8% were non-Hispanic Whites, 10.1% non-Hispanic Blacks and 6.6% Mexican Americans. For the smell test, the mean (SE) age of NHANES participants (n=3519) was 57.8 (0.3) years; 47.7% were men. Of these participants, 71.2% were non-Hispanic Whites, 10.6% non-Hispanic Blacks, 6.9% Mexican Americans and 11.3% other races/ethnicities (including other Hispanic and multiracial individuals).
The NHANES protocol was approved by the National Center for Health Statistics (NCHS) institutional review board, and written informed consent was obtained from all participants.
Smell and taste tests
For smell testing, the two four-item versions (A and B) of the NHANES Pocket Smell Test (Sensonics International, Haddon Heights, New Jersey, USA), developed in conjunction with the NIH, were sequentially administered, resulting an eight-item ‘scratch and sniff’ test.23 The eight odorants (chocolate, strawberry, smoke, leather, soap, grape, onion and natural gas) were presented in a fixed order. A participant was required, in a forced-choice situation, to identify each odorant from four alternative names. Smell impairment was defined as not being able to correctly identify six or more of the eight odours, each from a list of four possible responses.8 A recent validation study demonstrated moderate-to-good test–retest reliability of the NHANES smell protocol (intraclass correlations were 0.82 and 0.69 for 2-week and 6-month intervals, respectively).23 Of note, the eight odorants used in NHANES test are components of the 40-item University of Pennsylvania Smell Identification Test (UPSIT).24 Our definition of smell impairment approximately corresponds to the definition of being unable to correctly identify 29 or more of the 40 odours using the UPSIT test (see online supplementary table S1).
supplementary tables and figures
The taste tests employed in this NHANES survey included a tongue tip taste test and a whole-mouth taste test. In the tongue tip test, the taste stimuli (0.32 mg/mL quinine (bitter) and 58.5 mg/mL NaCl (salty) in 10 mL solution) were presented on a cotton swab that was gently moved across the tip of the tongue in a standardised manner.23 Participants were asked to identify the taste (salty, bitter, sour, something else, no taste) and rate the perceived intensity on the Generalised Labelled Magnitude Scale.25 A 30 s interval was interspersed between stimulus presentations, during which time participants rinsed their mouths with water. In the whole-mouth taste test, participants swished 10 mL of each tastant solution (19.5 mg/mL NaCl, 58.5 mg/mL NaCl or 0.32 mg/mL quinine) for 3 s, expectorated and rinsed their mouths with water. The participants then were asked to identify the taste quality and rate the solution's intensity on a standardised scale. As a replication test, another whole-mouth taste test for salt was performed at the end of the chemosensory test. The participants were randomised to receive either a 0.32 M NaCl or a 1 M NaCl salt solution.
A recent test–retest reliability and validity examination of NHANES taste test protocol demonstrated a reasonable correlation between quinine whole-mouth measurement (0.32 mg/mL) and other taste measurements, including tongue tip tests of NaCl (r=0.53) and quinine (r=0.44), and whole-mouth tests of NaCl (r=0.60 for 19.5 mg/mL NaCl and 0.77 for 58.5 mg/mL NaCl), sucrose, citric acid and propylthiouracil, suggesting that the whole-mouth quinine assessment was a reasonable assessment for overall taste functioning.23 Thus, in our study, instead of intensity ratings, failing to correctly identify quinine in the whole-mouth test was used to define taste dysfunction. In sensitivity analyses, we defined taste impairment as failing to correctly identify quinine (tongue tip and whole-mouth test) or NaCl (tongue tip and whole-mouth test).
Demographics and related information
The NHANES survey employed a computer-assisted personal interview system. The inhome questionnaire obtained information on age, sex, race/ethnicity (non-Hispanic White, non-Hispanic Black, Mexican American and other race),26 educational attainment (high school or below, some college, college, graduate school or above), ratio of family income to poverty (PIR; categorised as low (PIR<1.3), middle (1.3≤PIR≤3.5) and high (PIR>3.5)),26 smoking status (never smoker, past smoker, current smoker: <10, 10–20, >20 cigarettes/day), alcohol consumption (non-drinker, 1–3 or ≥4 drinks/day), self-reported chronic diseases (diabetes, cardiovascular disease (CVD), asthma and cancer), pesticide use in home (yes, no), self-reported taste and smell problems (defined as reporting problems within the past year) and conditions that might influence taste and smell ability (frequent nasal congestion, head injury, tonsillectomy, broken nose/serious injury to face or skull and sinus infection). Symptoms of depression were assessed using the nine-item Patient Health Questionnaire scale (PHQ-9, possible range 0–27). A cut-off point ≥10 was used to identify participants with moderate-to-severe depression.27 To estimate physical activity, metabolic equivalent values (MET-min/week) were calculated by using the sum of the MET score multiplied by the average time per week of specific physical activity and subsequently categorising the scores into tertile levels of physical activity.28 Blood pressure (BP) and anthropometric measurements were performed by trained health technicians in the mobile examination centres. BP was measured three times, and the mean values of the last two measurements were used in the analysis. Hypertension was defined as systolic BP ≥140 or diastolic BP ≥90 mm Hg, or positive answers to the questions, ‘Now taking prescribed medicine for high BP’ or ‘Told had high BP 2+ times’. Body mass index (BMI) was calculated as weight in kilograms divided by height in metres squared. Obesity was defined as BMI ≥30 kg/m2.
Statistical analysis
Owing to the NHANES sampling design, the sample weights were incorporated into the analysis whenever possible. We used the number 15 (the number of primary sampling units minus the number of sampling strata) for the df. A SAS procedure—PROC SURVEYFREQ—was used to estimate the weighted prevalence of taste and smell disorders in the total population as well as within subgroups of the population. The comparison between participants with and without taste or smell disorder was tested using the Wald F-test in the PROC SURVEYREG for continuous variables or the Rao-Scott χ2 test in the PROC SURVEYFREQ for categorical variables. Logistic regression (PROC SURVEYLOGISTIC) was used to estimate the age-adjusted and sex-adjusted ORs and 95% CIs of taste and smell disorders for common socioeconomic, demographic and lifestyle characteristics that may serve as risk factors of the disorders, including BMI, race/ethnicity, educational attainment, family income, smoking status, alcohol use, physical activity, depression, hypertension, obesity, diabetes, CVD, asthma, cancer, pesticide use, frequent nasal congestion, head injury, tonsillectomy, broken nose or serious injury to face or skull and sinus infection. To minimise sample reduction due to missing covariates, indicator variables were used for missing categorical variables. We used a SAS macro (%StepSvylog) to perform backward model selection for the survey data. Potential risk factors with p<0.25 were entered together into a multivariable logistic model and then successively removed until all retained variables had a p<0.05.29 Finally, to assess the capacity of selected risk factors in predicting smell and taste disorder, we plotted a receiver operating characteristic (ROC) curve and calculated a sample-weighted area under the ROC curve (AUC) that incorporated the NHANES sampling design.
Data were analysed with the SAS software package, V.9.4 (SAS Institute, Cary, North Carolina, USA), and STATA, V.12.0 (Stata Corporation, College Station, Texas, USA). Two-sided p<0.05 was considered statistically significant.
Results
The overall estimated prevalence of smell impairment was 13.5%, whereas it was 17.3% for taste impairment. The estimated prevalence of having a taste and smell disorder was 2.2%. Thus, about 28.6% of the US adult population aged 40 years and older appears to have either a smell or taste problem or both.
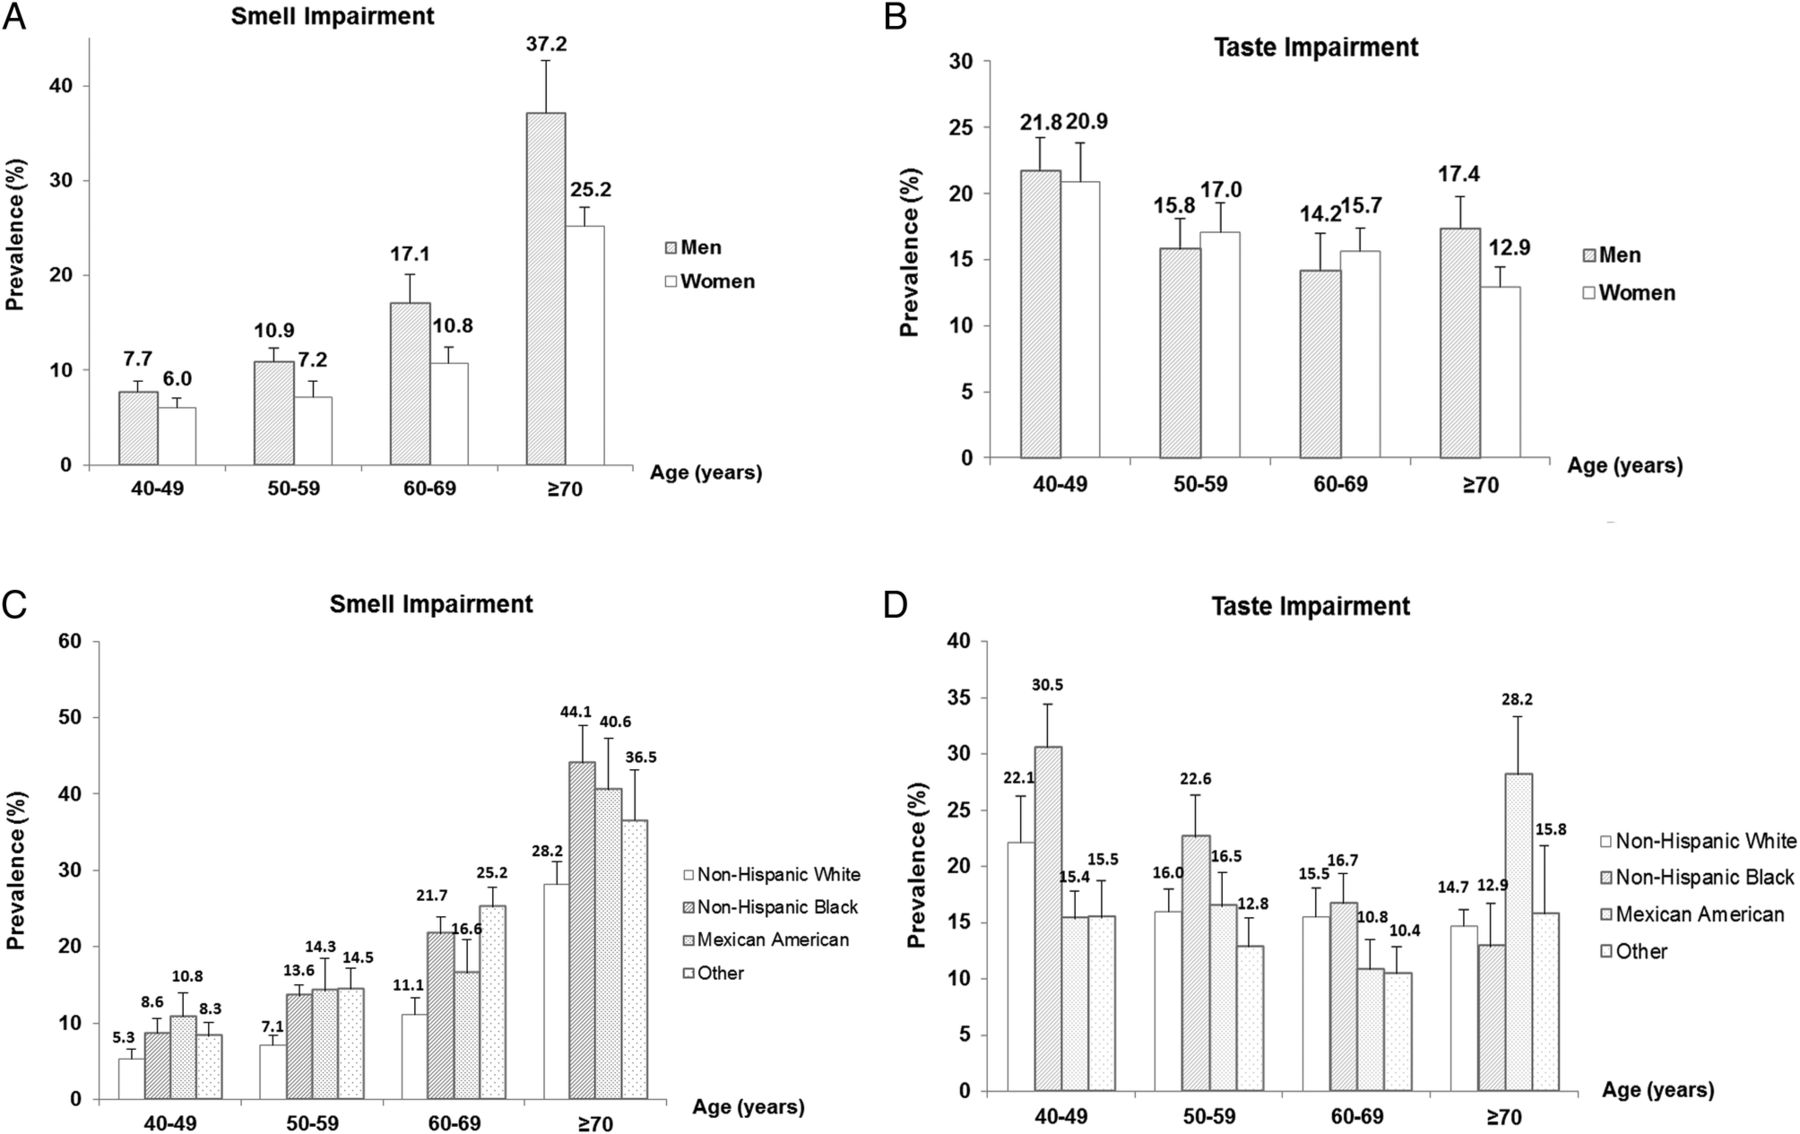
Figure 1 shows the prevalence estimates of smell and taste disorders according to age, sex and ethnicity. For smell dysfunction, the estimates significantly increased with age in men and women. In addition, compared with women, men had a higher prevalence in each age group, especially in the group of 70 years and older (men: 37.2%; women: 25.2%). Regarding race/ethnic distribution, compared with non-Hispanic White Americans, ethnic minorities, namely non-Hispanic Black Americans, Mexican Americans and other races/ethnicities, had a higher estimated prevalence of smell impairment. In contrast, no such patterns of relationship were found between these demographic variables and the prevalence of taste dysfunction. Paradoxically, the estimated prevalence of taste dysfunction decreased with age in women, but not in men. Online supplementary figure S1 shows mean (SE) NHANES Pocket Smell Test scores according to age and gender. Regarding taste impairment, non-Hispanic Black Americans had a higher prevalence of than that in other ethnic groups (22.9% for non-Hispanic Black, 17.1% for non-Hispanic White, 15.6% for Mexican American and 13.9% for other race). Online supplementary figure S2 demonstrates the prevalence of taste and smell impairment by age, sex and ethnicity. Regarding individual smell test items of all the participants, 4.3% incorrectly identified the odour of onion, 6.7% of soap, 9.5% of smoke, 12.3% of natural gas, 16.1% of chocolate, 18.7% of strawberry, 20.6% of leather and 30.4% of grape. In the age group of 70 years and older, the corresponding proportions reached 21.2% for smoke and 26.3% for natural gas (see online supplementary figure S3).

Prevalence of smell and taste impairment according to age, sex and race/ethnicity. (A and B) The prevalence of smell and taste impairment in men and women according to each age group. (C and D) The prevalence of smell and taste impairment in different ethnicities according to each age group.
The characteristics of the study population by smell and taste disorder status are shown in table 1. In univariate comparisons, in addition to the demographic characteristics, participants with smell impairment tended to have lower levels of educational attainment, physical activity, family income and alcohol consumption than other participants. Moreover, they had a higher prevalence of hypertension, diabetes, CVD, cancer and self-reported taste and smell problems (p<0.05). Other factors, including BMI, smoking, obesity, depression, the history of asthma, pesticide use, nasal congestion, tonsillectomy and head injury, were not associated with smell dysfunction. Age and ethnicity were associated with the prevalence of taste impairment.
Characteristics of study participants according to smell and taste impairment status*
After adjusting for age, gender and ethnicity, the prevalence of smell and taste disorders was differentially associated with other socioeconomic, lifestyle and medical history variables (table 2). Educational attainment, family income, physical activity, alcohol consumption and a history of hypertension, CVD or cancer were significantly associated with the prevalence of olfactory dysfunction. Educational attainment and a history of asthma were significantly associated with the prevalence of taste dysfunction.
Demographic-adjusted ORs of smell and taste impairment by socioeconomic characteristics, lifestyle factors and medical history*
In backward stepwise selection, older age, male gender, ethnic minorities (including non-Hispanic Black and Mexican American), low family income, low educational attainment and a history of asthma or cancer remained in the model and were independently associated with an increased prevalence of smell impairment (OR and 95% CI was 1.37 (1.30 to 1.45) for age, 1.68 (1.27 to 2.22) for men, 1.91 (1.36 to 2.67) for non-Hispanic Black, 1.45 (1.04 to 2.01) for low family income, 1.33 (1.17 to 1.52) for low education attainment, 1.38 (1.05 to 1.83) for cancer and 1.39 (1.02 to 1.89) for asthma; all p<0.05). In contrast, light-to-moderate alcohol consumption (1–3 drinks/day) was significantly associated with a decreased prevalence of smell impairment (OR and 95% CI 0.72 (0.58 to 0.91), p<0.01) (table 3). For taste dysfunction, non-Hispanic Black (OR and 95% CI 1.46 (1.07 to 1.99), p=0.02), high alcohol consumption (≥4 drinks/days) (OR and 95% CI 1.42 (1.04 to 1.94), p=0.03) and a history of CVD (OR and 95% CI 1.30 (1.02 to 1.67), p=0.04) were significantly associated with a higher prevalence of impairment, whereas age was inversely associated with the prevalence of this condition (each 5-year increment; OR and 95% CI 0.93 (0.89 to 0.97), p=0.01) (table 3).
Backward stepwise logistic regression model for smell and taste disorders
Age (each 5-year increment; OR and 95% CI 1.22 (1.08 to 1.38), p<0.01), physical inactivity (OR and 95% CI 2.38 (1.21 to 4.70), p<0.05) and head injury (OR and 95% CI 2.15 (1.10 to 4.18), p<0.05) were significantly associated with a higher prevalence of having taste and smell dysfunction.
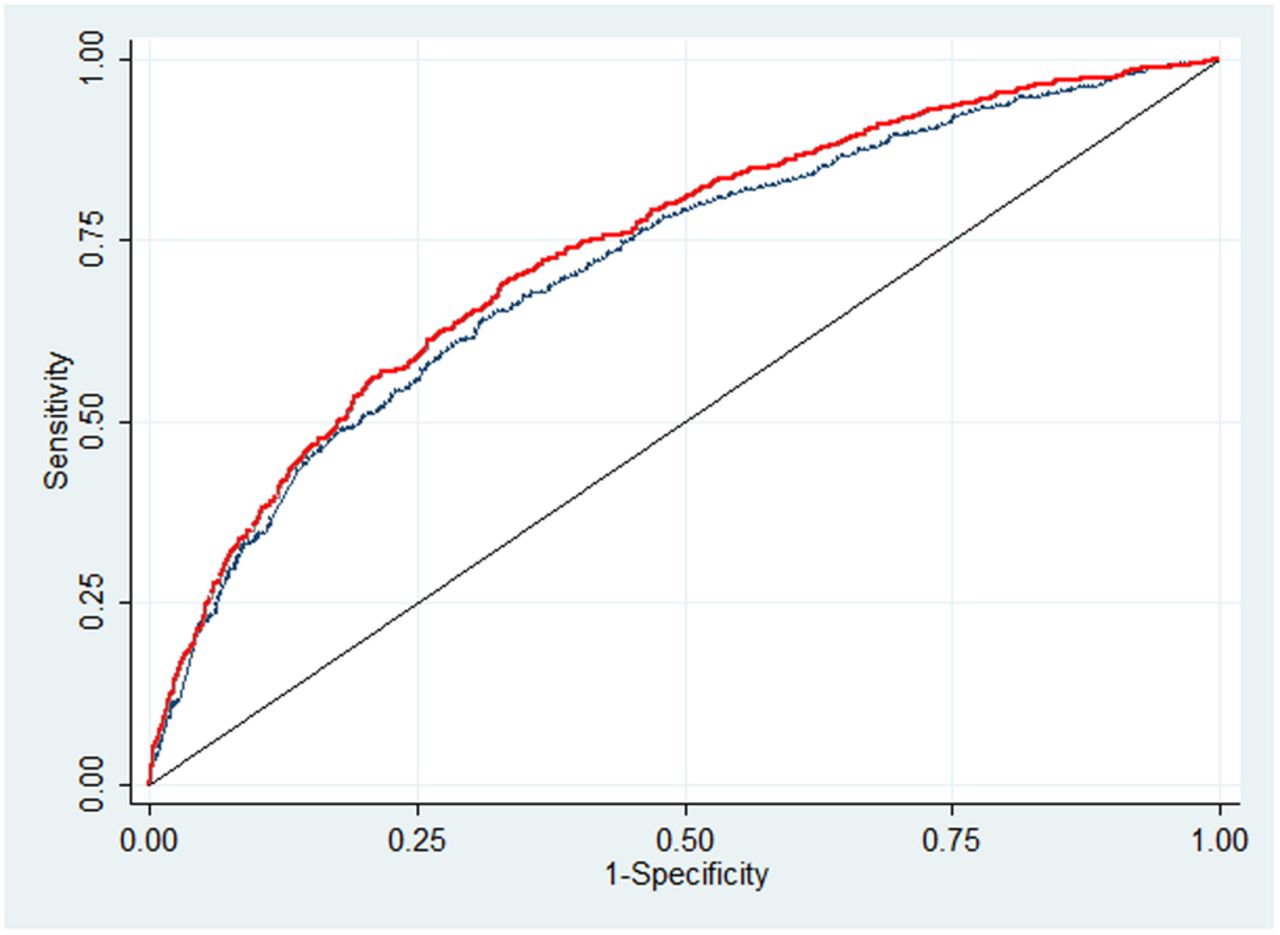
Figure 2 shows that age, sex and ethnicity render an AUC of 0.72 for smell dysfunction. Further inclusion of socioeconomic, lifestyle and medical risk factors only marginally increased the AUC to 0.74. For taste impairment, an AUC of 0.57 was estimated for a model that included age, ethnicity, heavy alcohol consumption and a history of CVD.
Receiver operating characteristic (ROC) curves showing the capacity of selected risk factors in predicting smell impairment in US men and women, National Health and Nutrition Examination Survey, 2013–2014. The blue curve is for the model adjusted for age, gender and ethnicity. The red curve is for the model further adjusted for family income, educational attainment, alcohol consumption and a history of asthma or cancer. The area under the ROC was 0.72 for the blue curve and 0.74 for the red curve.
In a secondary analysis, similar results regarding the risk factors for taste and smell impairment were observed when analyses were restricted to the participants aged 40–60 years, although some of the associations did not reach statistical significance probably due to reduced power (data not shown). In the sensitivity analyses, when we defined taste disorder as being unable to correctly identify either quinine or NaCl, we estimated a prevalence of 14.0%. In addition, with this alternative definition, the associations of Black ethnicity, heavy alcohol consumption and a CVD history with the prevalence of taste disorder were attenuated to non-significance (OR and 95% CI 1.25 (0.98 to 1.59) for Black ethnicity; 1.20 (0.86 to 1.67) for heavy alcohol consumption and 1.15 (0.85 to 1.55) for CVD).
Discussion
In this most current nationwide representative sample of US men and women aged 40 years and older, a significant number of US adults were found to experience smell or taste problems. The overall estimated prevalence of smell and taste impairment was 13.5% and 17.3%, respectively. Significant differences were observed in the estimated prevalence of smell impairment among subgroups defined by age, gender and ethnicity. Such differences were not evident for the estimated prevalence of taste dysfunction. In our multivariate analysis, a multitude of potential risk factors, including age, sex, race/ethnicity, family income, educational attainment, alcohol consumption and a history of asthma or cancer, were independently associated with the prevalence of smell impairment. Non-Hispanic Black ethnicity, high alcohol consumption and a history of CVD were significantly associated with a higher prevalence of taste impairment after adjustment for confounders.
Our nationally representative estimate of the overall prevalence of smell dysfunction (13.5%) was quite similar to the estimate based on a single-year NHANES survey (12.4%).21 These estimates were somewhat lower than that reported in other populations whose prevalence ranged from 18.0% to 24.5%,8 ,9 ,11 ,17 and somewhat higher than that reported by some other studies (2.7% to 3.8%).10 ,19 Differences between the test procedures (eg, odorants, psychophysical paradigms) and the study populations (eg, age, sex and health status) are presumably involved (see online supplementary table S2). Using the 40-item UPSIT, Doty et al13 found little age-related decline in smell function until the sixth decade of life, at which time a precipitous age-related decline occurred, illustrating how age would be expected to markedly influence prevalence. Of particular importance in establishing prevalence are the criteria used to define dysfunction, which vary considerably among studies. In two studies, being unable to identify 75% of either 4 or 12 odorants was defined as dysfunction.9 ,12 Other studies have set this criterion at 62.5% for either 8 or 16 odorants,6 ,14 ,21 and 40% for 5 odorants.9 Such variations in criteria significantly influence the estimated prevalence and likely explain much of the variation seen among prevalence studies. Our study, like most others, has the limitation of employing a relatively few number of odorants. Despite this limitation, however, our criterion for defining smell impairment (ie, <75% or 6/8 items) corresponds to dysfunction defined by the 40-item UPSIT. Correctly identifying six out of eight items corresponds to an UPSIT score of 30, which is the cut-point between mild and moderate microsmia.24
Only a limited number of epidemiological studies have estimated the prevalence of taste dysfunction.10 ,17 ,20 ,22 In the 1994 Disability Supplement to the National Health Interview Survey (NHIS-D), based on information from a self-reported taste impairment questionnaire, Hoffman et al22 found that only 0.6% of US adults (>18 years) reported having a gustatory problem. In the current study, using standardised taste testing, the prevalence of taste impairment was 17.3%, whereas the prevalence of self-reported taste impairment (defined as reporting taste problems within the past year) was only 5.3%, suggesting that self-reported estimates significantly underestimated the true prevalence.8 ,9 ,30 Nevertheless, the prevalence of taste impairment in our study was comparable to two other large taste testing studies that reported prevalences of 14.8% and 20.0%.10 ,17
Epidemiological studies that have examined potential risk factors for smell and taste disorders are limited. Several have consistently found the prevalence of smell impairment to increase with age and to be higher in men than in women.8 ,11 ,17 ,21 In addition, the current analysis demonstrated that certain ethnic groups, such as non-Hispanic Blacks and Mexican Americans, had a higher prevalence of smell impairment than that observed for White Americans. In the National Social Life, Health, and Aging Project study, Pinto et al31 also demonstrated that older African-Americans and Hispanics had worse olfactory function. Williams et al32 observed significant differences between Hispanics, African-Americans and non-Hispanic Whites in taste perception. While a subtle difference was noted by Doty et al24 between White and Black Americans in a large, albeit convenience, sample, another study observed equivalent UPSIT scores in White and Black American populations and relatively higher scores in Korean American populations.33 The discrepant results may reflect differences in population characteristics, testing methods and definitions for smell impairment.
In the current study, other socioeconomic risk factors for smell impairment that are independent of ethnicities were also identified, including low educational attainment and low family income. Our findings of the influences of these socioeconomic factors were consistent with previous studies.4 ,19–21 ,34 Existing evidence has suggested that access to healthcare, occupation and overall quality of life potentially explain the link between low socioeconomic status and a higher prevalence of smell disorder.35 Regarding olfactory function, besides the above findings which were mostly consistent with the data from 2012 NHANES survey,21 our results additionally demonstrated a link between a history of asthma and cancer and a slightly higher prevalence of smell dysfunction. For medical history, Alobid et al36 reported that a history of persistent asthma had a significant impact on smell loss in patients with nasal polyposis. Moreover, asthma was a predictor of poor olfactory function in patients with chronic rhinosinusitis.37 Some clinical studies have also demonstrated that smell function is significantly decreased in patients receiving cancer chemotherapy,38 ,39 and at least one study suggest that the prevalence of self-reported taste and smell alterations could reach as high as 86%.40 Of note, smoking was not associated with the prevalence of smell impairment in our cross-sectional analysis. Accumulating evidence has suggested that smoking may exert an adverse effect on smell function,8 ,17 ,41 although some studies did not observe such a link.11 ,20 ,42 In another cross-sectional population-based study, Mullol et al9 reported that smoking and exposure to noxious substances were even mild protective factors for smell recognition. These mixed findings may reflect the cross-sectional nature of these studies, as well as the lack of detailed assessments of smoking dose and duration, which are often more informative than dichotomous smoking status. More prospective studies are warranted to elucidate the potential adverse effect of smoking on olfactory function.
In comparison to the data for smell impairment, fewer associations between taste impairment and demographic/health measures were observed. We did find that race/ethnicity, heavy alcohol use and a history of CVD were associated with a higher prevalence of taste impairment. Compared with non-Hispanic White participants, non-Hispanic Black participants had a higher prevalence of taste and smell disorders. The underlying reason for this observation was unknown, although other socioeconomic factors and genetic susceptibility might partially account for this link. Interestingly, we also found heavy drinking to be associated with an increased prevalence of taste dysfunction, whereas light-to-moderate drinking was associated with a decreased prevalence of smell dysfunction, suggesting that the amount of alcohol intake may exert distinct effects on chemosensory perception.21 ,43 ,44 In addition, we found a positive association between CVD and the prevalence of altered taste. Evidence has suggested that variations in oral sensation, influenced by genetic and environmental factors, might increase the risk of CVD by impacting dietary behaviours such as higher intake of high-fat and sweet foods.45 ,46 However, in this cross-sectional study, we could not exclude the possibility that the taste function might be influenced by the medications taken by people with CVD. Unexpectedly, an inverse association between age and the prevalence of taste dysfunction was observed in our study, which is in contrast to frequent reports of age-dependent reductions in taste ability.47 ,48 Ageing may primarily influence the taste sensitivity to low levels of stimuli,47 but less so for suprathreshold deficits in taste. In most epidemiological studies, relatively high concentrations of tastants (24 mg/mL quinine hydrochloride; 75–100 mg/mL NaCl; 100–200 mg/mL sucrose; 50–165 mg/mL citric acid) have been employed,10 ,17 which may not be sensitive enough to detect age-related taste dysfunction.49 Of note, threshold concentrations are typically set at much lower concentrations (eg, 3×10⁻⁴ mg/mL for quinine, 0.585 mg/mL for NaCl, 6.84 mg/mL for sucrose and 3.84 mg/mL for citric acid).49 In the NHANES, the tastant concentrations (0.32 mg/mL for quinine, 19.5 and 58.5 mg/mL for NaCl) were much higher than the threshold concentrations, albeit comparable to those used in some previous epidemiological studies.10 ,17 This may explain the similarity between our NHANES findings and those reported in a German population with taste test at suprathreshold concentrations, in which a decline trend of the prevalence of taste dysfunction was observed in women aged 45–74 years.17
The present study provides a nation-representative estimate of the prevalence of taste and smell impairment among men and women aged 40 years and older in the US population. Most previous studies were only conducted among older adults.8 ,10 ,12 ,14 ,15 Moreover, it has demonstrated that chemosensory disturbances are influenced by a range of demographic and health factors. Importantly, our analysis strongly suggests that a considerable number of Americans suffer from chemosensory disturbances. That being said, this research has its limitations. First, it is a cross-sectional study, which limits its ability to infer causal relationships between risk factors and taste and smell impairments. Second, we utilised only bitter and salt-tasting stimuli, excluding sweet and sour-tasting ones. Furthermore, the unexpected inverse association of taste dysfunction with age suggests that the test used by NHANES is not sensitive enough to capture age-related declines in taste function. Nonetheless, there is evidence that the whole-mouth quinine test used in our study may be a good proxy for overall taste function, even though there are presently no universally accepted standards to best define taste impairment.23 Third, we measured taste and smell function on only a single occasion, which may not be representative of longerterm function. Nevertheless, the taste and smell measurements employed in this study have been found to be largely reproducible over a 6-month period.23 In addition, although a recent study demonstrated that the NHANES taste and smell protocol has moderate-to-good test–retest reliability,23 the face validity of the protocol was not proven. Furthermore, the impact of cognitive function on the validity of assessments of smell and taste functions cannot be evaluated in this investigation. Fourth, the NHANES survey only sampled non-institutionalised and relatively healthy individuals. The prevalence of taste and smell impairment may be significantly higher in persons whose health is otherwise compromised, such as those with neurodegenerative disorders.50 Finally, since only a limited number of potential risk factors were evaluated, other risk factors may exist that have yet to be identified.
Conclusion
This study, based on a representative sample of the US population, strongly suggests that a significant number of American citizens suffer from smell or taste problems. Thus, 13.5% of the study population exhibited smell dysfunction, 17.3% taste dysfunction and 2.2% taste and smell dysfunction. Since the 2016 US Census Bureau estimates the US population ≥40 years old to be ∼152 million,51 this translates to over 43 million Americans having some degree of chemosensory dysfunction. The adverse consequences of these disorders are particularly critical to older populations because approximately one-fifth of those sampled could not identify the test odours of smoke and natural gas, in accord with other studies on this topic.52 As shown in the NHANES study, age, gender, ethnicity, educational attainment, family income, light-to-moderate alcohol consumption and history of asthma or cancer were potential risk factors for smell dysfunction. Risk factors for taste dysfunction were more limited, being confined only to ethnicity, heavy alcohol consumption and a history of CVD. Future prospective investigations are needed to establish more clearly the link between these and other risk factors and the development of chemosensory disturbances.
References
Footnotes
Contributors QS was responsible for the study concept. GL, GZ and QS were responsible for analysis and interpretation of data. GL wrote the first draft of the manuscript. RLD contributed to results interpretation, statistical analysis and critical revision of the manuscript. All authors approved the finally version of the manuscript.
Funding QS was supported by a career development award, R00-HL098459, from the National Heart, Lung, and Blood Institute, and ES021372 and ES022981 from the National Institute of Environmental Health Sciences. GL was supported by the International Postdoctoral Exchange Fellowship Program 2015 by the Office of China Postdoctoral Council.
Competing interests RLD is the president and major shareholder of Sensonics International, the manufacturer of the NHANES Pocket Smell Test.
Patient consent Obtained.
Ethics approval Ethical committee at the National Center for Health Statistics.
Provenance and peer review Not commissioned; externally peer reviewed.
Data sharing statement No additional data are available.