Article Text

Abstract
Objectives The objective was to examine whether the Oxford Hip Score (OHS) demonstrated a floor or a ceiling effect when used to measure the outcome of hip replacement surgery in a large national cohort.
Setting Secondary database analysis of a national audit conducted in England and Wales on patient undergoing hip and knee arthroplasty in a secondary care setting.
Participants 93 253 primary arthroplasty patients completed preoperative OHS questionnaires and 69 361 completed 6-month postoperative OHS questionnaires. The population had a mean age of 67.78 (range 14–100, SD 11.3) and 59% were female.
Primary Secondary Outcome Measures Primary outcome measure was the Oxford Hip Score (OHS). Secondary outcome measures were the OHS-FCS and OHS-PCS. Floor and ceiling effects were considered present if >15% of patients achieved the worst score/floor effect (0/48) or best/ceiling effect (48/48) score.
Results Preoperatively, 0% of patients achieved the best score (48) and 0.1% achieved the worst score (0). Postoperatively, 0.1% patients achieved the worst score, but the percentage achieving the best score increased to 11.6%. Subgroup analyses demonstrated that patients between 50 and 59 years of age had the highest postoperative best score, at 15.3%. The highest postoperative OHS worst score percentage was in a group of patients who had a preoperative OHS above 41/48 at 28%. Furthermore, 22.6% of patients achieved the best postoperative OHS-PCS and 19.9% best postoperative OHS-FCS.
Conclusions Based on NHS PROMS data the overall OHS does not exhibit a ceiling or floor effect and should continue to be used as a valid measure of patient-reported outcomes for patients undergoing total hip arthroplasty. However, subscale analysis does indicate some limitations in the OHS-PCS and OHS-FCS.
Trial registration number NDORMS. Introducing standardised and evidence-based thresholds for hip and knee replacement surgery. The Arthroplasty Candidacy Help Engine (ACHE tool). HTA Project 11/63/01.
- ORTHOPAEDIC & TRAUMA SURGERY
This is an Open Access article distributed in accordance with the Creative Commons Attribution Non Commercial (CC BY-NC 4.0) license, which permits others to distribute, remix, adapt, build upon this work non-commercially, and license their derivative works on different terms, provided the original work is properly cited and the use is non-commercial. See: http://creativecommons.org/licenses/by-nc/4.0/
Statistics from Altmetric.com
Strengths and limitations of this study
The 2009–2011 National Health Service patient-reported outcome measures/hospital episode statistics was a very large data set (n=96 606).
The measure assessed (Oxford Hip Score) is very widely used on an international level.
There were a proportion of non-responders from baseline (72%).
Secondary database analysis: data were not collected by the organisation that conducted the study.
There was no comparison between floor and ceiling effects and comorbidity, autonomy and weight.
Introduction
The Oxford Hip Score (OHS), a Patient Reported Outcome Measure (PROM), was developed (using patient interviews) in 1996 for assessing outcomes of pain and function after hip replacement surgery from patients’ perspective, for use in clinical trials.1 The OHS consists of 12 Likert-type response items, which are summed to an overall score that originally ranged from 12 to 60 (60 being the worst score), but which is now scored differently: ranging 0 (worst) to 48 (best).1 ,2 While the single composite scale remains valid, it is also possible to separate the OHS into two subscales, the Oxford Hip Score Functional Component Subscale (OHS-FCS) and the Oxford Hip Score Pain Component Subscale (OHS-PCS).3 The measurement properties for the OHS summary score (such as validity, reliability and responsiveness) were established during the developmental study, and subsequently examined and confirmed in a number of independent studies.1 ,2 ,4
Previous studies have expressed mixed results regarding the postoperative ceiling effect in the OHS.5–8 Ceiling and floor effects occur when a considerable proportion of subjects score the best/maximum or worst/minimum score, rendering the measure unable to discriminate between subjects at either extreme of the scale.9 ,10 Within the orthopaedic community a ceiling or floor effect is usually defined as 15% (or more) of individuals in a sample achieving the best or the worst level of the score.8 ,10 ,11
Within the surgical context, preoperative patients who score at the higher (least symptomatic) end of the OHS may display little or no improvement in their condition postintervention, while those scoring the lowest possible OHS score may not be able to demonstrate any further decline in their disease state.6 ,12 If large numbers of patients exhibit the highest or lowest scores the scope for discerning meaningful differences between patients at either of these extreme positions is lost.13 ,14
The mixed results from previous reports regarding the floor and ceiling effects in the OHS indicate the need for a large-scale study of this psychometric property. The primary objective of this paper was to identify any ceiling or floor effects for the OHS within the THA population. Secondary objectives were to identify any ceiling or floor effects within the pain and function subscales of the OHS, male and female populations, age groups and in patients achieving different preoperative scores.
Methods
This study used the combined 2009–2011 National Health Service Patient Reported Outcome Measures and Hospital Episode Statistics (NHS PROMS/HES) hip data set, which contains 97 487 hip observations with 93 253 preoperative and 69 361, 6-month postoperative completed OHS questionnaires (74% response rate). SPSS-21 was used for all data analysis.15 Figure 1 contains a flow diagram of the combined 2009–2011 NHS PROMS/HES knee and hip databases. Full methodological issues and concerns can be found in NHS PROMs’ official report.16

A flow chart of the combined National Health Service patient-reported outcome measures/hospital episode statistics (NHS PROMS/HES) hip and knee databases.
The percentage of patients who achieved each possible score of the OHS (within range 0–48) was analysed pre and postoperatively. We adopted the commonly used 15% threshold for patients achieving the highest and lowest score to define a ceiling and floor effect, respectively.5 ,10 ,17 ,18 Floor and ceiling effects of the pain and functional subscale were also examined. The OHS functional subscale (OHS-FSQ) consists of six items (1, 8, 9, 10, 11 and 12) and the pain subscale (OHS-PSQ) comprises six items (2, 3, 4, 5, 6 and 7).3 The subscale scores were standardised to a range from 0 (worst) to 100 (best) by multiplying each subscale raw score by 4.17.3
Furthermore, we examined for the presence of floor and ceiling effects by subgroups based on gender, age and preoperative score. Patients were divided into seven subgroups based on age (<39, 40–49, 50–59, 60–69, 70–79, 80–89, >90) and six subgroups based on preoperative scores (<8, 9–16, 17–24, 25–32, 33–40, >40). The non-responder population consisted of the 28% of patients that did not complete postoperative OHS questionnaires. An analysis of the preoperative best and worst score percentages for this population was also calculated.
Results
A total of 93 253 patients completed a preoperative OHS questionnaire and 69 361 completed a postoperative OHS questionnaire (approximate response rate 74%—noting that the baseline data includes a minority of patients who had not yet reached their 6-month follow-up date and those with a delayed response). Forty-one per cent of the preoperative population were male and 59% were female. The mean age was 67.78 (range 14–100, SD 11.3; table 1, figures 2 and 3).
A table showing the mean, range, SD median and the percentage of patients scoring the best and worst scores in the OHS overall, non-responders and male and female subgroups
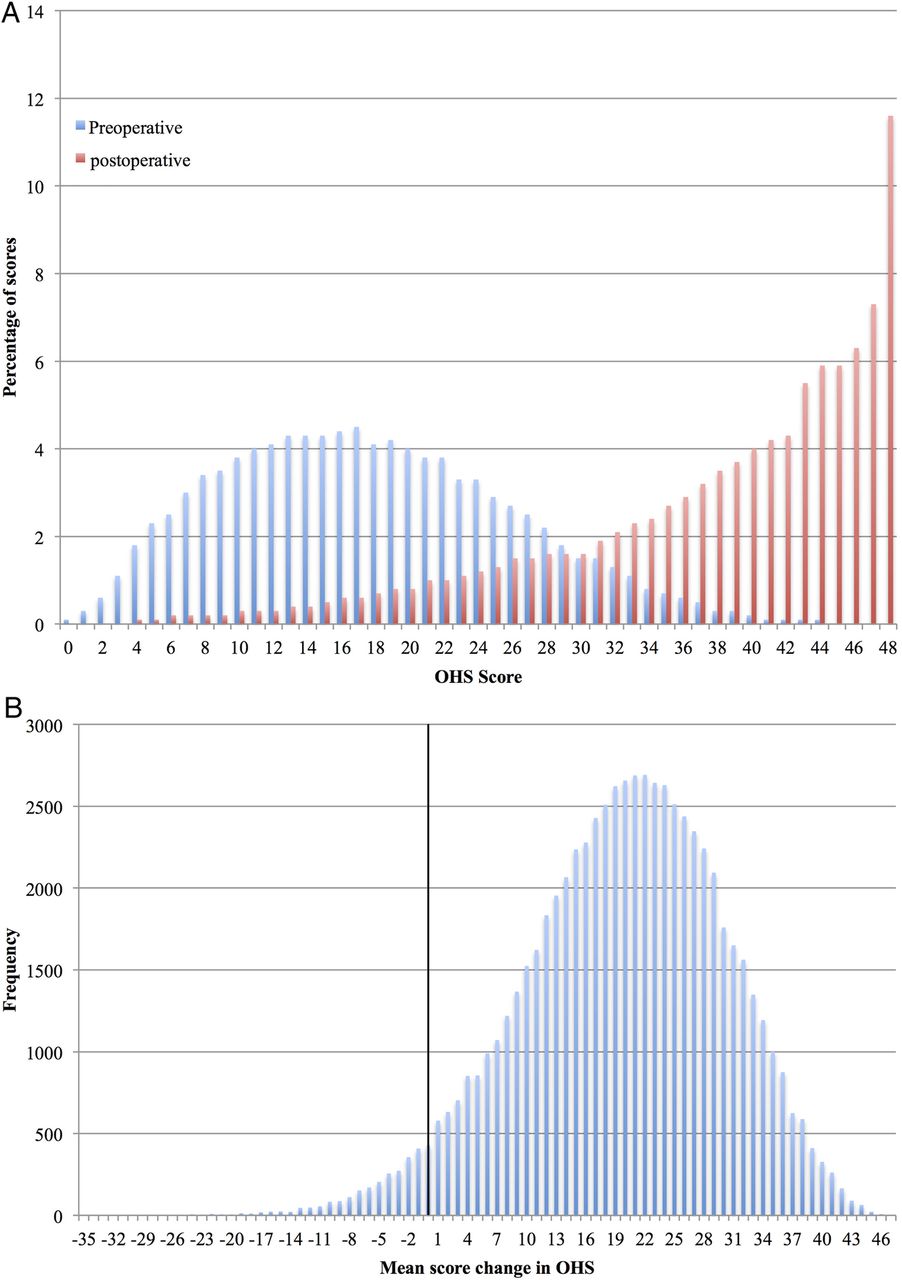
(A) A histogram showing the percentage of patients who scored each level (0–48) of preoperative and postoperative Oxford Hip Score. (B) A histogram of the number of patients.

A histogram showing the percentage of males and females scoring each level of the postoperative Oxford Hip Score (0–48).
Deconstruction by age showed the best and worst score percentages as displayed in table 2. The postoperative 50–59-year-old age group was the only one demonstrating a ceiling effect.
A table showing the percentages of patients achieving the best or worst OHS summary score preoperatively or postoperatively, by age group
The mean preoperative Oxford Hip Score—Functional Component Subscale (OHS-FCS) score was 45.9 (range 0–100, SD 20.3, median 46) and postoperatively, this increased to 78.8 (range 0–100, SD 20.9, median 83). Functional mean score change was +31.54 (range −83.32 to +100, SD 21.8). Only 0.2% of patients achieved the OHS-FCS preoperative worst score (0) and 0.3% achieved the best score (100). Postoperatively, 0.1% of patients achieved the worst (0) and 19.9% achieved the best score (100) (figure 4).

A histogram showing the percentage of patients achieving each preoperative and postoperative Oxford Hip Score Functional Component Subscale subscale score (0–100).
The mean preoperative Oxford Hip Score—Pain Component Subscale (OHS-PCS) score was 27.7 (range 0–100, SD 17.7, median 25) and postoperatively, this increased to 79.2 (range 0–100, median 83 SD, 21.4). Only 2.7% of patients achieved the OHS-PCS preoperative worst score (0) and 0.1% achieved the best score (100). The pain subscale mean score change was +50.6 (range −70.9 to +100, SD 24.4). Postoperatively, 0.1% of patients achieved the worst score (0) and 22.6% achieved the best score (100) (figure 5).

A histogram showing the percentage of patients achieving each preoperative and postoperative Oxford Hip Score Pain Component Subscale score (0–100).
Fifty-one per cent of patients achieving the best score in the pain subscale also achieved a best score for the function subscale. Fifty-eight per cent of patients that achieved the best score in the function subscale also achieved a best score in the pain subscale.
The six preoperative OHS score subgroups and their respective postoperative best and worst summary score percentages can be located in table 3.
A table showing the percentages of patients achieving the best or worst OHS summary score postoperatively by preoperative score subgroup
Previous papers have indicated that the OHS has a minimal important difference of approximately five points.19 We calculated that in this population 18.3% of patients scored >43 for their postoperative OHS.
Discussion
There were no floor or ceiling effects present for the summary OHS preoperatively according to the widely used definition of this phenomenon. The percentage of patients achieving the postoperative best score on the OHS summary score was 11.6%, and not above the customary 15% cut-off. Therefore, the OHS remains a valid measure of outcome in patients undergoing THA. Males tended to have higher preoperative scores than females (19.4 compared to 16.9). However, the mean change score for females and males was very similar (+19.2 males and +20.0 for females), though males tended to achieve higher best score percentages compared with females. Younger patients were more likely to have lower response rates and higher postoperative best score percentages. We could speculate that these higher scores may be due to younger patients having less comorbidity or that they may be more inclined to put themselves forward for surgery if their hip condition is affecting their ability to work. Patients with higher preoperative scores were also more likely to reach the best score in the OHS. Therefore, patients that score highly preoperatively are more likely to exceed the upper boundaries on the OHS. Subscales analysis demonstrated that the OHS-FCS and OHS-PCS subscales produced postoperative best score percentages above the 15% postoperative best score percentage threshold. These were 19.9% for the OHS FCS and 22.6% for the OHS PCS. Furthermore, 50% of the small number of patients who scored a best score on one subscale also achieved a best score on the other subscale.
Other studies have contributed relevant evidence on this issue. For instance, Garbuz (2006) reported postoperative ceiling percentages of 13.4% for the summary OHS, 25.4% for the pain subscale and 22.6% for the function subscale.6 However, these subscales were not the same as those used in this paper (and were not supported by factor analysis).3 Marx (2005) investigated 266 THA patients using two definitions of ceiling effect: the first being just the best score, the second involving the best three scores.5 These two definitions resulted in 9% (best score) and 39% (combined best three scores) of patients, respectively, being designated as ‘at the ceiling’.5 Danish and German translation validation studies of the OHS reported varied ceiling percentages, 19.9% for the Danish and no ceiling effect (percentage not given) in the German version.8 ,20
Although only 11.6% of patients achieved best scores in the overall postoperative OHS score, consideration needs to be given to the meaning of a ceiling or floor effect in the context of individual subscales. The OHS-PCS did reach the notional ceiling effect postoperatively, but a best score on this subscale appears (with reference to item content) to reflect the absence of pain. The fact that a large proportion of patients are pain-free, does not necessarily indicate limitations of the score, but may simply reflect the relative success of the treatment, as concluded by authors in another study.5 The primary aim of hip replacement (and indication for surgery) is, afterall, to relieve pain and it is difficult to see how any instrument could contain relevant items that measured a more positive response than ‘no pain’. In conjunction, consideration needs to be given to the activity and strain that a hip prosthesis is subjected to. Patients whose principal activity is walking may rarely experience any pain or discomfort. However, it is possible that those who participate in more vigorous or demanding activities may experience more pain. This need not be considered a limitation of the score, nor an indication of imperfection in the procedure, but a sign of higher requirements placed on the procedure by specific patients. Future research this may be difficult or inappropriate because of limitations in the spectrum of activities that each implant can reasonably undertake. By contrast, the ceiling effect in the OHS-FCS might indeed suggest limitations in the detection of clinically important change for high-functioning THA patients. In principle, functional subscales can always be made more demanding by including more strenuous items/response options. However, any additional item should reflect the areas of concern expressed by patients in the qualitative stage of instrument development, and response options should be weighed against simultaneously increasing floor effects at the preintervention assessment for other, less highly functioning, patients. Thus, when the OHS was devised, the importance or saliency of being unable to engage in higher level (higher intensity) activities, due to patients’ hip condition, was so rarely alluded to, that the inclusion of items to address this was considered unjustifiable, since these would be irrelevant (and therefore ‘not a problem’) to the vast majority of patients. The inclusion of such items would have produced a severe floor effect preoperatively, which would have implications if using the OHS to consider patients for surgery.
Nonetheless, while the OHS may not have exhibited a postoperative ceiling effect in the past, the profile of the population (age, BMI, comorbidities) undergoing THA and effectiveness of the procedure may have changed since its original development. Previous small-scale studies have shown an average mean OHS score change increase of approximately three points over the past 8 years.1 ,4 If this is generally the case, this could perhaps be explained by better surgical techniques, advancements in prosthesis design. Further research could usefully investigate the higher functioning subpopulation to better understand these patients’ characteristics. Additionally, an exploration could be conducted of whether patients who have best OHS scores pre or postoperatively feel that they actually have scope to improve further (or not), and if so, in what ways. This would reveal whether there is a need for future assessments to explore additional/broadened constructs, over and above those covered by the OHS, in patients at the more physically active end of the spectrum. Similar exploration has previously been undertaken in relation to Total Knee Replacement and the Oxford Knee Score resulting in the development of an adjunct OKS-Activity and Participation Questionnaire (OKS-APQ).21
There are a number of limitations associated with this study. A key issue is the missing population of non-responders. Approximately 30% of patients completed preoperative, but not postoperative OHS questionnaires. Two studies have been conducted on non-responders to PROMs and their characteristics, which concluded that younger patients and those with poorer outcomes are less likely to respond.22 ,23 Thus, it is possible that the absence of these lower/poorer-scoring non-responders from the data set might have had the effect of inflating the percentage of patients scoring at the best/ceiling end in our sample. Another limitation is the secondary analysis of the 2009–2011 NHS PROMS/HES hip data set. The data collected was carried out on a national scale, using multiple people in the collection and data entry process. It is possible that this encourages errors but the impact of this overall should be reduced due to the large size of the data set. Finally, the literature exhibits multiple definitions used to describe the floor and ceiling effect phenomenon. While, this paper has used the most commonly applied orthopaedic definition, we acknowledge that when using other analytical techniques it may be possible to draw a variety of different conclusions.
Conclusion
The OHS summary score contains no preoperative or postoperative ceiling or floor effect according to a widely applied definition and continues to be a valid measure of outcome for THA patients. Individual analysis of OHS subscales identified postoperative ceiling percentages above 15%, but when observed in conjunction there is only 11% of patients achieving best scores on both measures. This study identified the potential need to address further the meaning and relevance of ceiling effects, both in the context of the OHS and its subscales, and in general. There may be scope for future studies to explore additional/broadened constructs, over and above those covered by the OHS, in patients at the more physically active end of the spectrum.
Acknowledgments
A copy of the OHS and OKS questionnaires and permission to use these measures can be acquired from Isis Innovation Ltd, the technology transfer company of the University of Oxford via website: http://www.isis-innovation.com/outcomes/index.html or email: healthoutcomes@isis.ox.ac.uk.
References
Footnotes
Contributors The original idea behind this research was developed by AJP. Ethics and database development was originally developed by HSCIC and cleaned by KH. HSCIC was responsible for the NHS PROMS/HES database and data collection. Planning of the paper was a combined effort between CRL, KH, DJB and AJP. CRL conducted the initial literature review and all statistical analyses for this paper. The ideas behind the discussion were a combined contribution by all authors. CRL wrote the original manuscript. KH, AJP, DJB, RF and JD were involved in the editing and revising process of this manuscript. The guarantors for this work are CRL and AJP. ISIS innovation (licensee) provided the OHS, which was integral in the research.
Funding All funding for this study was provided through Oxford University and Oxford University Hospital Trust.
Competing interests None declared.
Ethics approval NDORMS.
Provenance and peer review Not commissioned; externally peer reviewed.
Data sharing statement All data for this study are freely available in the 2009–2011 NHS PROMS/HES database.