Article Text

Abstract
Objective There is a growing body of research that investigates how the residential neighbourhood context relates to individual diet. However, previous studies ignore participants’ time spent in the residential environment and this may be a problem because time-use studies show that adults’ time-use pattern can significantly vary. To better understand the role of exposure duration, we designed a study to examine ‘time spent at home’ as a moderator to the residential food environment-diet association.
Design Cross-sectional observational study.
Settings City of Toronto, Ontario, Canada.
Participants 2411 adults aged 25–65.
Primary outcome measure Frequency of vegetable and fruit intake (VFI) per day.
Results To examine how time spent at home may moderate the relationship between residential food environment and VFI, the full sample was split into three equal subgroups—short, medium and long duration spent at home. We detected significant associations between density of food stores in the residential food environment and VFI for subgroups that spend medium and long durations at home (ie, spending a mean of 8.0 and 12.3 h at home, respectively—not including sleep time), but no associations exist for people who spend the lowest amount of time at home (mean=4.7 h). Also, no associations were detected in analyses using the full sample.
Conclusions Our study is the first to demonstrate that time spent at home may be an important variable to identify hidden population patterns regarding VFI. Time spent at home can impact the association between the residential food environment and individual VFI.
- PUBLIC HEALTH
- PREVENTIVE MEDICINE
- EPIDEMIOLOGY
This is an Open Access article distributed in accordance with the Creative Commons Attribution Non Commercial (CC BY-NC 4.0) license, which permits others to distribute, remix, adapt, build upon this work non-commercially, and license their derivative works on different terms, provided the original work is properly cited and the use is non-commercial. See: http://creativecommons.org/licenses/by-nc/4.0/
Statistics from Altmetric.com
Strengths and limitations of this study
Our study extends the body of work on the effects of residential food environments on diet by looking at the amount of time that participants spend at home.
Previous studies ignore participants’ time spent at home, and this may be a problem because adults’ time-use can significantly vary.
Cross-sectional observational data limits the study's ability to discern the direction of causation.
Our outcome measure, vegetable and fruit intake, is based on the Canadian Community Health Survey 2010, and participants self-reported the frequency per day of fruits and vegetable eaten rather than the number of servings consumed. The self-reported frequency measure may contribute to both under and over-reporting of food intake behaviour.
Introduction
Low vegetable and fruit intake (VFI) has been linked to a number of chronic diseases, including type II diabetes,1 ,2 cardiovascular disease,3 ,4 and breast,5 ,6 oesophageal and colon cancers.7 ,8 Individual level determinants of VFI have been well established in the literature, where income and education are positively associated with VFI;9–11 however, study results of the association between VFI and its potential environmental determinants are decidedly mixed. Research on the food environment has explored the impacts of food retailers on VFI (eg, supermarkets, fast food outlets, convenience stores). Studies have shown that living in proximity to supermarkets is associated with improved diet outcomes12–19 and poor diet outcomes.20 ,21 Some studies also show no association between residential proximity to food vendors and VFI.22 ,23
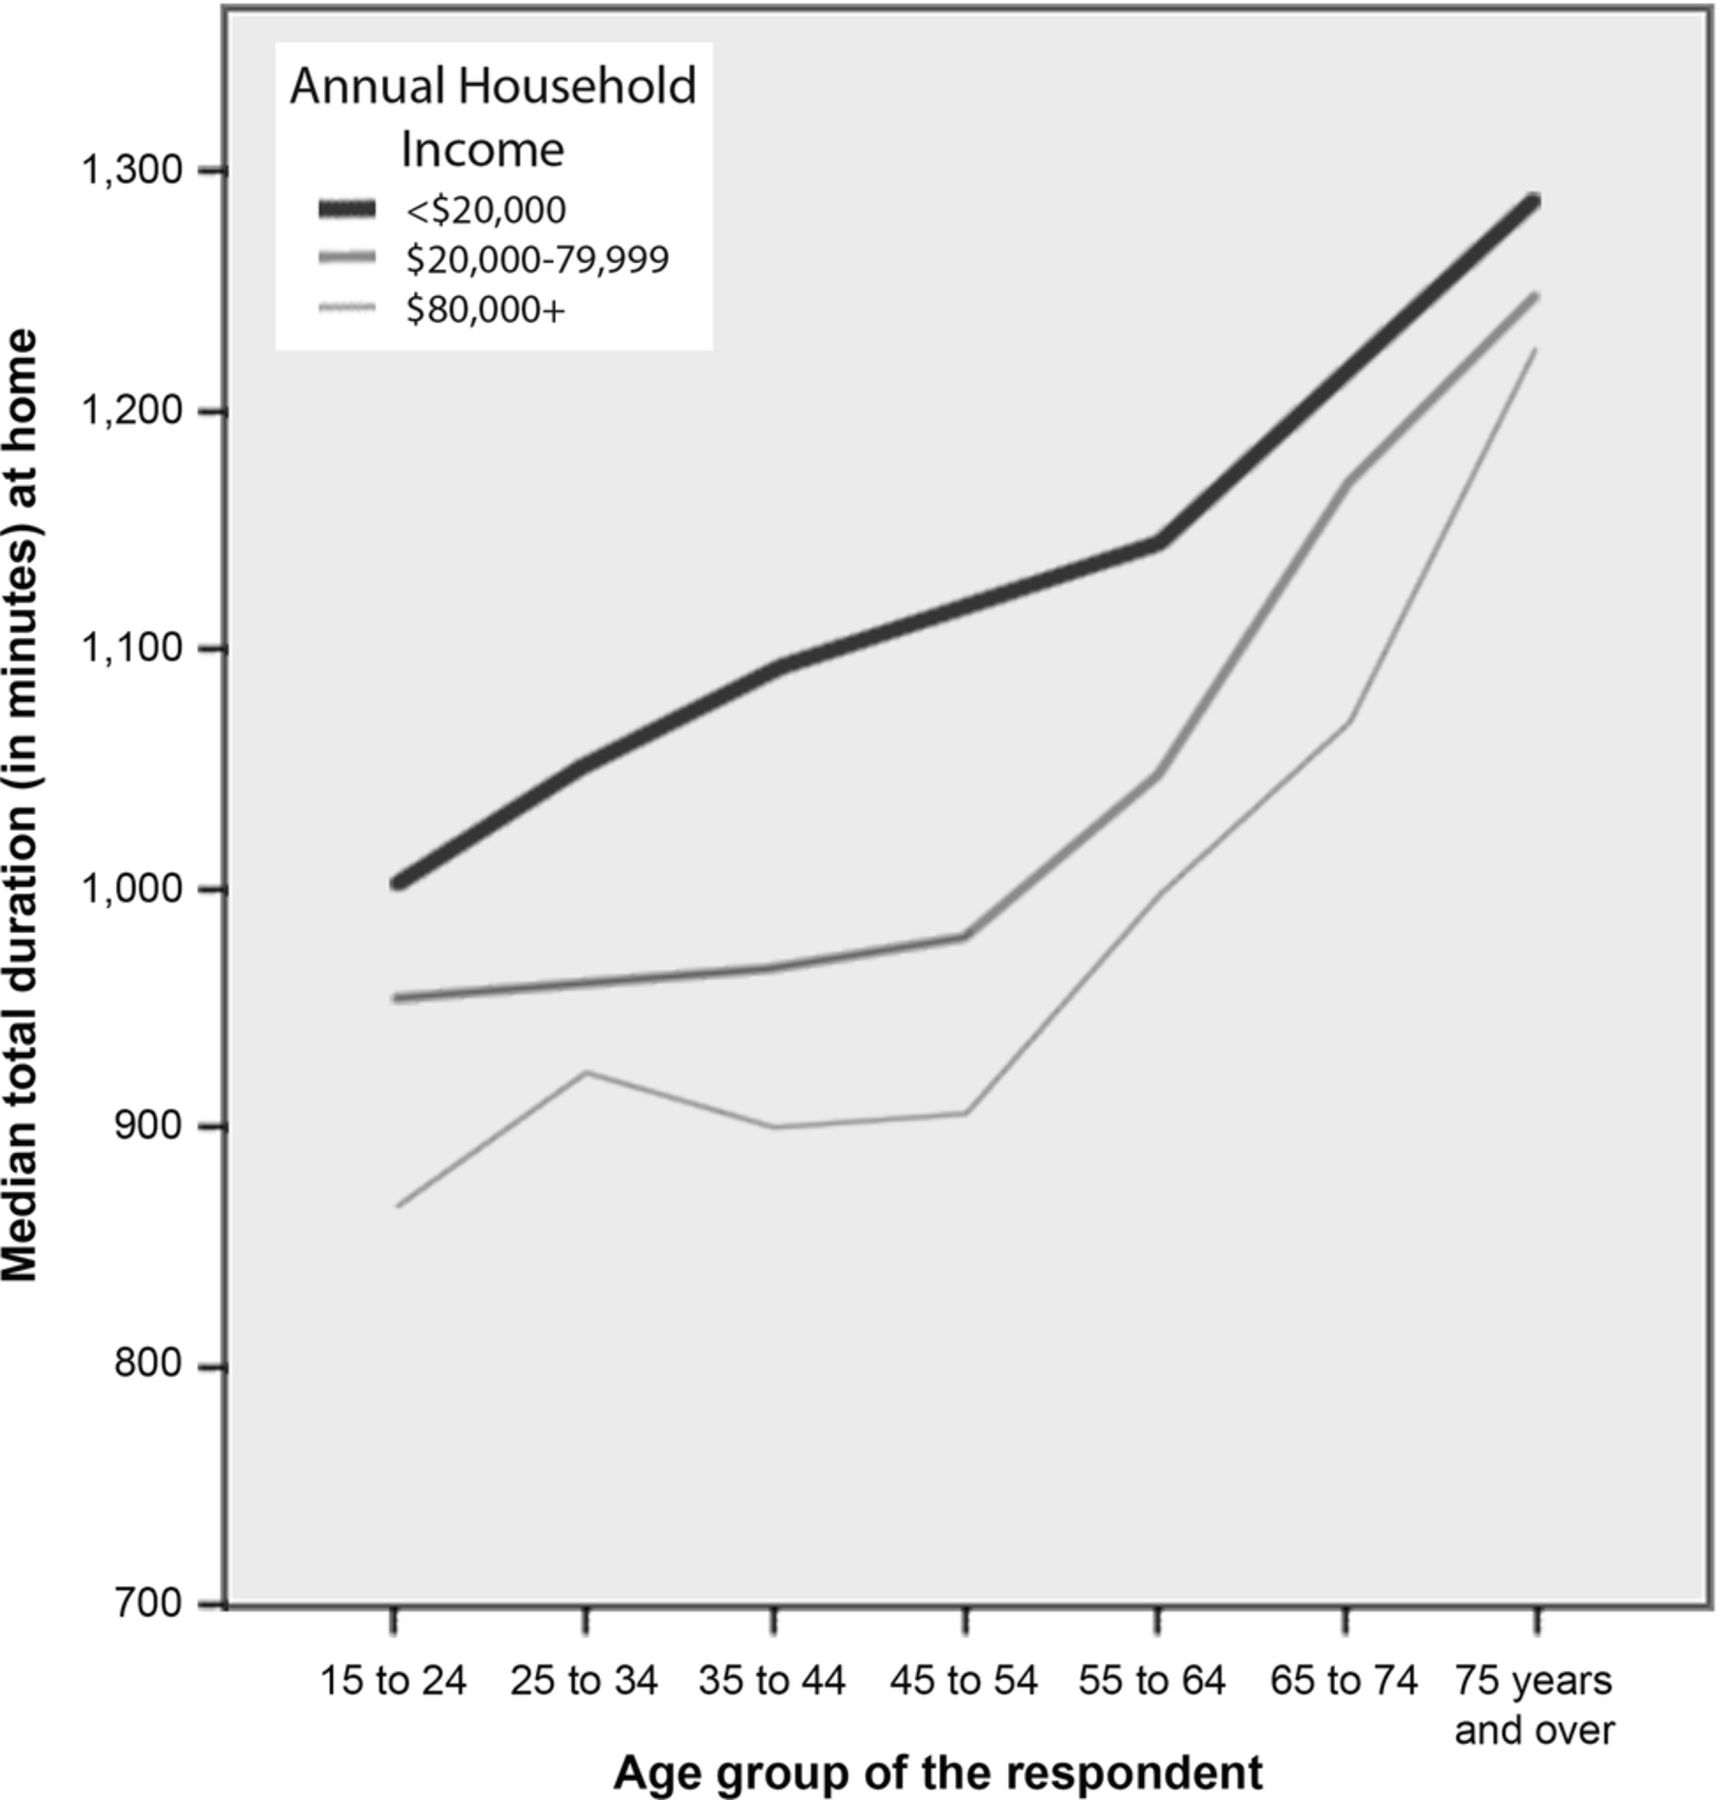
Along with the inconsistent findings described above, the research is also characterised by a lack of consideration for the individuals’ duration of exposure to their neighbourhood context. By ignoring the temporal dimension of exposure, previous studies may have unintentionally introduced measurement bias because exposure duration may significantly differ between participants. There is a dearth of studies that have explored this problem using multilevel analyses of neighbourhood effects on individual health outcomes. Chum and O'Campo24 found that the use of time-weighted multilevel regressions to account for duration of exposure resulted in (1) improved strength of association, and (2) improved model fit in models for the association between neighbourhood-level factors (including road traffic, access to supermarkets and fast food restaurants) and cardiovascular disease risk compared to typical multilevel models that do not account for time spent in the residential neighbourhood. There is also evidence to suggest that time spent in the residential neighbourhood varies. According to the 2010 Canadian General Social Survey (CGSS) public use microdata,25 time spent at home differs significantly by age and income: analysis of variance shows that total minutes spent at home on a typical weekday differs significantly by age groups and income groups (p<0.01). Figure 1 illustrates an increase in time spent at home for older age groups. Although those with lower income spend more time at home compared to those in the higher income brackets, the income effect is diminished with increased age.

Mean duration (in minutes) at home on an average weekday by age and income groups (Canadian General Social Survey 2010) weighted N=28 075 610.
There are a number of studies that examine individuals’ exposure to the non-residential food environment and its effect on diet.26–28 However, the non-residential environment may be less important for those who spend a significant amount of time at home (eg, individuals in low income and higher age brackets). In fact, Thornton et al28 examined potential effect modification by employment status on the association between food environment and diet, since time spent at home may differ by employment status.
Given the variability of time spent at home between individuals, accounting for individuals’ time use may help us avoid model misclassification by better quantifying exposure to the residential food environment. We hypothesise that people who spend more time in their home environments would rely more heavily on their local food vendors. For those who spend less time outside the home, the significance of exposure to the residential food environment may be more pronounced. Therefore, a stronger association between residential food environment and VFI may exist for those who spend more time at home compared to those who spend less time at home. Our study answers the following research questions to explore this potential dose–response relationship:
Does an association exist between the residential food environment and VFI?
Is the strength of the association between the residential food environment and VFI stronger for people who spend more time at home?
Materials and methods
Data sources
Project NEHW (Neighbourhood Effects on Health and Well-being) is a cross-sectional investigation of neighbourhood-level determinants of population health that used a three-stage sampling method. In the first stage, 50 city-delineated neighbourhood planning areas (NPA) were randomly selected out of a total of 140 NPAs. In the second stage, 1–2 census tracts (CT) were randomly selected from each of the 50 NPAs sampled, resulting in 87 randomly selected CTs. Finally, within the 87 CTs, approximately 30 individuals were randomly selected on the basis of their residential address. Eligibility criteria are as follows: (1) only one resident per household, (2) participants are aged 25–65 years, (3) able to communicate in English and (4) lived in the neighbourhood for at least 6 months. The response rate was 72%.
Data collection took place between March 2009 and June 2011.A total of 2411 individuals, representing 87 CTs, participated in the study. Data were obtained from inperson interviews, and participants provided written informed consent at the time of their interview. To ensure the generalisability of our findings and that these are representative of our target population, post-stratification weights were created based on demographic characteristics from the 2006 Canadian Census data for Toronto including sex, total household income, household size, immigrant status and age. More information about the study methods can be found in a previously published paper.24
Dependent variable
The primary outcome measure is frequency of VFI, and was assessed using questions from the US Behavioural Risk Factor Surveillance System.29 The same questions are also found in the Canadian Community Health Survey (2010).30 Six questions, similar to questions in a food-frequency questionnaire, were asked to determine total frequency intake of vegetables and fruits.31 ,32 Intake was calculated by adding the frequency of intake of fruit, fruit juice, green salad, carrots, potatoes (not including French fries, fried potatoes or potato chips) and other vegetables. VFI is based on self-reported data. Since VFI is non-normally distributed with a positive skew, for the purpose of the regression analysis, we categorised VFI into either ‘less than five times’ or ‘greater than or equal to five times’ per day. These categories of VFI have been used in previous studies.31 ,32 Frequency of intake was structured around the recommendations of Canada's Food Guide whereby one instance of VFI was considered to be one serving, and less than five servings a day is below recommendation.33 While frequency of intake may not necessarily equal the number of servings, for the purpose of this study it is treated roughly in the same manner, following the convention of previous studies.31 ,32
Independent variables
Toronto Public Health's Toronto Healthy Environments Inspection System (THEIS; 2012)34 provided the location of all food outlets. Within the THEIS database, the type of food retailer was used to examine food access in residential environments. Fast food, healthy food retailers and less healthy food stores were used in this study. Fast food restaurants were classified as a restaurant, food court vendor, cafeteria, food takeout, ice cream/yogurt vendor or hot dog cart. These restaurants were also required to have takeout options available, limited or no wait staff and customers having to pay prior to receiving food. If the restaurant had restricted access to the public, it was removed from the study (eg, food outlets in arenas where patrons must pay admission to access the food outlet).
Healthier food retail was classified as a food store (convenience/variety or supermarket) that sells a significant quantity and diversity of vegetables and/or fruit. If these food outlets did not meet the definition for healthy food retail, they were classified as a less healthy food store. These are typically convenience stores that primarily sell packaged snacks with low nutritional value. To account for retail locations outside of the city of Toronto in bordering municipalities, additional fieldwork was completed to ensure all food outlets were within 1 km of the residential addresses that were included in the analysis.
The rationale for examining the relationship between VFI and unhealthy food stores, and VFI and fast food restaurants was informed by several studies that have found an association between increased density of these stores and a reduction in vegetable and fruit intake/purchases.35 ,36 Bowman et al35found that the mean quantity (grams) of fruit and non-starchy vegetable intake was 148 g (SE=5 g) when no fast food was consumed versus 103 g (SE=6 g) when fast food was consumed during the intake period (significantly different at the level p<0.0001). Mason et al36 also found reduced odds of purchasing fruits and vegetables above the median amount for participants in areas with higher density of fast food restaurants and convenience stores (OR=0.74; p<0.05).
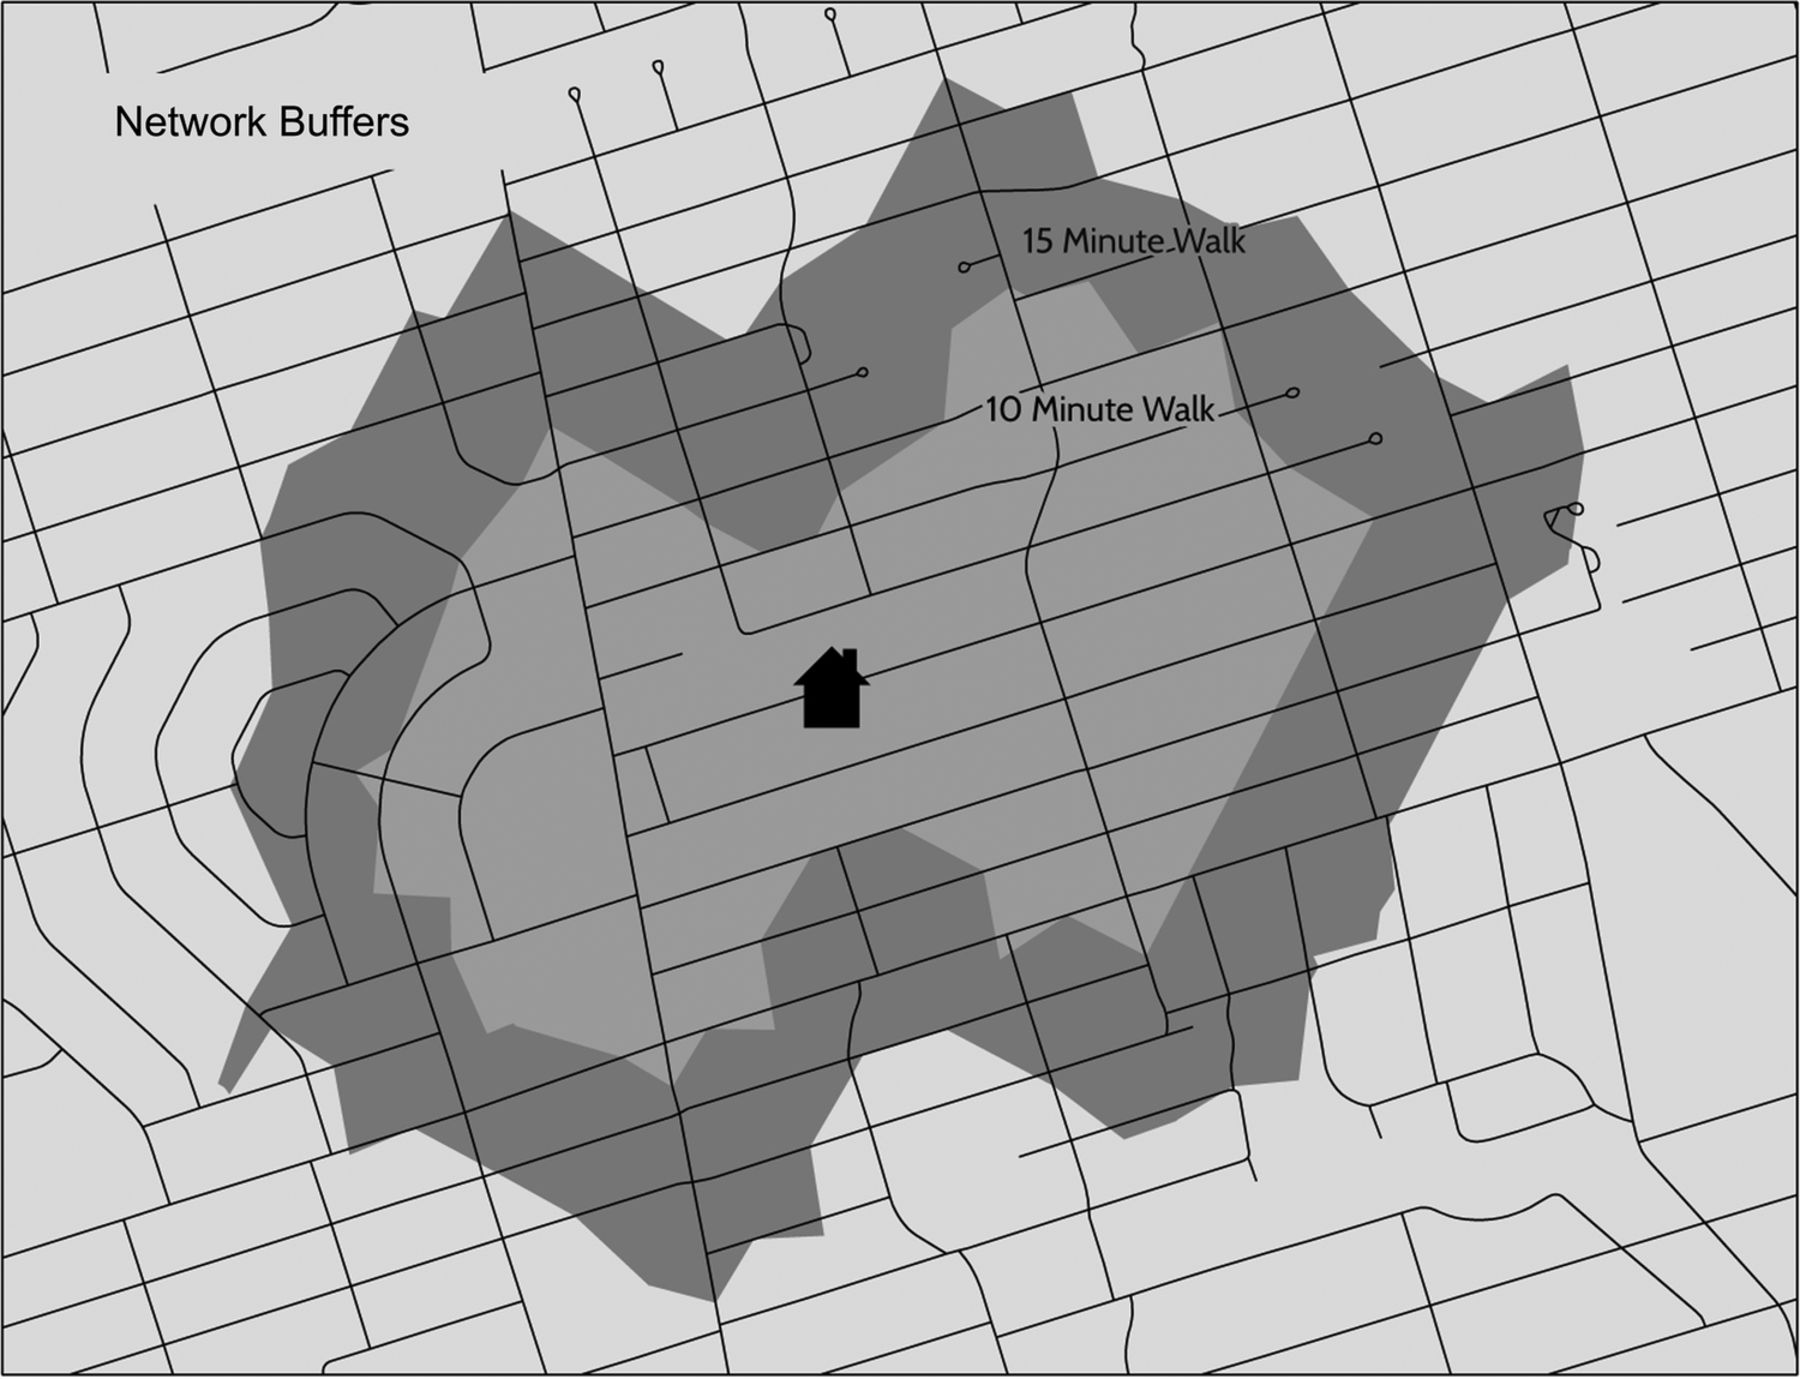
Geographic Information Systems (GIS) were used to characterise the food environment of our study area. Our measure of residential food outlet availability was created based on a review of GIS methods to measure food environments37 where density of food stores within a buffer around an individual's residence (constructed based on 10–15 min walking distances) is a commonly accepted measure. In a field study of walking speeds of the general adult population using mobile accelerometers,38 the median adult walking speed is 1.25 m/s (IQR=0.12), and speed declines with age at the rate of −0.0037 m/s per year between the ages of 20 and 60. However, speed was not significantly associated with other individual characteristics, including gender, BMI and blood pressure. Based on these results, we estimated buffers for distances that would be reachable in a 10 and 15 min walk from the residence of each participant. The buffers created for this study were based on network service areas around each respondent's homes. Network service area is the travelable distance created using street network data (figure 2).39–41 Densities for 10 and 15 min walking distance buffers were calculated in GIS for the number of fast food, less healthy and healthy food outlets in each of the participant's walking buffers.

Example of a network buffer for a 10 and 15 min walking radius.
Covariates
A number of individual level covariates are included in the models to adjust for potential confounding. The following categorical variables were examined: age (25–34, 35–44, 45–54 or 55–65), gender, marital status (married/common-law, or single), education (high school or less, some college, completed college), self-rated health (poor, fair, good, very good/excellent) and family income (quintiles). While ethnicity/race is examined in bivariate analysis (ie, white, black, south Asian, south-east Asian, West Asian or other), only visible minority status (ie, white vs others) was used instead of more detailed ethnicity categories in multivariable models due to cell size limitations.
Time spent at home
Individual level data collected from Project NEWH participants provided self-reported time spent at work and time spent sleeping, but not time spent at home. The average of time spent at home per day was estimated based on individual demographic characteristics and time spent at work using the 2010 Canadian General Social Survey (CGSS) through a multivariate regression model. This method was used to derive time spent at home, and was previously used in a peer-reviewed study.24 Data were extracted from the CGSS for adults age 25–65 in urban areas. Time spent at home (dependent variable) was modelled using the following independent variables: age, education level, income, gender, marital status, having children under 5, and minutes spent at work. All the above predictors were significantly associated with the time spent at home (p<0.01). The final model had an adjusted r2 of 0.40. β-coefficients from the regression using the CGSS data were used to estimate individual time spent at home for the Project NEWH participants. For example, starting with the intercept of 1325.15 min, (1) for every minute spent at work, 0.68 fewer minutes were spent at home, (2) females spent 37.34 more minutes at home compared to males, (3) persons with children under six years of age spent 30.93 more minutes compared to those without, etc. Finally, we subtracted out individuals’ sleep duration time from the total time at home because individuals have no chance of contact with their residential food environment while they are sleeping.
Statistical analysis
This analysis started by evaluating the bivariate relationships between predictors and the VFI outcome using (1) Kruskal-Wallis non-parametric one-way ANOVA to compare the mean VFI per day between the categorical predictors, and (2) χ2 test to compare the categorical predictors to the proportion of individuals that ate fruits and vegetables at least five times per day (see table 1). For multivariate multilevel modelling, we used the binary outcome (VFI at least five times per day vs not), because (1) the positive skew in the continuous outcome can impact model stability, and (2) this binary outcome has been used in previous models of the impact of individuals factors on VFI.31 ,32
Sample characteristics and associations between covariates, VFI and time spent at home in minutes (n=2411)
Since the data has a two-level structure, with individuals nested in CTs, multilevel logistic regression is used to account for the lack of spatial independence.42 To examine how time spent at home may moderate the relationship between residential food environment and VFI, the full sample was split into three equal subgroups—short, medium and long duration spent at home, for separate analysis. Eight models are described in this paper. Models 1a and 1b examine the full sample (n=2411). Models 2a and 2b examine the subgroup (n=804) that spends the least amount of time at home (0–6.5 h/day, mean=4.7 h); 3a and 3b examine the subgroup (n=804) that spends a medium amount of time at home (6.51–9.7 h/day, mean=8.0 h); and 4a and 4b examine the subgroup (n=803) that spends the highest amount of time at home (>9.7 h/day, mean=12.3 h). Models with the ‘a’ suffix calculates food outlet density using the 10 min walking distance network buffer, and models with the ‘b’ suffix uses the 15 min walking distance network buffer. All models were adjusted for the effects of gender, age, education, marital status, family income, self-rated health and visible minority status. The binomial outcome of ‘eating at least 5 fruits or vegetables’ is modelled using multilevel logistic regression with random intercept using PROC GLIMMIX in SAS 9.3.
Results
Participants in Project NEHW were 53% female and 44% visible minority, with a mean age of 44 years (table 1) and a mean after-tax family income of $91 330 (median=$71 000). The proportion of those having at least five VFI per day differed significantly by gender, age, education, employment status, marital status and income in bivariate analysis (p<0.05). The estimated time spent at home was significantly higher for females, the elderly, those with lower levels of education, those who are unemployed or not in the workforce, those who are divorced or separated and those in the lowest income brackets.
All models to follow have been adjusted for the effects of gender, age, education, self-rated health, marital status, visible minority status and family income. For models where we disregarded time spent at home, no significant associations were found between the food environment and VFI. This was true for food store density measured at scales of both 10 min and 15 min walking distances (see table 2—model 1a and 1b). Next, we conducted subgroup analyses where we divided the full sample of participants into three equal groups with different amounts of time spent at home (low, medium and high). For individuals who spent the least amount of time at home (models 2a and 2b), no significant associations were found between the food environment variables and VFI.
Multilevel logistic regression to examine the association between food environment (10 and 15 min walking distance network buffers) and the odds of eating five vegetables and fruits per day adjusting for gender, age, education, self-rated health, marital status, visible minority status and family income
For individuals who spent a medium amount of time at home, model results differed by buffer size. At the 10 min buffer, residents with zero less healthy food stores compared to those with three or more, had 38% increased odds (p<0.05) of having 5 or more VFI per day (model 3a). Within the 15 min buffer, individuals with three or more healthier food stores compared to those with zero, had 36% increased odds (p<0.05) of having 5 or more VFI per day (model 3b).
For individuals who spent the highest amount of time at home, model results also differed by buffer size. At the 10 min buffer, residents with access to three or more healthier food stores compared to those with none, had 29% increased odds (p<0.05) of having 5 or more VFI per day. In addition, residents with zero less healthy food stores compared with three or more, had 38% increased odds (p<0.05) of having five or more VFI per day (model 4a).
Within the 15 min buffer, residents with ‘two healthy food stores’ and ‘three or more healthy food stores’, compared with zero, had 61% increased odds (p<0.05) of having five or more VFI per day. In addition, residents with access to zero or one fast food store compared with three or more had 28% and 27% increased odds (p<0.05) of having five or more VFI per day, respectively (model 4b).
Discussion
In summary, the association between density of food stores in the residential food environment and VFI exists for subgroups who spend medium and long durations at home (ie, at least 6.5 h in addition to time spent sleeping), but no associations exist for people who spend the lowest amount of time at home. Also, no associations were detected in analyses using the full sample. A plausible explanation for these observations is that people who spend more time at home tend to make use of their local residential food outlets, while those who spend little time at home may purchase food elsewhere as they spend their day in other locations. This is an important finding since none of the previous studies have differentiated participants by duration of time spent at home; our study is the first to demonstrate that residential exposure duration may be an important missing variable to identify hidden population patterns. In this study, we show that adult time use can significantly vary across individuals and is a factor that can modify the food environment-VFI association. Given that there are no other similar studies of VFI that have accounted for time use, we cannot meaningfully compare our results to the associations found in other studies at this point. Our study highlights the importance of understanding the duration of residential exposure and this has implications for future data collection in the context of multilevel research of environmental effects on health.
In Thornton et al,28 employment status was examined for potential effect modification on the association between residential food environment and diet, since people not in the workforce spend more time at home compared to employed people.27 In other words, individuals not working may spend less time in the non-residential food environment. Thornton et al found that supermarkets within 2 km of the home were positively associated with vegetable intake, but employment status did not modify this association. In contrast, our study finds that the associations between food environment and VFI were significantly modified by time spent at home. While employment status is significantly associated with time spent at home according to the CGSS (2010)—where full-time workers, part-time workers and those without regular employment spend a mean of 887, 1021 and 1178 min at home, respectively (one-way ANOVA, p<0.01)—only 11.7% of the variance (η2) in time spent at home can be explained by employment status. Our regression-based estimation of time spent at home used multiple predictors, including (1) gender, (2) marital status, (3) age, (4) education, (5) parenthood status, (6) income and (7) time spent at work, which explained 40% of the variance in time spent at home (in the CGSS 2010 data). While Thornton et al did not find a significant effect modification by employment status, our study found an effect modification by time spent at home, which may be due to the technique used to estimate residential exposure.
Furthermore, our study illustrates that extending the network buffer from 10 min to 15 min walking distance has the effect of changing which predictors are significantly associated with VFI. Further research needs to be carried out on optimum buffer sizes to investigate access to the food environment. It should be noted that we did not have data on car ownership and thus, cannot ascertain the mode of transportation taken to their local food store.
This study has a number of limitations. First, quality and pricing data for supermarkets were not collected, both of which can affect customer shopping habits. For example, individuals may be within close proximity of a supermarket but may be unable to afford the groceries, or the quality of the fruits and vegetables may be poor. Second, the VFI outcome variable may be subject to self-reporting and social desirability bias.43 Our questions regarding VFI is based on the Canadian Community Health Survey 2010, and participants of our study reported the frequency per day of fruits and vegetables eaten rather than the number of servings consumed. The self-reported frequency measure may contribute to both under and over-reporting of food intake behaviour. As such, it is difficult to determine the actual VFI and make comparisons to Canada's Food Guide.31 Third, health-selected migration can occur when healthy individuals are attracted to healthier areas. Similarly, businesses may be more inclined to target neighbourhoods where people are perceived as living healthier lifestyles.44 Thus, there is a possibility for reverse-causation through the above processes. Fourth, this study is based on a cross-sectional observational design and direct causation for the observed associations cannot be verified except through future longitudinal studies. Fifth, there may be residential confounding that we did not consider in our study, beyond what could be captured by self-rated health such as the presence of specific medical conditions that may impact VFI, individual mobility issues or dietary preferences.
Future research on the effects of the neighbourhood food environment on diet should pay greater attention to adult time use and duration of exposure to various environments. Our study highlights the importance of ensuring adequate access to healthy food stores, especially in areas with vulnerable populations that spend significantly higher amounts of time within their residential neighbourhoods (eg, individuals who are unemployed or not in the workforce, elderly individuals and low-income individuals). Neighbourhood-based strategies that change the food environment may be especially beneficial to vulnerable populations that spend more time at home. Public health practitioners may find value in considering the amount of time residents spend at home and tailoring interventions to individual time-use patterns. Future research should consider time spent in non-residential and residential environments.
References
Footnotes
Contributors AC drafted the manuscript and conducted all the analysis. EF conducted geospatial and statistical analysis and compiled the data. AL performed the GIS processing and created the tables for geospatial analysis. TV collected and sorted the time-use data and drafted the methods section. AB, IS and TP drafted the literature and discussion components of the manuscript. KL compiled the grocery stores data. POC designed the original study and obtained the grant through CIHR for funding. AC, EF, AL, TV, AB, IS, TP, KL and POC interpreted the results and approved the manuscript.
Funding This study is supported by funding from the Government of Canada: Social Sciences and Humanities Research Council of Canada (SSHRC, grant No 410-2007-1099) and Canadian Institutes of Health Research (CIHR, grant No MOP-84439).
Competing interests None declared.
Ethics approval St Michael's Hospital, Toronto, Canada.
Provenance and peer review Not commissioned; externally peer reviewed.
Data sharing statement No additional data are available.