Article Text

Abstract
Objectives To report 10-year outcomes of virological and immunological treatment failure rates and risk factors.
Design Prospective cohort study.
Setting Shenzhen, China.
Participants 2172 HIV-positive adults in the national treatment database of Shenzhen from December 2003 to January 2014.
Intervention Antiretroviral therapy according to the Chinese national treatment guidelines.
Outcome measures Virological and immunological treatment failure rates.
Results Of the 3099 patients surveyed, 2172 (70.1%) were included in the study. The median age was 33 years; 78.2% were male and 51.8% were infected through heterosexual contact. The median follow-up time was 31 months (IQR, 26–38). A total of 81 (3.7%) patients died, whereas 292 (13.4%) and 400 (18.4%) patients experienced virological and immunological failures, respectively. Adjusted Cox regression analysis indicated that baseline viral load (HR=2.19, 95% CI 1.52 to 4.48 for patients with a baseline viral load greater than or equal to 1 000 000 copies/mL compared to those with less than 10 000 copies/mL) and WHO stage (HR=4.16, 95% CI 2.01 to 10.57 for patients in WHO stage IV compared with those in stage I) were significantly associated with virological failure. The strongest risk factors for immunological treatment failure were a low CD4 cell count (HR=0.46, 95% CI 0.32 to 0.66 for patients with CD4 cell counts of 50–99 cells/mm3 compared to those with less than 50 cells/mm3) and higher baseline WHO stage at treatment initiation (HR=2.15, 95% CI 1.38 to 3.34 for patients in WHO stage IV compared to those in stage I).
Conclusions Sustained virological and immunological outcomes show that patients have responded positively to long-term antiretroviral treatment with low mortality. This 10-year data study provides important information for clinicians and policymakers in the region as they begin to evaluate and plan for the future needs of their own rapidly expanding programmes.
- HIV
- antiretroviral
- virologic failure
- immunologic failure
- China
This is an Open Access article distributed in accordance with the Creative Commons Attribution Non Commercial (CC BY-NC 4.0) license, which permits others to distribute, remix, adapt, build upon this work non-commercially, and license their derivative works on different terms, provided the original work is properly cited and the use is non-commercial. See: http://creativecommons.org/licenses/by-nc/4.0/
Statistics from Altmetric.com
Strengths and limitations of this study
This study had large sample sizes and 10 year durations of follow-up.
This was the first study to assess outcomes of China's National Free Antiretroviral Treatment Programme in Shenzhen.
This observational study had potential inherent biases, such as follow-up bias.
Missing data existed in a cohort study.
Medication adherence was hardly measured.
Introduction
In China, the number of people infected with HIV is 740 000 in estimation.1 Among these, a cumulative 436 817 people living with HIV/AIDS had been identified up to December 2013, including 173 825 people with AIDS.2 Since the China National Free Antiretroviral Treatment Programme (NFATP) was established in 2003, the remarkable acceleration in treatment has been obvious.3 ,4 By December 2013, more than 278 000 people have received first-line highly active antiretroviral therapy (HAART). Along with the increasing treatment coverage, overall mortality rates have fallen from 39.3 deaths per 100 person-years in 2000 to 14.2 deaths per 100 person-years in 2009.5 ,6 All HIV-infected individuals who meet the national treatment criteria are eligible to receive treatment, and treatment has been implemented in all 31 provinces, autonomous regions and municipalities in China.7 ,8
The limitations of previous studies reporting the effects of HAART in developing countries were the relatively small sample sizes or short durations of follow-up.9–16 Fortunately, our study reports the 10-year outcomes of virological and immunological treatment failure rates and their associated risk factors for all adult patients enrolled in the NFATP in Shenzhen.
Methods
Patients and treatment regimens
This study was approved by the Institutional Review Board of the Nanjing Medical University. All patients were registered in the NFATP of Shenzhen and the observational database from December 2003 to January 2014. In accordance with Chinese policy, all HIV-positive patients who met the national treatment guidelines of a CD4 cell count less than 350 cells/mm3 (<200 cells/mm3 before 2008) or WHO stage III or IV disease were eligible to receive antiretroviral treatment (ART).17 ,18 Excluded patients were not previously naive to ART, had a duration of ART lasting less than 6 months, were younger than 18 years at treatment initiation, had not initially received the appropriate triple therapy, or had missing initial treatment dates. To evaluate the outcomes, patients without baseline CD4 cell and plasma viral load or without at least one follow-up CD4 cell and plasma viral load were also excluded.
Treatment procedures were conducted in accordance with the Chinese National Free HIV Antiretroviral Treatment Guidelines.17 ,19 The first-line regimen was a combination therapy of two nucleoside reverse transcriptase inhibitors and one non-nucleoside reverse transcriptase inhibitor, which consisted of lamivudine (3TC), zidovudine (AZT), stavudine (d4T), didanosine (ddI), tenofovir (TDF), nevirapine (NVP) and efavirenz (EFV). After the national antiretroviral treatment guidelines were updated in 2008, ART failure participants were generally switched to a second-line regimen including TDF, 3TC and lopinavir/ritonavir (LPV/r).
Patient visits and data collection
After treatment initiation, follow-up visits were scheduled at half, 1, 2 and 3 months, and once every 3 months thereafter. Risk factors consisted of demographic characteristics, laboratory results and current symptoms. The following baseline laboratory tests were carried out: chemistry, haematology, CD4 cell count, plasma HIV RNA level, hepatitis B surface antigen and hepatitis C antibody. Survival time was defined from the date of ART initiation until death or the date of the last follow-up. Moreover, the patient missing four consecutive follow-up appointments was identified lost to follow-up and the termination date when the treatment termination form was completed was regarded as the date of the last follow-up.
Definitions
For the analysis of virological and immunological treatment failure and CD4 cell count response, we included viral load and CD4 cell count only from patients with one or more follow-ups. We defined immunological treatment failure using the following WHO criteria: CD4 cell count less than 100 cells/mm3 after receiving treatment for 6 months, CD4 cell count at or below pretreatment level after receiving treatment for 6 months, or CD4 cell count less than 50% of peak on-treatment level.20 We considered treatment as having failed for patients who met any of these criteria. Virological failure was defined as a viral load of 1000 copies/mL.20 Time to failure was the time from treatment initiation date to the date when the patient met the failure criteria.
Statistical analysis
The Mann-Whitney test defined the significant continuous variables whose distributions were not normal. The Pearson χ2 statistic tested dichotomous and categorical variables. For the assumption of proportionality, the Log-rank test was applied to test the survival rate between groups. The Cox model assessed the HRs of potential risk factors. Multivariate Cox models were constructed by clinically significant variables. The above analysis was completed by Stata V.12.0 (StataCorp, College Station, Texas, USA). All hypothesis testing was two-sided, with an α level of 0.05.
Results
Of the 3099 patients with AIDS/HIV from the NFATP database of Shenzhen in January 2014, 927 were excluded (see online supplementary figure S1). Of the remaining patients, 81 died (78.8% of these deaths were AIDS related). The median follow-up time was 31 months (IQR, 26–38), with a median of 15 follow-up visits (IQR, 11–20). The median age was 33 years; 78.2% of patients were male, 49.3% were married, 82.8% received a middle school level of education, 24.8% were engaged in commercial service and 51.8% were infected through heterosexual contact (table 1). The baseline median CD4 cell count was 168 cells/mm3 (IQR, 71–242), and 19.5% of patient cell counts were less than 50 cells/mm3. The median baseline plasma viral load was 162 000 copies/mL (IQR, 42 200–467 750), and 62.5% of the patients' viral load were 100 000 cells/mm3 or above. The baseline median haemoglobin, alanine aminotransferase (ALT) and aspartate transaminase (AST) were 140 g/L, 22 U/L and 24 U/L, respectively. At baseline, 33.4% of patients were in WHO clinical stage IV, 13.2% were hepatitis B virus (HBV) positive and 4.8% were hepatitis C virus (HCV) positive.
Baseline patient characteristics stratified by virological and immunological failure
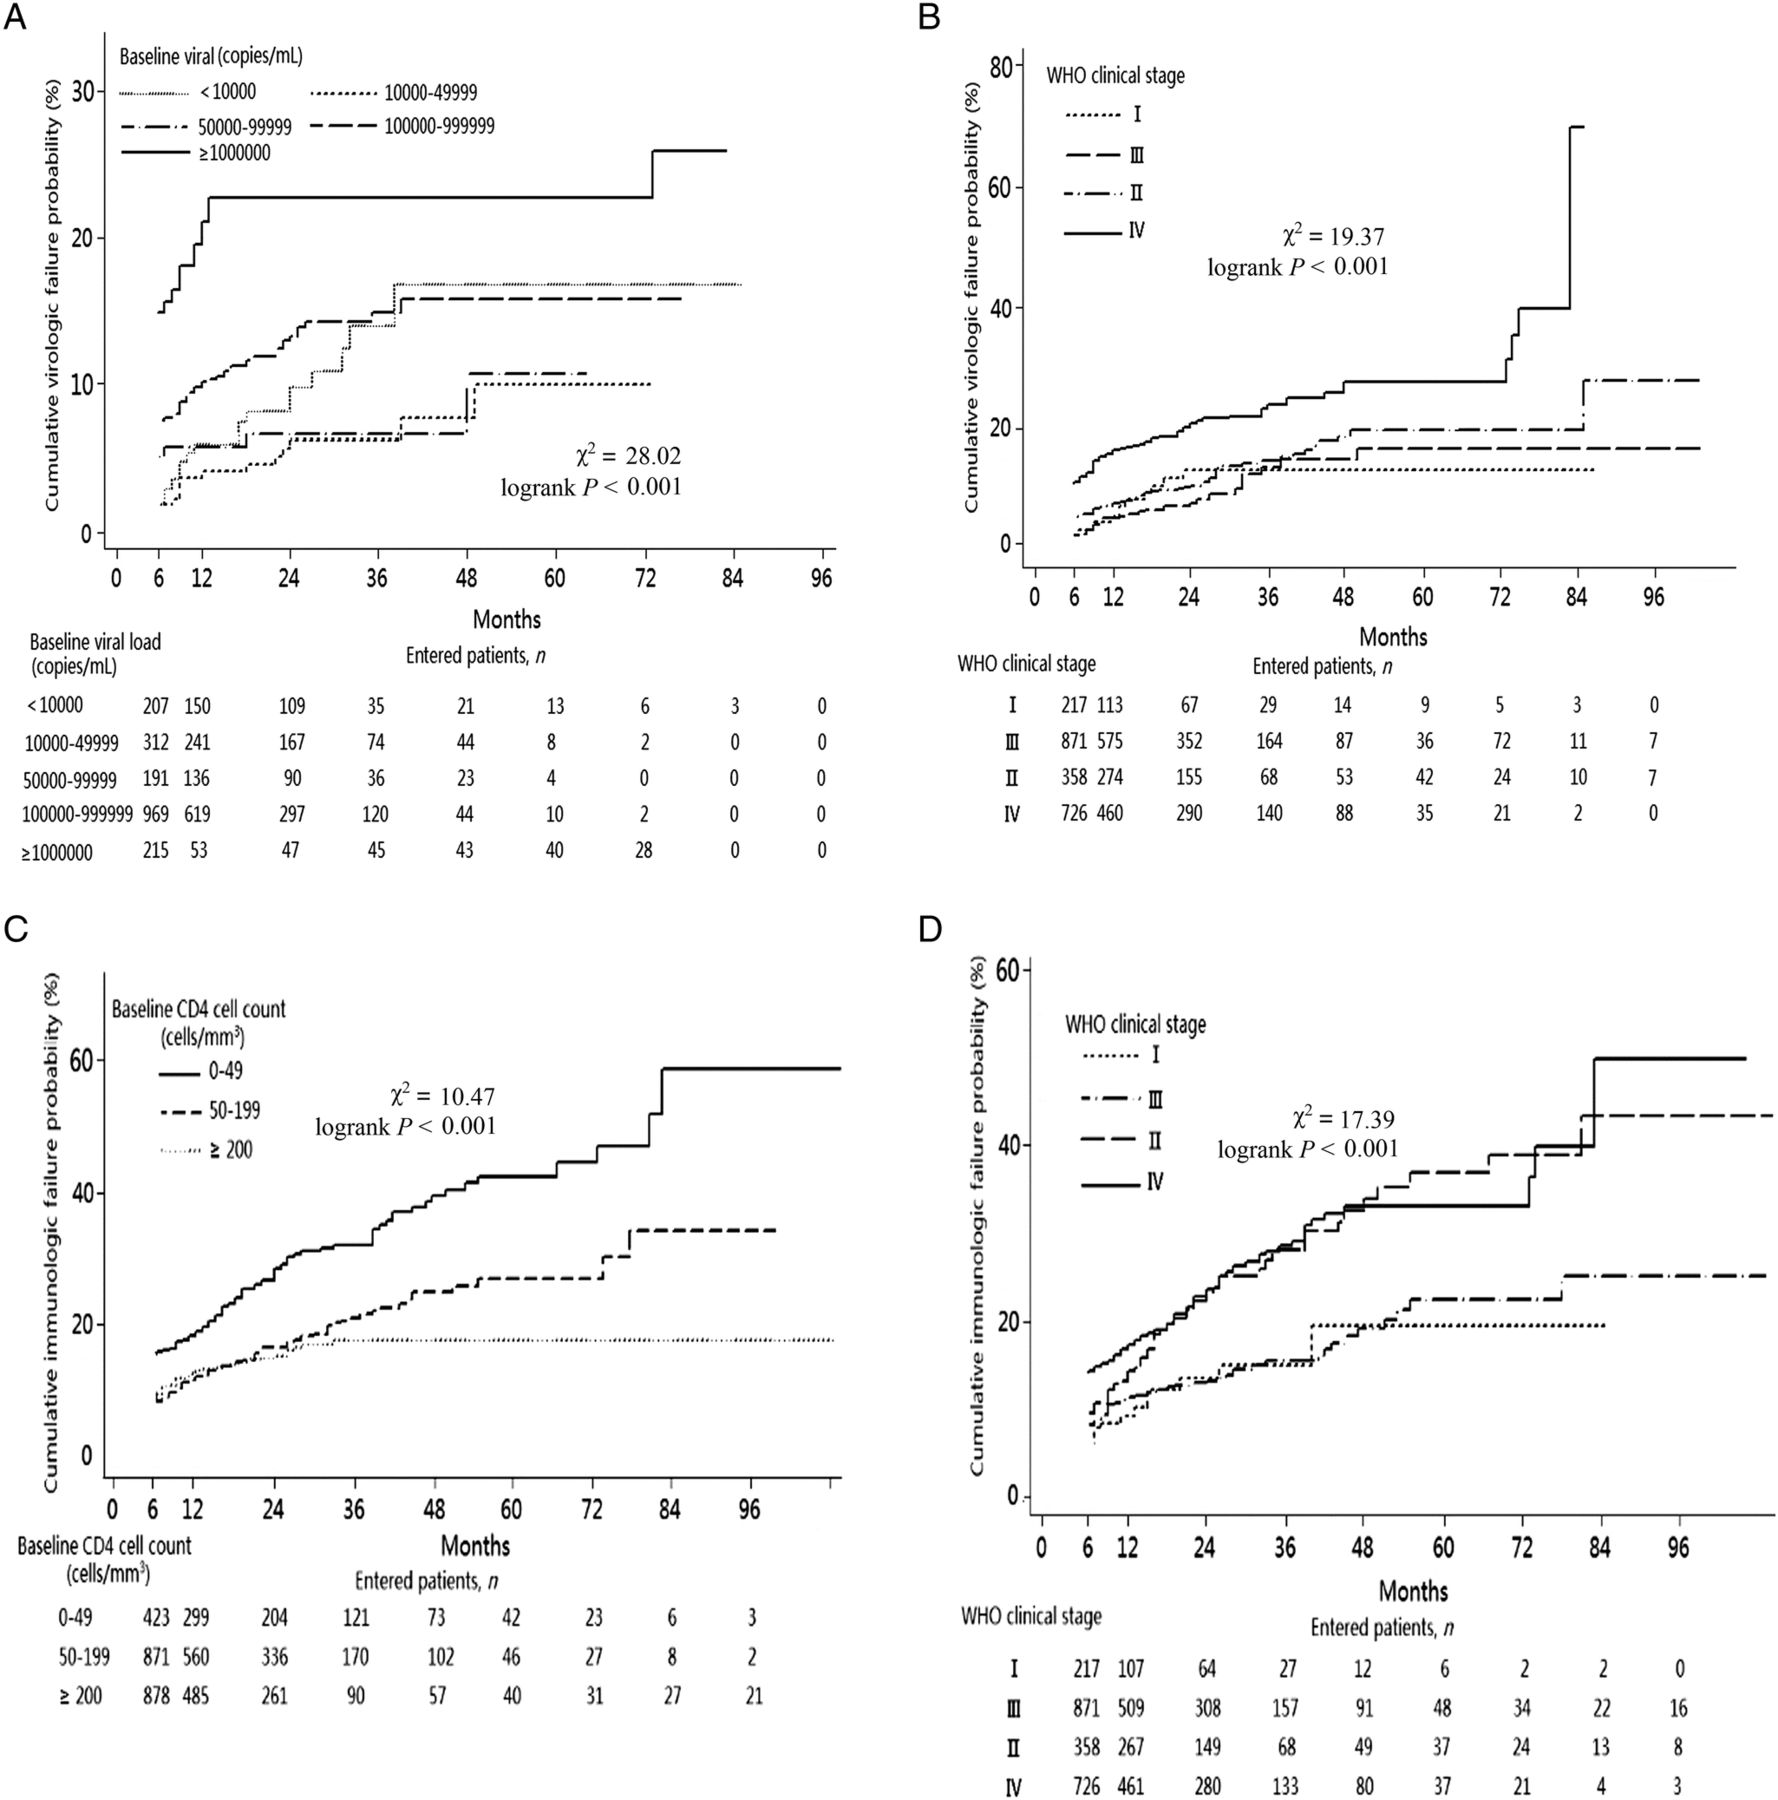
Virological and immunological treatment failure rates evaluated the outcomes. A total of 292 (13.4%; 95% CI 12% to 15%) patients met the definition for virological treatment failure. The median follow-up plasma HIV RNA level count was 8 (IQR, 4–11). Patients with virological failure were generally those with higher baseline viral loads or higher baseline WHO stages (p<0.001; table 1). The cumulative proportion of patients experiencing virological failure increased over time from 6.7% at 6 months to 31.5% at 96 months (see online supplementary figure S2). Adjusted Cox regression showed that those infected through intravenous drug use were more likely to experience virological failure (HR, 2.09; 95% CI 1.05 to 4.17; p<0.001) compared with those infected by heterosexual contact. Those with a baseline viral load greater than or equal to 1 000 000 copies/mL had an adjusted HR of 2.19 (95% CI 1.52 to 4.48; p<0.001) compared with those with a viral load less than 10 000 copies/mL (table 2). Patients with WHO clinical stage IV had an adjusted HR of 4.16 (95% CI 2.01 to 10.57; p<0.001) compared with those with stage I. The cumulative percentage of patients who experienced virological treatment failure was indicated by the baseline viral load (figure 1A) and WHO clinical stage (figure 1B). The results indicated that higher baseline viral load and WHO clinical stages were both significant predictors of virological failure (log-rank p<0.001).
Rates and risk factors for virological and immunological failure by cox proportional hazards regression

Outcome of virological and immunological treatment. (A) Cumulative virological failure rate, stratified by baseline viral load. (B) Cumulative virological failure rate, stratified by baseline WHO clinical stage. (C) Cumulative immunological failure rate, stratified by baseline CD4 cell count. (D) Cumulative immunological failure rate, stratified by baseline WHO clinical stage.
To understand treatment outcomes further, we identified patients with at least one follow-up CD4 cell count and analysed their immunological treatment failure rates and CD4 cell count responses. The median follow-up periods for CD4 cell count was 11 months (IQR 5-17) and 23 months (IQR 15–29).
Of the 2172 patients, 400 (18.4%; 95% CI 16.8% to 20.1%) were immunological treatment failures. They were more likely to be older and to have lower baseline CD4 cell counts or higher baseline WHO stage (p<0.001; table 1). The cumulative proportion of patients for whom treatment failed increased over time from 10.3% at 6 months to 35.7% at 96 months (see online supplementary figure S3). Adjusted Cox regression suggested that the strongest risk factors for immunological treatment failure were a low CD4 cell count and higher baseline WHO stage at treatment initiation. Those with CD4 cell counts of 50–99 cells/mm3 had an adjusted HR of 0.46 (95% CI 0.32 to 0.66; p<0.001) and those with CD4 cell counts of 100–199 cells/mm3 had an adjusted HR of 0.53 (95% CI 0.41 to 0.70; p<0.001) compared to those with CD4 cell counts of less than 50 cells/mm3 (table 2). Patients in WHO stage IV had an adjusted HR of 2.15 (95% CI 1.38 to 3.34; p<0.001) compared to those in stage I. The cumulative percentage of patients who experienced immunological treatment failure was shown by the baseline CD4 cell count (figure 1C) and WHO clinical stage (figure 1D). Cumulative percentages of immunological failure at 6, 12, 36, 60 and 96 months were 15.8%, 19%, 32%, 42.5% and 58.8% for patients with baseline CD4 cell counts of <50 cells/mm3, and 9.5%, 13%, 17.7%, 17.7% and 17.7% for patients with baseline CD4 cell counts ≥200 cells/mm3. Meanwhile, the cumulative percentages of immunological failure for patients in baseline WHO clinical stage I at 6, 12, 36, 60 and 96 months were 6%, 9.2%, 15%, 15% and 15% vs 14.3%, 17.5%, 28.6%, 33.1% and 50% for patients in stage IV. Advanced immunosuppression and WHO clinical stage were both significant predictors of immunological failure (log-rank p<0.001).
The mean CD4 cell count response over time demonstrated the contrast between the immunological treatment success and failure cohorts: CD4 cell counts in the immunological success group continued to increase over time, whereas counts in the immunological failure group rapidly increased to 315 cells/mm3 at 36 months but stabilised at this level thereafter (figure 2A). The mean CD4 cell count for patients with baseline CD4 cell counts of greater than or equal to 200 cells/mm3 increased to 395, 435, 407 and 436 cells/mm3 at 12, 36, 60 and 96 months, but patients with less than 50 cells/mm3 peaked at 349 cells/mm3 for the full period of observation (figure 2B).

CD4 cell count response after antiretroviral treatment (ART) initiation. (A) Median (IQR) CD4 cell count increase from ART initiation, stratified by immunological success and failure. (B) Median (IQR) CD4 cell count increase from ART initiation, stratified by baseline CD4 cell count.
Discussion
The NFATP in China faces many difficulties and challenges, especially severe resource limitations. Efforts have been made to manage and treat such a large number of patients over a wide area, including monitoring CD4 cell counts and viral load, training rural healthcare workers and expanding HIV care and treatment.3 ,19 In this study, 2172 previously ART-naive adult patients with AIDS/HIV undergoing treatment from December 2003 to January 2014 in Shenzhen are included to evaluate the outcomes of treatment. Most notably, the rates of immunological and virological treatment failure increased over time to more than 30% at 96 months in the absence of readily available second-line treatment options. However, an interesting phenomenon was that death information was available for only 81 patients, whose mortality rate was largely lower than 13%, a result from a previous national study.12 The first reason was that the situation of 238 patients who withdrew or were lost to this follow-up was perhaps more serious than that of the included patients. Another reason was that of 905 patients excluded from the study, 56 died during the follow-up. This study may underestimated the mortality rate, and the related risk factors about death need to be analysed in further study.
In this study, immunological treatment outcomes illustrate increasing failure rates over time without wide second-line treatment options. Many studies of treatment outcomes bypass treatment failure rates and report only changes in CD4 cell count over time.21 The WHO criteria in defining immunological treatment failure can guarantee comparability with other cohorts; however, our results are still different from the national outcomes studied in 2009.12 The cumulative immunological failure rate nationwide was approximately 50% at 5 years, which was much higher than ours. One vital reason may be that in the economically advanced city of Shenzhen, patient demographics such as education level and healthcare factors such as the number of follow-up visits or medical levels performed by related workers are prior to those in the whole country. Although immunological criteria for treatment failure is less sensitive and specific than virological criteria, the failure rate of this study was fairly reliable, with median times of 11 CD4 cell counts per patient during follow-up compared to only three times in a previous study.12 Further analysis of risk factors indicated that the patients who were most immunosuppressed and had higher WHO stages at baseline tended to experience immunological failure, similar to other studies.11 ,22 Meanwhile, there was a sharp contrast between the CD4 cell count responses of the immunological treatment failure and success cohorts, and among groups with different baseline CD4 cell counts. Thus, baseline CD4 cell counts and WHO stages may predict immunological outcomes, which may be useful for other resource-limited settings.
In our study, virological outcomes were consistent with those of others in which the virological failure rate of ART in developing countries worldwide ranged from 10% to 28% at 6 months, 14% to 50% at 12 months and 29% at >24 months.23–26 In multivariate model, virological outcome was mainly associated with baseline viral load and WHO stage, similar to other studies.26 ,27 Owing to constraints of costs and technology, monitoring plasma viral load, a standard practice in developed countries, was not recommended in low-income countries. Viral load testing could be of increasing importance in guiding clinical decisions on how to perfect the duration of the first-line treatment regimen and on when to divert to second-line treatment. Previous study clinical and immunological criteria were poor predictors of virological outcome. Treatment failure based only on clinical and immunological factors may lead to some patients switching to second-line regimen at an inappropriate time, which may cause higher mortality and drug resistance.28 ,29
Our study has several limitations. First, observational study had potential inherent biases. Data were collected by healthcare providers who had different opinions facing the same situation. In addition, it was inevitable that missing data existed in a cohort study. However, the data were a reflection of treatment realities. Second, medication adherence associated with treatment failure was hardly measured.30 Although the number of missed doses in the previous 7 days was used to evaluate medication adherence, the data were inaccurate and vastly missing during the follow-up. Finally, in this study, opportunistic infections data were also excluded for further analysis. With the difficulty in definitively diagnosing opportunistic infections, it was not precise in using easily identified signs and symptoms as a proxy.
In summary, through this 10-year study of 2172 ART adults receiving treatment, we find that the immunological and virological failure rates were slightly high, but the mortality rate was quite low. The outcomes of treatment and potential risk factors may provide important information for clinicians and policymakers in the region as they begin to evaluate and plan for the future needs of their own rapidly expanding programmes.
References
Supplementary materials
Supplementary Data
This web only file has been produced by the BMJ Publishing Group from an electronic file supplied by the author(s) and has not been edited for content.
- Data supplement 1 - Online figures
Footnotes
PH and JT contributed equally to this work.
Contributors PH, ZP and HZ performed the experiments. PH, JT and WM analysed the data. JT and YL contributed reagents/materials/analysis tools. PH and JT were involved in writing of the manuscript. ZP and RY conceived and designed the whole research, provided the funding and were responsible for the project. NW, ZP and RY designed the epidemiological researches.
Funding This work was supported in part by the Natural Science Foundation of China (grant numbers 81001288, 11171268), National S&T Major Project Foundation of China (grant number 2012ZX10001-001), Priority Academic Programme Development of Jiangsu Higher Education Institutions (PAPD).
Competing interests None declared.
Patient consent Obtained.
Ethics approval Institutional Review Board of the Nanjing Medical University.
Provenance and peer review Not commissioned; externally peer reviewed.
Data sharing statement No additional data are available.