Article Text

Abstract
Objectives To evaluate the individual and interacting impacts of the continuous variables (age, total cholesterol (total-C), high-density lipoprotein cholesterol (HDL-C) and systolic blood pressure(BP)) on 10-year atherosclerotic cardiovascular disease (ASCVD) risk and better understand the pattern of predicted 10-year risk with change of each variable using recently published new pooled cohort equations.
Design Simulation analysis was performed across the whole range of the boundary limits suggested for the continuous variables for groupings based on race and gender in the pooled cohort 10-year risk equations.
Setting Computer-based simulation analysis.
Participants Data were generated by simulation using prespecified variable ranges.
Intervention Data simulation and visual display of the hazard analysis.
Main outcome measures Interactions of age with other variables were analysed using multidimensional visualisation and hazard analysis.
Results In African–American females, due to the interaction of age with HDL-C, treated BP and untreated BP, increasing age may not always increase 10-year risk. Furthermore, in the same cohort, increasing HDL-C level may result in higher 10-year risk for older individuals. For Caucasian females, due to square of Ln (age) term in the equation, the age-risk curve does not monotonically increase with age. The vertex is within the given age range of 40–79 years for a certain range of total-C and HDL-C, indicating that age may not always result in increased predicted 10-year risk.
Conclusions The new pooled cohort equations are sophisticated as they take into account the interactions of the continuous variables in predicting 10-year risk. We find situations where the estimated 10-year risk does not follow the general secular trends. The impact of such interesting patterns may be substantial and therefore further exploration is needed as it has direct implications in clinical management for primary prevention.
- PREVENTIVE MEDICINE
This is an Open Access article distributed in accordance with the Creative Commons Attribution Non Commercial (CC BY-NC 4.0) license, which permits others to distribute, remix, adapt, build upon this work non-commercially, and license their derivative works on different terms, provided the original work is properly cited and the use is non-commercial. See: http://creativecommons.org/licenses/by-nc/4.0/
Statistics from Altmetric.com
Strengths and limitations of this study
Our paper provides a novel approach for understanding complex equations. With increasing emphasis on evidence-based medicine, these complexities are more likely to be encountered on a routine basis. Our paper outlines a visual approach for understanding these complex mathematical equations that may not be readily apparent to clinicians or researchers.
On the basis of our analysis of the risk equations, we find certain unexpected behaviours/paradoxes in the risk equations. This aspect is most pronounced in Caucasian females where the age-risk curve is parabolic, indicating that for certain values of the variables, the relationship of 10-year risk with age is uncertain. This has direct implications in clinical management for primary prevention in this population grouping. Our paper therefore highlights aspects of the risk equations that are not readily apparent and provides a rationale for further refinement of these equations in the future.
We performed the simulation based on the pooled cohort equations and range of allowable input values for the variables. The study was limited in that we did not have access to the clinical data set that formed the basis of formulation of the new pooled cohort risk equations for estimating 10-year risk.
Introduction
The recent guidelines for prevention of atherosclerotic cardiovascular disease (ASCVD) events using the new pooled cohort equations for 10-year risk calculation and subsequent management strategies are expected to have a major impact on clinical practice and public policy.1 ,2 For the primary prevention, the risk equations were formulated based on five contemporary longitudinal epidemiological studies with subsequent internal and external validation.1 Gender-specific and race-specific proportional hazards models were used to develop risk estimates. These models included covariates of age, treated or untreated systolic blood pressure (SBP), total cholesterol (total-C), high-density lipoprotein cholesterol (HDL-C), current smoking and diabetes. The final model also contained the interactions of age with other variables that are significant. Receiver operating curve for discrimination and calibration χ2 statistics were performed to evaluate the model's goodness of fit. When the risk equations were applied to National Health and Nutrition Examination Surveys (NHANES, 2007–2010), approximately 45% of the population (or 45 million people) between the ages of 40 and 79 years had 10-year risk of 5% or more.1 Based on the guidelines, this substantial population would be considered eligible for statin therapy.2
There have been concerns about the robustness of risk estimates using the new pooled cohort equations. The authors of the guidelines have noted that there is overprediction of events in all the external validation groups.1 Consistent with these observations in the guidelines, analysis by Ridker and Cook,3 who calculated the 10-year ASCVD risk using the same equations but different population cohorts, found that the new pooled cohort equations systematically overestimated the 10-year risk. Another concern that has been raised was that the older population virtually exceeded the threshold limits for statin therapy regardless of other risk factors.2 ,3 Pencina et al4 recently reported that the number of adults eligible for statin therapy based on the new 10-year risk guideline would increase by 12.8 million; these were mainly older adults without cardiovascular disease.
Owing to the interactions of age with other variables in the risk equations, the impact magnitude of each variable on the 10-year risk estimation is not immediately obvious. To better understand the pattern of the predicted 10-year risk with change of each variable, we evaluated the individual and interacting impacts of age, total-C, HDL-C and SBP on the estimated 10-year risk for different cohorts.
Materials and methods
Using the age range of 40–79 years, total-C range 130–320 mg/dL, HDL-C 20–100 mg/dL and SBP 90–200 mm Hg, as defined in the guideline, simulations were performed on the pooled cohort equations to estimate 10-year risk for African–American males and females, and Caucasian males and females, respectively, in Matlab (2013b, MathWorks, Massachusetts, USA). The HRs for each individual variable and interaction term of the equations were computed as eβ, where β was the coefficient of the term provided in the online supplementary appendix 4 of the guidelines.1 ,5
Interactions of age with other variables were analysed using the HR and further visualised using Matlab visualisation tool (2013b, MathWorks, Massachusetts, USA). Simulation was performed according to the risk equation for each cohort, by varying one variable of interest at a time, while fixing all the other variables. All variables were ranged within the limits defined by the guideline. For African–American females, there were significant interactions of age with HDL-C and SBP. With fixed total-C, simulation was performed by varying age, HDL-C and SBP, respectively. Three-dimensional colour-coded figures incorporating age, HDL-C, SBP and simulated 10-year risk were plotted. For Caucasian males and females, age was significantly interacting with total-C, HDL-C and current smoking status. With fixed SBP, simulation was performed by varying age, HDL-C and total-C, respectively. Three-dimensional colour-coded figures incorporating age, total-C, HDL-C and simulated 10-year risk were plotted for smokers and non-smokers, respectively. Since there were no variables significantly interacting with age in the African–American males cohort, the impact of each variable to the estimated 10-year risk was straightforward, based on its coefficient. Therefore, interaction analysis is not provided for this cohort in the current study.
Results
The coefficient and HR of each variable itself and its interaction with age (if available) in the new pooled cohort equation for each population is presented in table 1.
HR of the new pooled cohort equations
For African–American females, individual SBP (treated or untreated) has the highest HR to the estimated 10-year risk, indicating the biggest impact to 10-year risk among all variables. However, SBP significantly interacted with age in a negative fashion (untreated β=−6.09; treated β=−6.43). Considering that age also significantly interacted with HDL-C in a positive fashion (β=4.48), in cohorts with higher HDL-C levels, SBP per unit has a higher impact to the 10-year risk in older age compared with younger age (indicated by black arrows in figure 1). This pattern was reversed in cohorts with lower HDL-C level, where SBP per unit has a lower impact to the 10-year risk in older age than younger age (indicated by blue arrows in figure 1). Furthermore, age by itself had the second highest impact to the estimated 10-year risk (table 1) compared with SBP. Owing to the interaction with SBP and HDL-C, in cohorts with lower HDL-C level and higher SBP, we noted paradoxical behaviour where older age had a lower estimated risk compared with younger age, as indicated by the dashed red arrow in figure 2. Boundary limits to observe this behaviour shifted for different total-C level and smoking or diabetes status. For example, for the non-diabetic, non-smoking population cohort with total-C of 130 mg/dL, when HDL-C was around 20 mg/dL and SBP was above 155–160 mm Hg, the 10-year risk was decreasing with ageing. As HDL-C increased, this inconsistent behaviour was only noted at higher SBP level. As HDL-C levels reached above 30 mg/dL, the behaviour was no longer observed within the variable ranges defined in the guideline. Another interesting observation we made for this cohort was related to the relationship of HDL-C and estimated 10-year risk. HDL-C by itself had a negative impact on 10-year risk (β=−18.92), that is, increasing HDL-C generally resulted in lower 10-year risk. However, due to the interaction with age, when age was >69 to70 years, increasing HDL-C would paradoxically increase 10-year risk (indicated by dashed green arrow in figure 3).

Illustration of interaction among age, systolic blood pressure (BP) and high-density lipoprotein cholesterol (HDL-C) in terms of their combined impact to 10-year risk. Systolic BP per unit has a bigger impact on the 10-year risk in older individuals ( ) than younger individuals (
 ) at higher HDL-C levels. This pattern reverses at lower HDL-C levels, that is, systolic BP per unit has a bigger impact on the 10-year risk in young individuals (
 ) than in older individuals (
 ) at low HDL-C levels. Note that smoking status, diabetic status and total cholesterol levels are independent variables in the African–American female cohort—changing these variables would not affect the interaction pattern of systolic BP, age and HDL-C; a similar pattern holds true for treated systolic BP.

Illustration showing that when individuals have high-density lipoprotein cholesterol (HDL-C) around 20 mg/dL and systolic blood pressure (BP) above 155–160 mm Hg, predicted 10-year risk would decrease with ageing ( ). As HDL-C level increases, similar scenarios would only hold true at higher systolic BP level. However, when HDL-C is above 30 mg/dL, ageing would increase 10-year risk regardless of systolic BP levels (
 ).
).

Illustration showing that when age of individuals is above 69–70 years, increasing HDL-C will increase the estimated 10-year risk ( ); when age is below 68 years, increasing HDL-C will decrease the estimated 10-year risk (
 ), (BP, blood pressure; HDL-C, high-density lipoprotein cholesterol).
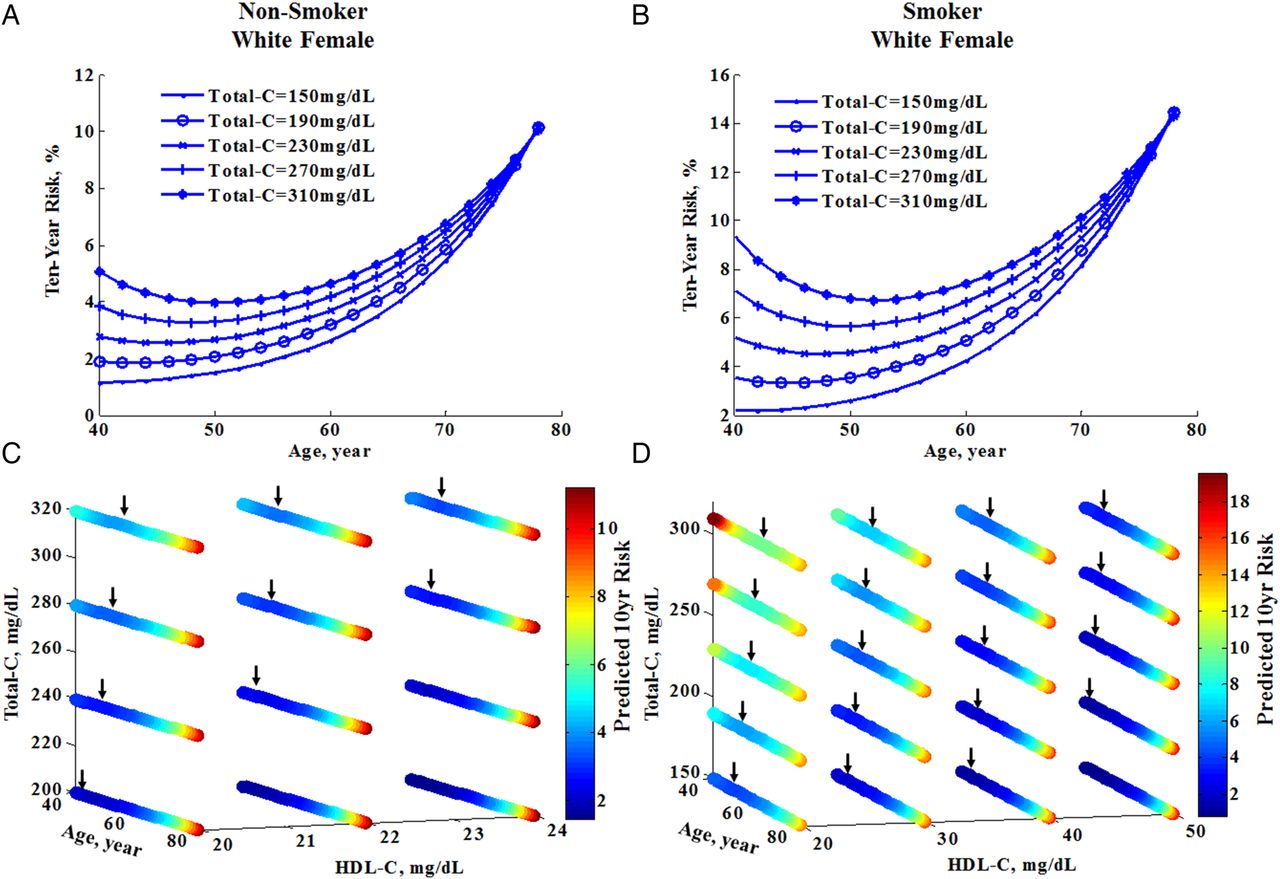
For Caucasian females, an intriguing aspect of the cohort equation was the use of square of Ln (age) term, which was not present for any other cohorts. Owing to square of Ln (age) term, the predicted risk did not always follow conventional rules and increasing age may not always be associated with increasing risk. In general, the age-risk curve did not monotonically increase with age. Instead, the predicted 10-year risk decreased with increasing age until it reached a minimum, and then increased again. Since age also significantly interacted with total-C (β=−3.11) and HDL-C (β=3.15), this relationship was not apparent within the given age range for all total-C or HDL-C levels. Figure 4A (non-smoker) and B (smoker) illustrate examples of this relationship between age and 10-year risk at a range of total-C levels at SBP=90 mm Hg and HDL-C=20 mg/dL for non-smokers and 30 mg/dL for smokers. In general, the minimum (indicated by the black arrow in figure 4C,D) of the paradoxical relationship would be within the given age range for HDL-C<25 mg/dL and total-C≥200 mg/dL for non-smokers (figure 4C) and HDL-C≤50 mg/dL and total-C≥150 mg/dL for smokers (figure 4D).

Depiction of the interaction of age with other variables on the predicted 10-year risk in White female cohort that are non-diabetic, on no treatment for hypertension and systolic BP of 90 mmHg. (↓) A (non-smoker) and B (smoker) illustrate the non-linear relationship between age and 10-year risk at various total-C levels when SBP is 90 mmHg and HDL-C is 20 mg/dL for non-smoker and 30 mg/dL for smoker. C (non-smoker) and D (smoker) depict that the minimum (pointed out by arrow) of the paradoxical relationship is within the given age range when HDL-C<25 mg/dL and total-C≥200 mg/dL for non-smokers and HDL-C≤50 mg/dL and total-C≥150 mg/dL for smokers. Note that, diabetes and systolic BP level are independent variables in female White cohort, changing these variables would not affect the interaction pattern of age, total-C and HDL-C; similar pattern holds true for treated systolic BP. Total-C, total cholesterol; HDL-C, high-density lipoprotein cholesterol; BP, blood pressure.
For African–American males and for Caucasian males, we did not observe any paradoxical patterns of the risk equations within the proposed ranges for the variables. For African–American males, none of the variables had significant interaction with age in the final model; therefore, the impact of each variable to the 10-year risk was clearly indicated by their coefficients and HRs. For Caucasian males, age had significant interaction with total-C, HDL-C and current smoking status, as described in table 1. Figure 5 demonstrates the interactions of age, total-C and HDL-C in non-smokers (A) and smokers (B) in terms of their combined impact to the 10-year risk. No paradoxical patterns were observed in this cohort with variable ranges.

Depiction of the interactions of age with other variables on the predicted 10-year risk in members of the White male cohort who are non-diabetic, on no treatment for hypertension and who have a systolic blood pressure (BP) of 90 mm Hg, and who are non-smokers (A) and smokers (B). No paradoxical patterns were observed in this cohort with variable ranges. Note that diabetes and systolic BP level are independent variables in this White male cohort—changing these variables would not affect the interaction pattern of age, total cholesterol (total-C) and high-density lipoprotein cholesterol (HDL-C); a similar pattern holds true for treated systolic BP.
Discussion
Our analysis of the new pooled cohort risk equations highlights important aspects that are of direct clinical relevance. These include:
For African–American females, increased age may not always result in increased 10-year risk. Furthermore, increasing HDL-C level may result in higher 10-year risk for older age.
For Caucasian females, the age and 10-year risk relationship is parabolic and the vertex is within the given age range of 40–79 years for a certain range of total-C and HDL-C levels. This implies that age may not always result in increased predicted 10-year risk.
The new pooled cohort equations for risk estimation are critical to the new preventive guidelines for ASCVD events.1 ,2 Based on the hazard analysis and visualisation, age may not always be the predominant risk factor contributing to estimated 10-year risk. Other variables also make an important contribution to the overall 10-year risk. Moreover, for all the cohorts except African–American males, age has multiple interactions with other risk variables. Therefore, estimated 10-year risk should be interpreted in the appropriate clinical context.
Our analyses also find interesting patterns of the proposed risk equations. There are situations when increase in age paradoxically results in lower 10-year risk while other variables remain the same. The impact of these anomalies is most profound in Caucasian females who smoke, where a substantial number may be in a region of the 10-year risk estimates where the calculated risk values are counter to the currently accepted concepts of ASCVD risk evolution and age. Many of these females will be at the boundary limits of 5% and 7.5% 10-year risk and therefore be subject to greater uncertainties regarding statin therapy. We also find that the robustness of the pooled cohort equations fails for African-American females with HDL-C <30 mg/dL, SBP >150–160 mm Hg who are older than 70 years of age. The baseline estimated 10-year risks for these individuals are ≥10% once values of other parameters are incorporated. Therefore, these affected individuals are well beyond the current boundary limit of 7.5% for aggressive medical therapy. However, Downs et al6 have recently proposed this threshold may be low and suggested a risk level of 10% or 15% and above for statin treatment. Our finding of paradoxical pattern in the affected African-American females cohort would be an important issue for deciding medical therapy in such situations and may need to be addressed in future updates of the risk calculator.
We performed the simulation based on the pooled cohort equations and range of allowable input values for the variables. We did not have access to the clinical data set that formed the basis of formulation of the new pooled cohort risk equations for estimating 10-year risk. Despite this limitation, this does not negate our observations, as the intent of the new guidelines is to incorporate the risk calculator in clinical practice based on the methods and coefficients described in the guidelines.
In conclusion, the new pooled cohort equations for 10-year risk estimation have predictable behaviour consistent with ASCVD disease pathophysiology in most instances. Nevertheless, there are certain important exceptions where the results obtained from the risk equations are surprising. These patterns need further investigation.
Acknowledgments
The authors thank Matthew C Schiros for his review and proofreading of the manuscript.
Footnotes
Contributors CGS and HG were responsible for the conceptualising, designing, drafting and finalising of the manuscript. CGS and TSD were responsible for the multidimensional visualisation analysis. All authors were responsible for the revising of the manuscript critically for important intellectual content, and gave approval for the final version.
Funding This research received no specific grant from any funding agency in the public, commercial or not-for-profit sectors.
Competing interests None.
Provenance and peer review Not commissioned; externally peer reviewed.
Data sharing statement No additional data are available.