Article Text

Abstract
Objective We examined the association of outdoor air pollution and meteorological parameters with primary care visits (PCVs) at night due to asthma attack.
Setting A case-crossover study was conducted in a primary care clinic in Himeji City, Japan.
Participants Participants were 1447 children aged 0–14 years who visited the clinic with an asthma attack from April 2010 until March 2013.
Exposure Daily concentrations of air pollutants and meteorological parameters were measured.
Primary outcome PCVs at night due to asthma attack. A conditional logistic regression model was used to estimate ORs of PCVs per unit increment of air pollutants or meteorological parameters (the per-unit increments of particulate matter with an aerodynamic diameter ≤2.5 µm (PM2.5) and ozone were 10 μg/m3 and 10 ppb, respectively). Analyses took into consideration the effects of seasonality.
Results We noted an association between PCVs and daily ozone levels on the day before a PCV (OR=1.17; 95% CI 1.01 to 1.35; p=0.04), as well as between PCVs and 3-day mean ozone levels before a PCV (OR=1.29; 95% CI 1.00 to 1.46; p=0.04), from April until June. We also observed an association between PCVs and daily PM2.5 levels on the day before a PCV from December until March (OR=1.16; 95% CI 1.01 to 1.33; p=0.05). Meteorological parameters, such as hours of sunshine from September until November, atmospheric pressure from April until June, and temperature from April until August, were also found to be associated with PCVs.
Conclusions The findings in the present study supported an association between ozone and PCVs and suggest that certain meteorological items may be associated with PCVs.
- PUBLIC HEALTH
This is an Open Access article distributed in accordance with the Creative Commons Attribution Non Commercial (CC BY-NC 4.0) license, which permits others to distribute, remix, adapt, build upon this work non-commercially, and license their derivative works on different terms, provided the original work is properly cited and the use is non-commercial. See: http://creativecommons.org/licenses/by-nc/4.0/
Statistics from Altmetric.com
Strengths and limitations of this study
The findings in this study support an association between ozone and primary care visits in spring.
Moreover, certain meteorological items such as atmospheric pressure, temperature and hours of daylight may be associated with primary care visits.
One of the limitations of this study is that our use of a number of statistical test produces led to issues with multiple comparisons.
Introduction
Exposure to ambient air pollutants such as particulate matter (PM), ozone and nitrogen dioxide (NO2) is associated with a number of adverse health outcomes ranging from increased symptoms of allergic airway disease to increased mortality.1–6 Children are considered to be particularly susceptible to air pollution and meteorological factors because their lungs are still growing and their immune and pulmonary systems are developing, making them vulnerable to infection with respiratory pathogens. Children are considered to be more sensitive to air pollution than adults,7 and children with asthma are particularly vulnerable to the adverse health effects of air pollution. Studies in children with asthma have concluded that exposure to high concentrations of ozone or PM significantly enhances the risk of respiratory symptoms, asthma medication use and reduced lung function, characterised by a decline in peak expiratory flow or forced expiratory flow in a short time.8–14 However, while a number of studies have been conducted in the field of air pollution epidemiology, the adverse health effects of low-level exposure of air pollutants and seasonal effects of air pollutants on respiratory symptoms remain unclear.
Further, while many studies have examined the association between ambient air pollutants and asthma attack,1–6 few have assessed that between meteorological parameters and asthma attack. Previous studies have shown that the meteorological risk factors of care visits due to asthma attack were high temperature,15–17 large changes in temperature,18 ,19 high atmospheric pressure,18 ,20 low relative humidity,18 large changes in humidity19 and hours of daylight.17 However, these data may suffer from publication bias.
We previously collected and analysed daily mean air pollutant data and meteorological parameters as well as records of primary care visits (PCVs) at night due to asthma attack in Himeji City, western Japan from April 2010 to March 2012. The results of that 2-year analysis suggested no stable association between air pollutants and PCVs, although some meteorological parameters—such as temperature in summer and hours of daylight in fall—were found to be associated with PCVs.17 In addition, at the beginning of 2013, extremely high concentrations of PM with an aerodynamic diameter ≤2.5 µm (PM2.5) were observed around Beijing, China.21 In Japan as well, the health effects of transboundary air pollution have been a matter of concern. We previously examined the association between PM2.5 and PCVs at night from January until March 2013 (3-month analysis). This analysis was conducted in the same setting as the previous 2-year analysis,17 and the results did not support any association between the daily mean concentration of PM2.5 and PCVs,22 although we did note an association between ozone and PCVs. However, both of these previous studies suffered from statistical power that was too low to detect the association between air pollutants and PCVs.
We conducted a 3-year (April 2010–March 2013) analysis to clarify any potential association of air pollutants and meteorological parameters with PCVs due to asthma attacks at night.
Methods
Participants
The setting of this study was the same as that of the previous 2-year analysis17—namely, Himeji City Emergency Clinic (Himeji, Japan), which was established for the purpose of treating emergency cases between 21:00 and 6:00 on weekdays. Himeji City is located in western Japan, within 100 km of central Osaka, and facing the Seto Inland Sea. The city is 534 km2 in area, and its population was about 540 000, some 80 000 of whom were aged less than 15 years. Participants were city residents aged <15 years with a history of asthma attack who visited the clinic for asthma attack between 21:00 and 6:00 from April 2010 to March 2013 and who had received a prescription for bronchodilators from their general practitioner. In Himeji City, primary care at night is generally only available at this emergency clinic, and almost all patients who suffer asthma attacks at night visit the clinic. Patients who visited the clinic on national holidays were excluded (see Statistical methods section). The medical records of all patients were provided retrospectively, and patient age, sex, diagnosis and date of visit were recorded.
Air pollutants and meteorological parameters
From April 2010 until March 2013, concentrations of PM2.5, PM10 and optical black carbon (OBC) were measured hourly using an SPM-613D dichotomous β gauge monitor (Kimoto Electric Co. Inc, Osaka, Japan) at the monitoring station, which was located in the central site of the residential districts in the city. In this study, OBC in PM2.5 was measured. Data on daily concentrations of NO2 and ozone from during the same period were obtained from the Himeji local government. All participants resided within 10 km of the monitoring station. Data on meteorological parameters, such as daily mean values for atmospheric pressure, relative humidity, temperature, wind speed, as well as total hours of daylight, were obtained from the Japan Meteorological Agency.
Statistical methods
The study was conducted under a time-stratified case-crossover design, which is used to assess brief changes in risk associated with transient exposures.23 ,24 Case-crossover analyses require exposure data for cases only. They can be regarded as a special type of case–control study in which each case serves as its own control providing inherent control of potential confounding by fixed individual characteristics, such as sex, race, diet and age. ‘Time-stratified’ indicates the method by which the control periods were chosen. Specifically, we stratified time into months to select days for control periods that fell on the same day of the week within the same month in the same year as the date of a PCV (day of the index period). For example, if a PCV at night due to asthma attack occurred on 18 March 2012, the three control days were 4, 11 and 25 March 2012. This approach therefore also controls for long-term trends, seasonality and day of the week.
We excluded patients who visited the clinic on national holidays because of bias in control selection. That is, if patients whose visits occurred on holidays were included as participants, the estimated relative risks were lower than expected because the concentration of air pollutants on holidays (days for the index periods) was usually/systematically lower than that on non-holidays (days for control periods).25
We examined associations of daily mean concentrations (day-of and day before PCVs) of each air pollutant before PCVs with the risk of PCVs at night due to asthma attack. We also examined associations of 3-day mean concentrations of each air pollutant before PCVs with the risk of PCVs at night due to asthma attack. We estimated ORs of PCVs at night due to asthma attack per 10 µg/m3 increment in PM2.5 in a single-pollutant model adjusted for 1-day/3-day mean atmospheric pressure (hPa), relative humidity (%), temperature (°C), wind speed (m/s) and hours of daylight (h). Similarly, we also estimated ORs of PCVs per 10 µg/m3 increment in PM10, per 0.1 µg/m3 increment for OBC, and per 10 ppb increment in NO2 and ozone. In addition, we simultaneously assessed the associations between PCVs at night due to asthma attack and increment of PM2.5, NO2 and ozone using a multipollutant model adjusted for the same variables as the single-pollutant model. When 3-day mean concentrations of air pollutants were explanatory variables, adjusted variables were also included as 3-day mean values. In addition, we considered interactions between ozone and temperature in the single-pollutant model as a sensitivity analysis.
Modified effects of season were examined using a four-level indicator variable for spring (April until June), summer (July and August), fall (September until November), and winter months (December until March). These classifications were the same as those used in our previous study.17
Conditional logistic regression was carried out using the PHREG procedures of SAS release V.9.2 (SAS Institute, Inc, Cary, North Carolina, USA). All tests were two-tailed, and α was set at 0.05. We computed ORs and their 95% CIs.
Results
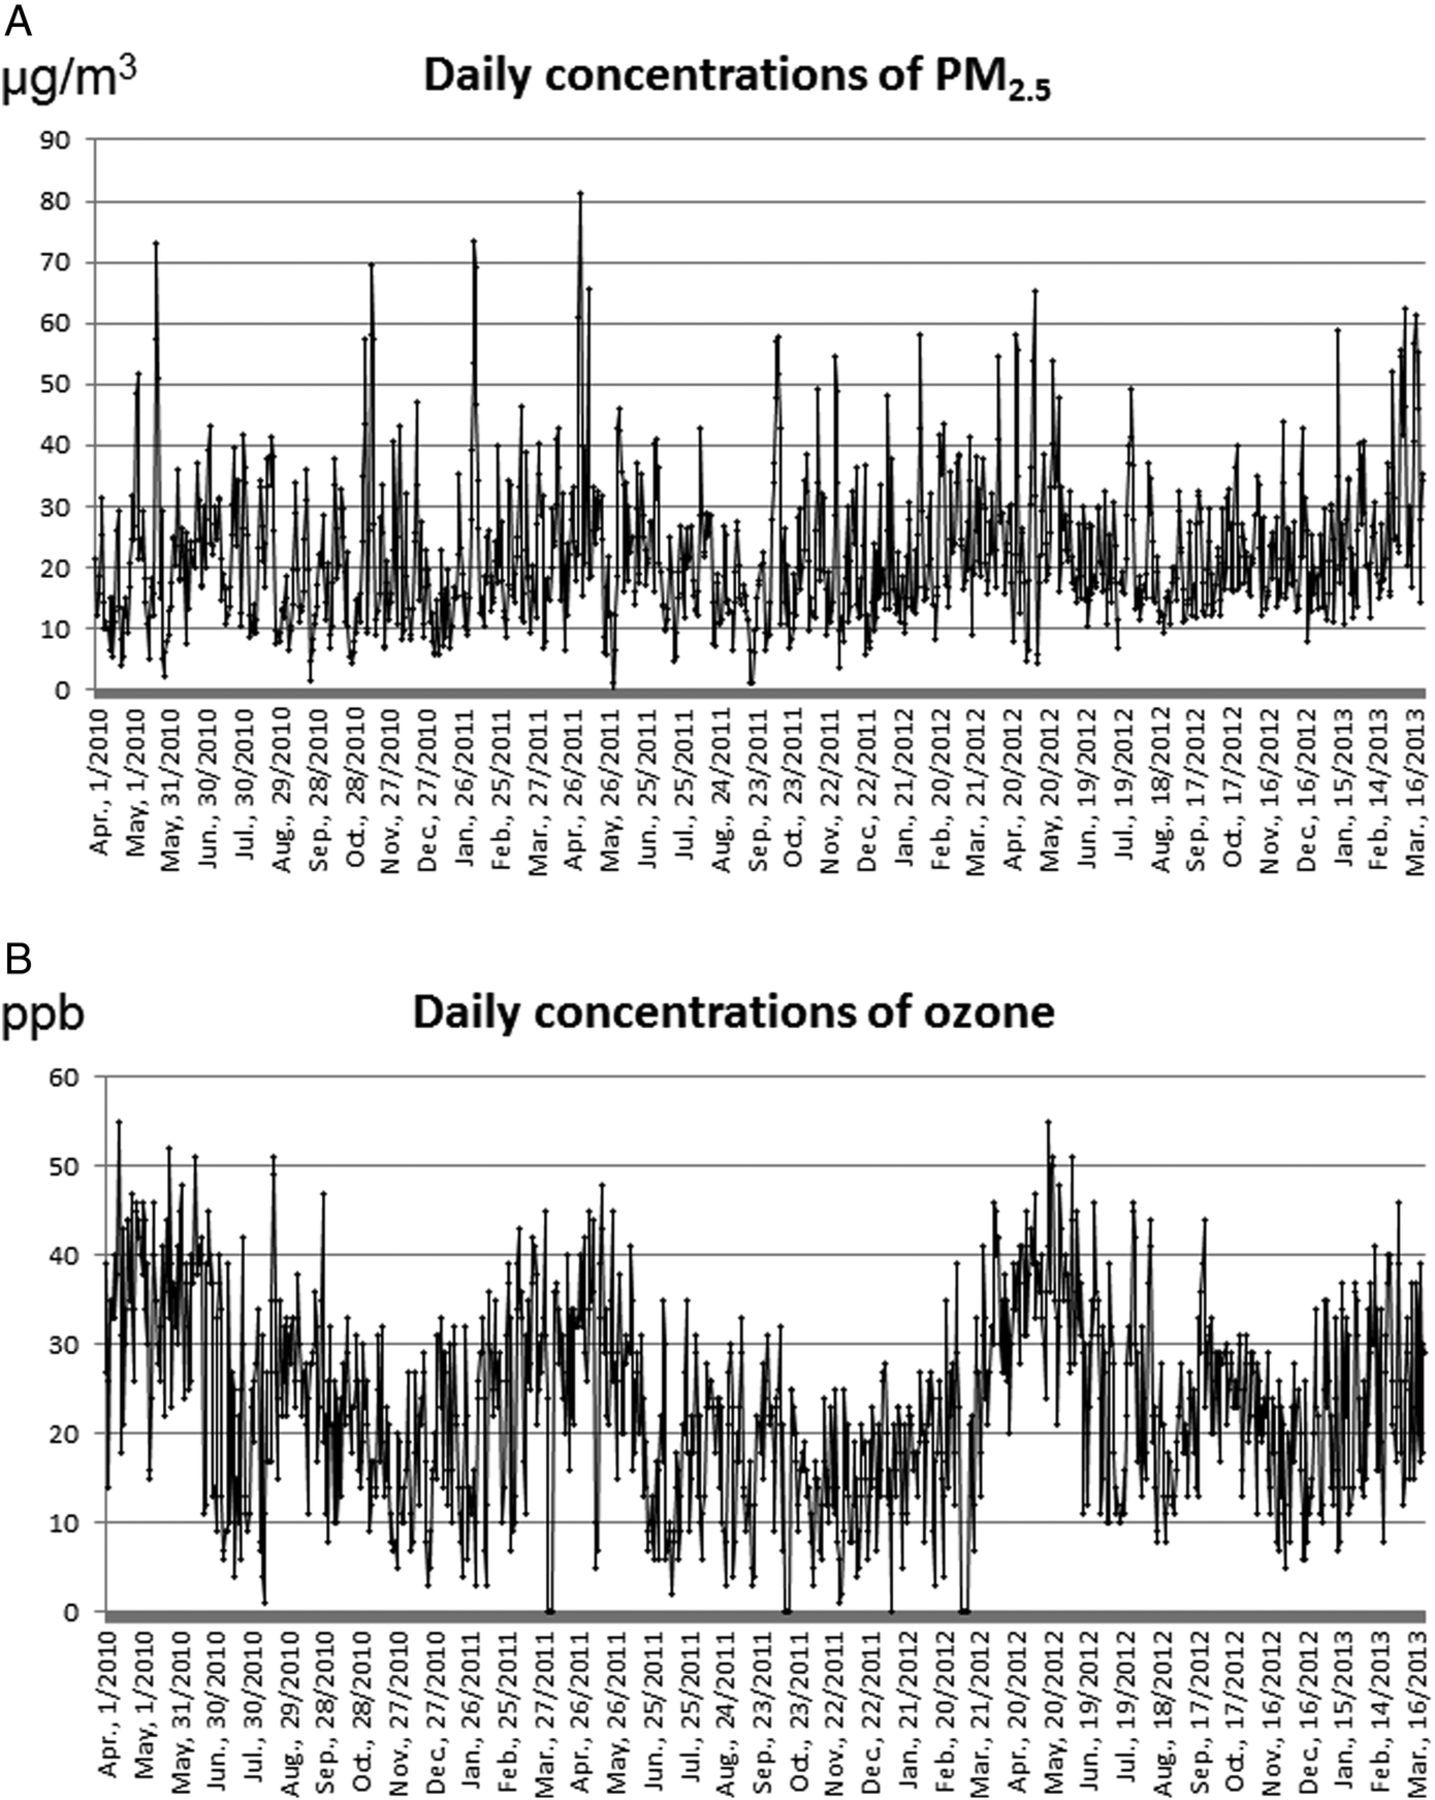
Participant characteristics are shown in table 1. Of the 1447 participants evaluated, 1005 were boys, and 115 were aged less than 2 years. The number of cases in spring, summer, fall and winter were 390, 291, 481 and 285, respectively. Daily mean concentrations of air pollutants and other meteorological data by season are shown in table 2. Ozone levels were highest in spring among all seasons (table 2). Figure 1 shows daily concentrations of PM2.5 and ozone from April 2010 until March 2013. The correlation coefficients among daily concentrations of air pollutants and daily means of meteorological parameters are shown in table 3.
Age and gender in participants
Summary statistics of daily concentration of air pollutants and meteorological parameters
Correlation coefficients among daily concentrations of air pollutants and daily means of meteorological parameters

Daily concentrations of particulate matter with an aerodynamic diameter ≤2.5 µm (PM2.5) (A) and ozone (B) from April 2010 until March 2013.
Associations between air pollutants and PCVs at night are described using the single-pollutant model in table 4. Findings with the multipollutant model are shown in table 5.
Associations between air pollutants and PCVs at night due to asthma attack (single-pollutant model)
Associations between air pollutants and PCVs at night due to asthma attack (multipollutant model)
Ozone
While we noted no association between PCVs and concentrations of air pollutants on the same day as a PCV, we did observe an association between PCVs and ozone levels on the day before a PCV in spring and winter, with respective ORs per 10 ppb increment of ozone of 1.16 (95% CI 1.01 to 1.34; p=0.04) and 1.29 (95% CI 1.03 to 1.61; p=0.03) (table 4). With respect to the association between PCVs and 3-day mean concentrations of air pollutants before PCVs, ozone was associated with PCVs in spring and winter, with respective ORs per 10 ppb increment of ozone of 1.21 (95% CI 1.00 to 1.46; p=0.05) and 1.56 (95% CI 1.12 to 2.17; p=0.01). We also detected a statistically significant association of daily (day before a PCV) and 3-day mean ozone levels before a PCV with PCVs in spring in the multipollutant model (table 5), with respective ORs per 10 ppb increment of daily (day before a PCV) and 3-day mean ozone levels of 1.17 (95% CI 1.01 to 1.35; p=0.04) and 1.21 (95% CI 1.00 to 1.46; p=0.04). With respect to annual effects of ozone, we also observed a significant association between daily (day before a PCV) and 3-day mean ozone levels before a PCV and PCVs (tables 4 and 5). In addition, when we considered interactions between ozone and temperature in the single-pollutant model, there was no significant interaction between ozone and temperature (p values of the interactions on the same day of a PCV, on the day before a PCV, and for 3-days mean were 0.17, 0.21 and 0.11, respectively); the association between ozone and PCV remained significant (data not shown).
PM and NO2
PM10 levels on the day before a PCV were also associated with PCVs in summer. OR per 10 μg/m3 increment of PM10 was 1.19 (95% CI 1.04 to 1.38; p=0.01) (table 4). In addition, PM2.5 levels on the day before a PCV were associated with PCVs in winter, with an OR per 10 μg/m3 increment of PM2.5 of 1.16 (95% CI 1.01 to 1.33; p=0.05) (table 5). In contrast, we noted statistical significance in the inverse association between 3-day mean NO2 levels and PCVs in winter. Neither any association was noted between OBC and PCVs using the single-pollutant model (table 4), nor any association was noted between OBC and PCVs using the multipollutant model, which was adjusted for PM2.5, NO2, ozone and meteorological factors (see online supplementary table S1).
Meteorological parameters
In spring, we found that temperature on the day-of and the day before PCV and 3-day mean temperature before PCVs were associated with PCVs, and further noted that atmospheric pressure on the day before PCVs were associated with PCVs (table 5). In summer, we also observed that temperature on the day-of a PCV was associated with PCVs (table 5). In fall, we found that the day-of and 3-day mean decline in the number of hours of daylight before PCVs as well as a decline in 3-day mean relative humidity were associated with PCVs (table 5). Over the course of a year, we found that increases in daily atmospheric pressure and temperature and decreases in wind speed were associated with PCVs (table 5).
Discussion
The findings from this study support an association between ozone levels and PCVs in spring, when ozone levels are the highest. We also noted an association between single-day PM2.5 levels on the day before a PCV and PCVs in winter. Further, our findings also suggest that meteorological parameters such as temperature, hours of sunshine, relative humidity and atmospheric pressure may be associated with PCVs to some extent. Of note, the effect of 3-day mean ozone levels in spring in the single-pollutant model did not differ markedly from that in the multipollutant model. Our findings support the notion that the association between air pollution and meteorological parameters with PCVs due to asthma attack has seasonality.
In our previous 2-year analysis,17 we noted statistical significance in the inverse association between PCVs and ozone levels on the day-of (but not before) a PCV in winter. We also noted in that study that the OR per degree increment in daily mean temperature was 1.31 (95% CI 1.09 to 1.56) in summer, and OR per hourly increment in the number of daily hours of sunshine was 0.94 (95% CI 0.90 to 0.99) in fall. The results of the present 3-year analysis supported these previous findings with respect to the association between PCVs and meteorological parameters, such as temperature in summer and daily hours of sunshine in fall. In addition, the results of another previous study conducted when extremely high concentrations of PM2.5 were observed around Beijing, China (3-month analysis) suggested that ozone on the day before PCVs was positively associated with PCVs in winter.21 Our findings in the present 3-year analysis supported these previous 3-month results. Further, we also detected the association between PCVs and ozone levels on the day before in spring, when the concentrations of ozone were the highest. We consider the results of the present 3-year analysis to have a smaller random error than those of the 2-year or 3-month analyses, due to the sample size of this study being 1.5 times larger than that of the 2-year analysis and approximately 2.5 times that of the 3-month study.
Our findings regarding a potential association between ozone and physician visits due to asthma attack were consistent with those of previous studies. For example, a recent US EPA5 analysis of ambient ozone health effects concluded that children with asthma suffer acute adverse health consequences even at ambient ozone levels, and Babin et al26 also observed an association between paediatric emergency room visits for asthma exacerbation and outdoor ozone levels. With respect to the seasonality effects of ozone on asthma attack, Moore et al27 indicated that ozone contributes to an increased risk of hospitalisation for children with asthma in warmer months. In a previous Japanese study, Yamazaki et al13 also noted an association between ozone and PCVs due to asthma attack in warmer months. Samoli et al14 also noted an association between ozone levels and risk of asthma admission among older children in summer. This study further added that, even in winter, ozone levels might be associated with PCVs.
While we did note an association between single-day PM2.5 levels on the day before a PCV and PCVs in winter, it was a weak one, observed only in the multipollutant model. The findings in our previous study,21 which was restricted to cases from January until March 2013, did not support any association between the daily mean concentration of PM2.5 and PCVs at night due to asthma attack.
As with ozone, the findings regarding the seasonal effects of PM2.5 on emergency department visits or hospital admission for asthma have proven controversial. Several studies in elderly participants have shown stronger seasonal effects in winter/cooler seasons than in summer/warmer seasons.28 ,29 Similarly, Ostro et al30 reported that the association of PM2.5 with total respiratory admissions was stronger during cool seasons than warm ones for those aged less than 19 years. In contrast, however, Stieb et al31 reported that the effect was stronger in warm seasons than cool seasons in all ages, and Strickland et al32 also observed associations with several traffic-related primary pollutants during the warm season in a large study analysing over 90 000 emergency department visits for paediatric asthma in relation to ambient air pollutant concentrations. Muddying the waters still further, Yamazaki et al13 ,17 reported an unstable association between PM2.5 and PCVs in warmer months among patients aged less than 15 years, and Sheppard et al33 reported that the increase in risk of hospital admission for asthma was greatest in spring and fall among patients aged less than 65 years. Additional studies are needed to clarify the seasonal effects of PM2.5/air pollutants on respiratory symptoms.
With respect to an inverse association between 3-day mean concentration of NO2 and PCVs in winter in a single-pollutant model, we speculate that photochemical radiation decreased the concentration of NO2 and increased the concentration of ozone. In winter, Pearson's correlation coefficient between NO2 and ozone was −0.69. Since ozone is secondarily formed by the action of short-wavelength radiation from the sun on NO2, when the concentration of ozone was increased, the concentration of NO2 subsequently tended to be decreased. Therefore, when the 3-day mean concentration of ozone was positively associated with the risk of PCV in winter, the 3-day mean concentration of NO2 was inversely associated with the risk of PCV. In the multipollutant model, we noted no significant association between PCVs and NO2.
While we did note that some meteorological parameters—such as hours of sunshine in fall, atmospheric pressure in spring, and temperature in spring and summer—were associated with PCVs, additional studies will still be needed to confirm these findings.
Limitations
Several limitations to this study warrant mention. First, our study design is limited with respect to control of within-person confounding, which is still possible for multiple correlated transient factors that change over time within a participant. For example, if a patient in this study was exposed to certain air pollution or meteorological factors and concurrently was using an inhaler of corticosteroids or albuterol, this confounding would be uncontrolled and would be a threat to the internal validity of the findings. Second, the selection of participants for this study may have been subject to issues with external validity, as we restricted our population to nighttime patients. Third, the estimated ORs in this study may suffer from non-differential misclassification, causing our results to be biased towards null, as single values for air pollution concentrations or meteorological data were assigned to all individuals living in a certain area. Fourth, the association between concentrations of air pollutants and PCV might not be adequately adjusted for meteorological factors, because associations between meteorological factors and PCV are not clear.
Conclusion
The findings in this study supported an association between ozone levels and PCVs in spring and winter and between PM2.5 levels and PCVs in winter. Further, certain meteorological parameters—such as atmospheric pressure in spring, temperature in spring or summer, and hours of daylight in fall—may be associated with PCVs due to asthma attack. Informing local residents of air pollution levels and meteorological parameters may help prevent asthmatic events in the area.
References
Supplementary materials
Supplementary Data
This web only file has been produced by the BMJ Publishing Group from an electronic file supplied by the author(s) and has not been edited for content.
Files in this Data Supplement:
- Data supplement 1 - Online supplement
Footnotes
Contributors SY analysed the data and drafted the manuscript. MS developed the survey and study and supervised all aspects of its implementation. YY, KO, FK, SS, HT, YN, JN, KF, YM, AM, TY and NY organised the field survey. All the authors contributed to the study, interpreted the results and reviewed the final draft.
Funding This research was supported by the Environmental Research and Technology Development Fund (C-1005 and 5-1456) of the Ministry of the Environment, Japan.
Competing interests None declared.
Ethics approval The study protocol was approved by the Ethics Committee of Hyogo College of Medicine.
Provenance and peer review Not commissioned; externally peer reviewed.
Data sharing statement No additional data are available.