Article Text

Abstract
Objective To analyse the spatial-temporal clustering of the HIV/AIDS epidemic in Chongqing and to explore its association with the economic indices of AIDS prevention and treatment.
Methods Data on the HIV/AIDS epidemic and economic indices of AIDS prevention and treatment were obtained from the annual reports of the Chongqing Municipal Center for Disease Control for 2006–2012. Spatial clustering analysis, temporal-spatial clustering analysis, and spatial regression were used to conduct statistical analysis.
Results The annual average new HIV infection rate, incidence rate for new AIDS cases, and rate of people living with HIV in Chongqing were 5.97, 2.42 and 28.12 per 100 000, respectively, for 2006–2012. The HIV/AIDS epidemic showed a non-random spatial distribution (Moran’s I≥0.310; p<0.05). The epidemic hotspots were distributed in the 15 mid-western counties. The most likely clusters were primarily located in the central region and southwest of Chongqing and occurred in 2010–2012. The regression coefficients of the total amount of special funds allocated to AIDS and to the public awareness unit for the numbers of new HIV cases, new AIDS cases, and people living with HIV were 0.775, 0.976 and 0.816, and −0.188, −0.259 and −0.215 (p<0.002), respectively.
Conclusions The Chongqing HIV/AIDS epidemic showed temporal-spatial clustering and was mainly clustered in the mid-western and south-western counties, showing an upward trend over time. The amount of special funds dedicated to AIDS and to the public awareness unit showed positive and negative relationships with HIV/AIDS spatial clustering, respectively.
- HEALTH SERVICES ADMINISTRATION & MANAGEMENT
- HEALTH ECONOMICS
- STATISTICS & RESEARCH METHODS
This is an Open Access article distributed in accordance with the Creative Commons Attribution Non Commercial (CC BY-NC 4.0) license, which permits others to distribute, remix, adapt, build upon this work non-commercially, and license their derivative works on different terms, provided the original work is properly cited and the use is non-commercial. See: http://creativecommons.org/licenses/by-nc/4.0/
Statistics from Altmetric.com
Strengths and limitations of this study
-
This study combined spatial clustering analysis, temporal-spatial clustering analysis and spatial regression to analyse the spatial and temporal clustering of the HIV/AIDS epidemic in Chongqing, China and the economic factors affecting this clustering.
-
HIV/AIDS incidence and prevalence were primarily concentrated in the mid-western and south-central districts and counties in Chongqing and showed an upward trend over time.
-
The amount of funds dedicated to AIDS and to the public awareness unit showed positive and negative relationships with HIV/AIDS spatial clustering, respectively.
-
Major strengths of this study include the novel methodology, the data source, and significance for HIV/AIDS prevention.
-
No causal implications can be drawn because this is an observational study and the information provided by surveillance data is still limited.
Introduction
Chongqing is the largest municipality that is directly administered by the central government of China and plays a key role in the development strategy for western China.1 ,2 The rate of increase in the HIV/AIDS epidemic in Chongqing is faster than the overall national level. In 2012 in Chongqing, the rate of new HIV infections was 0.0098%, the rate of new AIDS cases was 0.0055%, the rate of people living with HIV was 0.045%, and the AIDS mortality rate was 0.0031%. During 2007–2012, the average annual growth rates for new HIV cases, new AIDS cases and people living with HIV in Chongqing City were 19.65%, 73.14% and 26.23%, respectively, which were all significantly higher than the corresponding national indices (3.13%, 17.48% and 13.90%).3 ,4
In the field of epidemiological studies, spatial statistical methods have been increasingly used in spatial distribution studies of communicable diseases such as tuberculosis,5–7 hand, foot and mouth disease,8 ,9 diarrhoea10 and malaria.11 Currently, studies investigating the status of the HIV/AIDS epidemic mostly examine geographic prevalence, the prevalence level in a particular population, or temporal trends.12–15 Many studies also use spatial analysis to investigate the spatial distribution of AIDS.16–23 Compared to traditional statistical methods, temporal-spatial statistical methods have certain advantages. Spatial statistics is based on classic statistical methods. For example, when analysing the prevalence of AIDS, traditional statistical methods mainly examine the correlation between HIV/AIDS and other factors (economy, inputs and outputs) in terms of temporal change, whereas spatial statistics can analyse correlations in time and space, that is, the research perspectives of the two methods are different.24
Meyers et al16 examined spatial-temporal clustering trends in infectious disease mortality in Massachusetts in 2002–2011 with a focus on HIV/AIDS and hepatitis C virus. Brouwer et al18 explored the spatial distribution of HIV among injection drug users (IDUs) using average nearest neighbour and Getis-Ord Gi* statistics. Heimer et al19 used Moran's I and nearest neighbour analysis to study the spatial distribution of HIV prevalence and incidence among IDUs in St Petersburg. Tanser et al21 adopted two spatial statistical methods to explore the clustering of HIV infection in the rural population in KwaZulu-Natal, South Africa, while Jia et al22 used the spatial analysis model to investigate the spatial distribution of HIV/AIDS in China from 2003 to 2009. Peng et al23 used spatial statistical methods to explore the spatial distribution of HIV/AIDS in Yunnan Province.
Chongqing has 38 districts and counties. Due to the different levels of economic development in the different regions, the economic inputs of the government into HIV/AIDS prevention and control also vary. As a result, different areas have different HIV/AIDS programmes and intervention measures, as well as different prevention effects, which is an important assumption of this study. This study used spatial statistical methods and temporal analysis to examinee the spatial and temporal clustering of the HIV/AIDS epidemic in Chongqing. We took economic indices of HIV/AIDS prevention and control as the quantitative indices representing the HIV/AIDS prevention and control policy and also analysed the relationship between economic input factors and the spatial clustering characteristics of HIV/AIDS. The results provide information to help prevent and control HIV/AIDS.
Methods
Study area
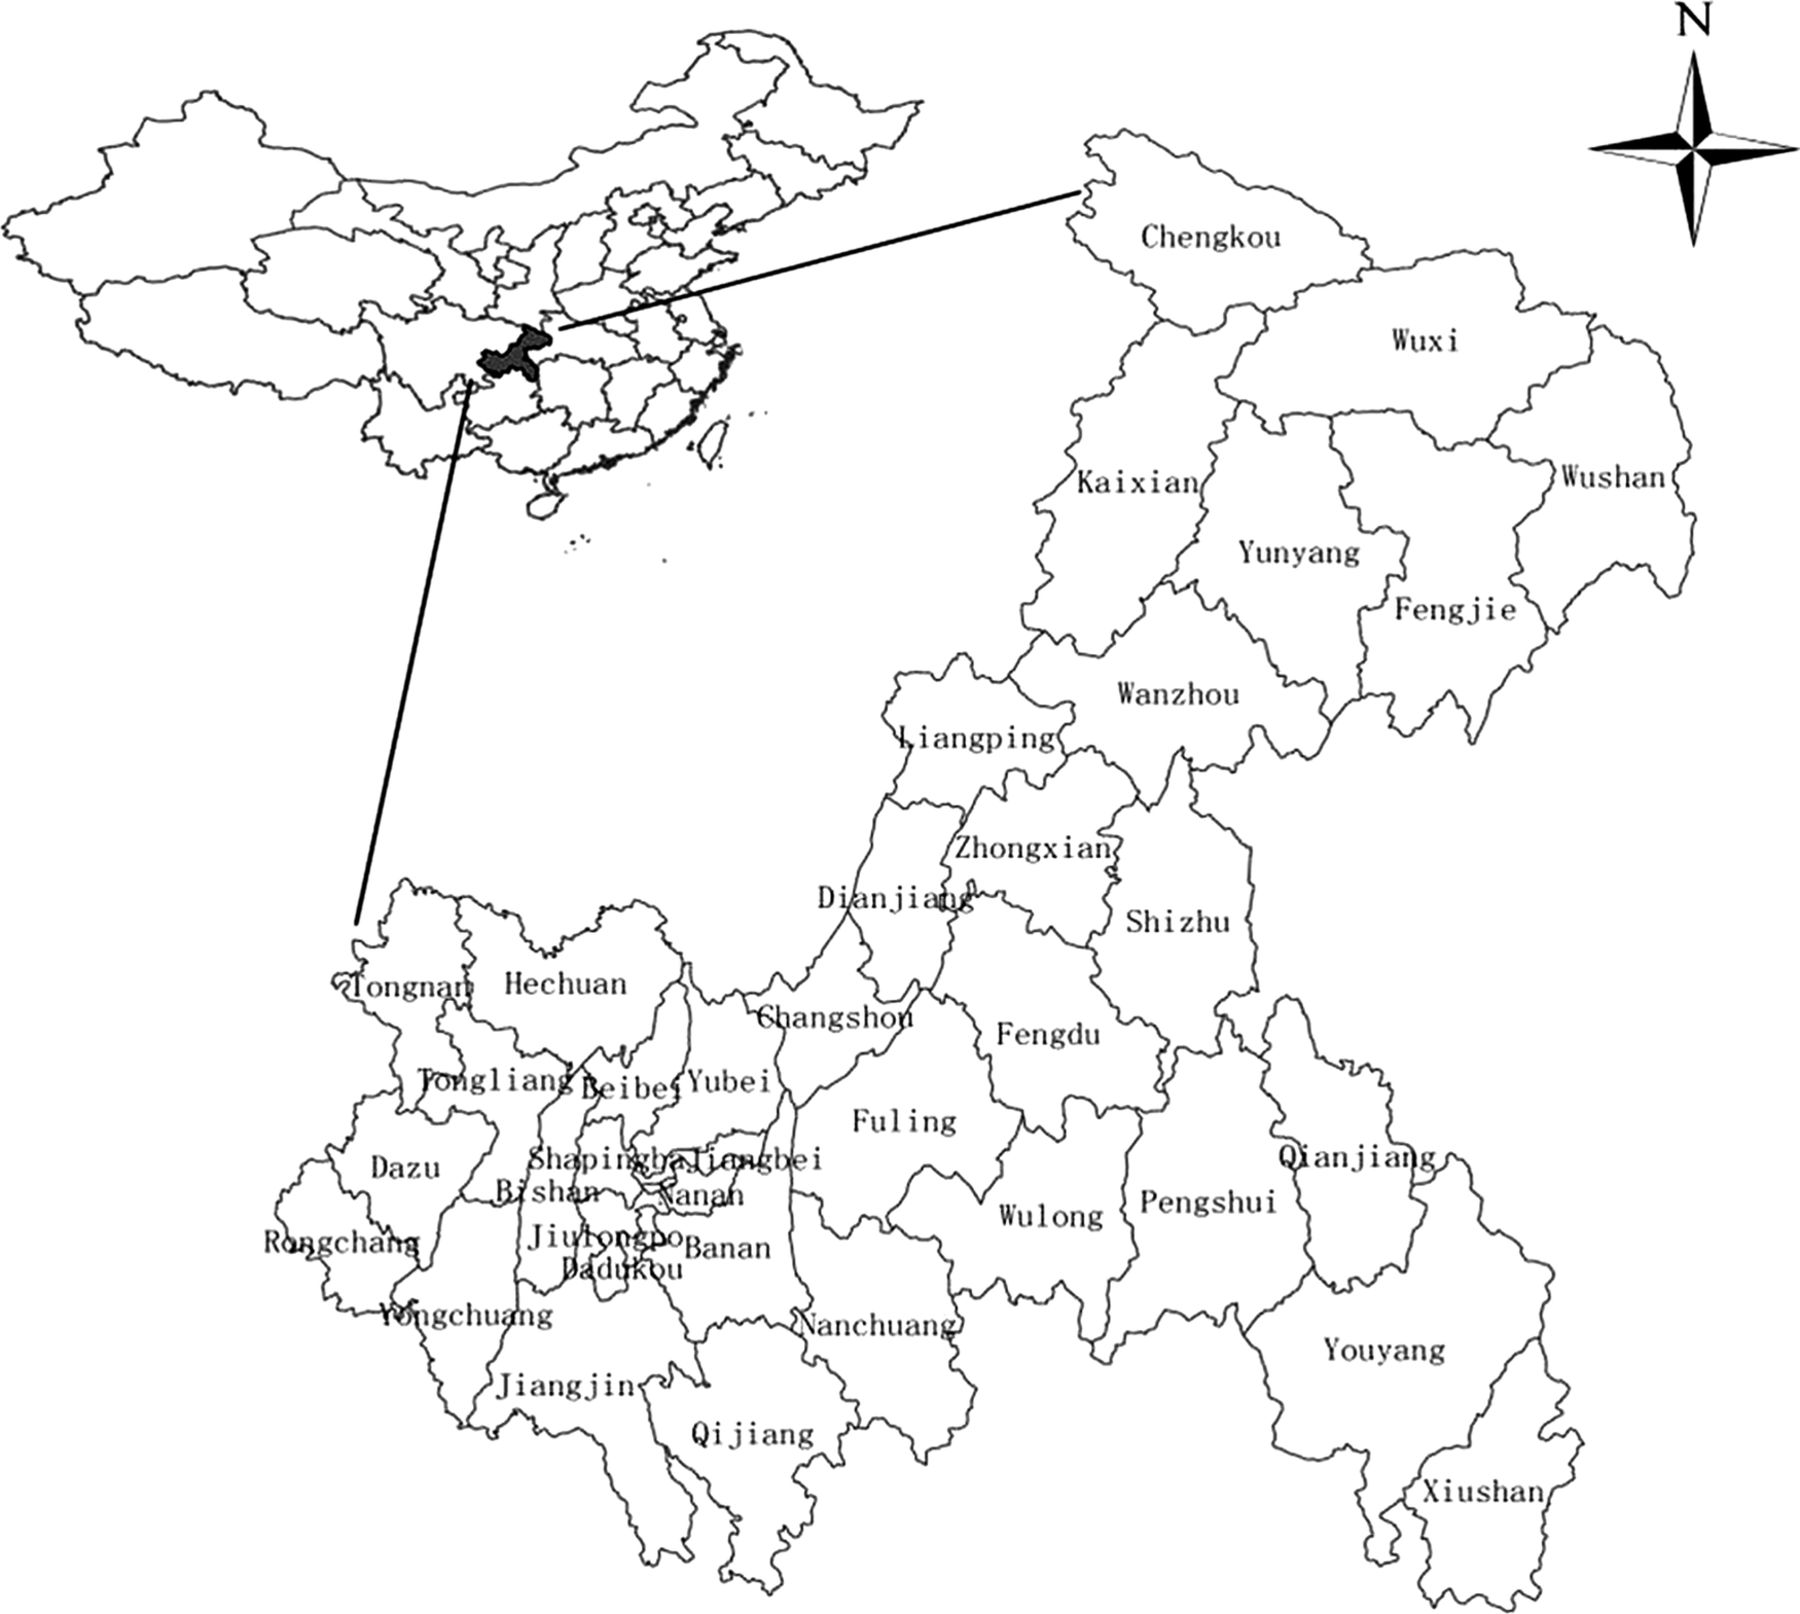
Chongqing, situated at latitude 28°10′ to 32°13′ N and longitude 105°11′ to 110°11′ E, is more than 82 400 km2 in area and has a resident population of about 29.7 million.1 ,2 Chongqing is one of the four municipalities under the direct control of the central government of China and is the economic and political centre of southwest China. It has 38 districts or counties, all of which were covered by this study (figure 1).

Location of the study area, Chongqing Municipality, China.
Data collection
Data on the HIV/AIDS epidemic and funding for AIDS prevention and treatment in the 38 districts and counties from 2006 to 2012 were obtained directly from the annual reports of the Chongqing Municipal Center for Disease Control (CQCDC).25–27 The HIV/AIDS case report data were collected by CQCDC in the various districts and counties.
There were two main sources of the data. One of these was the National Data and Information Management System of Comprehensive AIDS Prevention and Control (NDIMS-AIDS). All medical institutions, institutions for disease prevention and control, and blood donation and supply organisations reported HIV and AIDS cases meeting the diagnostic criteria directly to NDIMS-AIDS.
The other data source was the CQCDC HIV/AIDS Sentinel Surveillance System. In 2011, there were 29 HIV sentinel surveillance centres in Chongqing monitoring nine high-risk populations including IDUs, men who have sex with men (MSM), female sex workers (FSW), sexually transmitted disease outpatients, migratory populations, long-distance truck drivers, pregnant women and new mothers, migrant workers, and young students. Sentinel surveillance data are collected continuously and thus can provide information on infection rate changes in specific populations.
Both systems collect data on HIV and AIDS cases. Both are network reporting systems based on case report and case management, they share data and the annual data they report are comparable.
In our study, the HIV/AIDS epidemic data included three indicators: new HIV cases, new AIDS cases and the number of people living with HIV. The economic input factor data were presented by district, as were the HIV/AIDS epidemic data, and included five indicators: the total number of special funds for AIDS prevention and treatment, anti-HIV unit costs, unit costs for intervention in high-risk populations, public awareness unit costs, and the ratio of supervision funds. These data were provided by CQCDC.
The population data were from the Chongqing Statistical Yearbook.1
Statistical analysis
Spatial clustering analysis
We used the global Moran’s I value28 to explore the HIV/AIDS spatial distribution in Chongqing each year from 2006 to 2012 and to determine whether the distribution of HIV/AIDS was random over the Chongqing area; we used the Monte Carlo stochastic model to test whether Moran’s I was significant. Additionally, we used local statistics, Getis Gi*, to analyse clustering hotspots in the entire Chongqing area. A fixed-distance clustering routine was used to group points together on the basis of spatial proximity. The threshold distance was set at 75 km.
Temporal-spatial clustering analysis
Space-time scan statistics was used to detect disease clustering simultaneously in time and space. We used a circular scanning window for probe scanning. The radius of the scanning window represents the area of the scanned space, which ranges from 0 to the designated upper limit of the scanning window, while the height of the cylinder represents the scanning interval.29 During the dynamic scanning process, the cylinder continuously calculates the statistical log likelihood ratio (LLR) and compares the risks outside and inside the window. Once the LLR values of the cylindrical scanning windows consisting of all community centres, all population radii and all time intervals were calculated, the window with the largest LLR value was defined as the most likely cluster, and other windows that contained clusters with statistically significant LLR values were defined as the first secondary cluster, the second secondary cluster, etc., based on the magnitude of the LLR values. We also calculated the HIV/AIDS relative risk (RR) of various clustering areas, as well as the p values.
This study used retrospective space-time scan analysis combined with the discrete Poisson distribution model to scan for areas with high rates. The scanning window used was the cylindrical window method, the spatial units were the 38 districts and counties of Chongqing, the time units were from 2006 to 2012, the time interval was 1 year, and the risk population radius was set at 15%. The statistical significance level was p<0.05.29
Spatial regression analysis
We used spatial regression analysis to analyse the spatial correlation of the AIDS epidemic and economic input in Chongqing. We used five economic indicators as independent variables, and new HIV cases, new AIDS cases, and people currently living with HIV as separate dependent variables. We analysed the spatial correlation of the Chongqing AIDS epidemic and economic input. Using GoeDa 0.95i software, we first used ordinary least squares (OLS) regression to determine spatial dependence, and then examined whether the spatial error model or the spatial lag model was better. The result showed that the spatial lag model was the most appropriate for our data. Finally, we used Rook's contiguity weight for estimating the spatial regression; the results are shown in table 1.30
LM lag spatial regression analysis of the effect of economic inputs on HIV/AIDS spatial distribution
Spatial clustering analysis was performed using ArcGIS 10.0 software, temporal-spatial clustering analysis using SaTScan V.9.1 software, and spatial regression analysis using SpaceStat V.2.2 software.
Results
Spatial distribution of HIV/AIDS
From 2006 to 2012, a total of 12 026 new HIV cases and 4896 new AIDS cases were reported in Chongqing. At the end of 2012, Chongqing had 14 506 people living with HIV. The average annual new HIV infection rate, new AIDS incidence rate and rate of people living with HIV were 5.97, 2.42 and 28.12 per 100 000, respectively. At the county level, the new HIV infection rate was 0.79–21.92 per 100 000, the new AIDS incidence rate was 0.32–9.13 per 100 000, and the rate of people living with HIV was 3.41–99.12 per 100 000. As seen in figure 2, the HIV/AIDS new disease incidence rate and the rate of people living with HIV were higher in the Yuzhong, Jiangjin, Dazu and Beibei districts than in the other regions of Chongqing, and the HIV/AIDS epidemic was worse in western Chongqing than in eastern and northern regions.

Spatial distribution of HIV/AIDS annualised average incidence and prevalence in Chongqing, China, 2006–2012. (A) Annualised average incidence of HIV, (B) annualised average incidence of AIDS, and (C) annualised average prevalence of HIV.
Spatial clustering analysis
We conducted a global autocorrelation analysis of the numbers of new HIV cases, new AIDS cases, and people living with HIV in Chongqing, and the obtained Moran's I values were 0.399 (p=0.029), 0.310 (p=0.011) and 0.419 (p=0.014), respectively. This result showed that the distribution of the HIV/AIDS epidemic in Chongqing showed spatial autocorrelation.
We used the Getis Gi* to identify hotspots of HIV/AIDS incidence and prevalence in Chongqing. If Gi*>1.96, it indicates that HIV/AIDS prevalence in the region is higher than in other regions,31 and the region is defined as a hotspot. We used the Getis Gi* of the three epidemic indicators to screen for hotspots and identified the same 15 districts and counties: Dadukou, Jiulongpo, Shapingba, Yuzhong, Bishan, Yongchuang, Tongliang, Banan, Beibei, Nanan, Hechuang, Jiangjin, Dazu, Yubei and Jiangbei. These areas were primarily concentrated in the western region of Chongqing, that is, in urban Chongqing as well as in the surrounding counties.
For these 15 areas, the rates of new HIV infections were 4.01–21.92 per 100 000, the new AIDS incidence rates were 0.87–9.13 per 100 000, and the rates of people living with HIV were 16.74–99.12 per 100 000. The average annual new HIV infection rate was 10.64 per 100 000, the average new AIDS incidence rate was 4.78 per 100 000, and the average rate of people living with HIV was 49.76 per 100 000 (for further results, see online supplementary appendixes 1 and 2).
Spatial-temporal clusters
We used the Poisson distribution model for spatial and temporal analysis, and the risk population radius was set at 15%. Figure 3 shows that the HIV/AIDS epidemic in Chongqing also had a non-random spatial and temporal distribution. The most likely cluster times for the three epidemic indicators were all during 2010–2012, but the most likely clusters in space were somewhat different.

Spatial-temporal clusters of HIV/AIDS in Chongqing, China, 2006–2012. (A) Cluster distribution of new HIV cases, (B) cluster distribution of new AIDS cases, and (C) cluster distribution of the number of people living with HIV.
The most likely location for a cluster of new HIV cases was Beibei, Yubei, Jiangbei, Yuzhong or Nanan. The cluster centre was located at 29°85′ N, 106°71′ E, the cluster radius was 38.70 km, the average annual rate within this range was 16.40 per 100 000, and the RR was 3.09 (p<0.001).
The most likely location for a cluster of new AIDS cases was Bishan, Jiulongpo, Dadukou, Shapingba, Nanan or Yuzhong. The cluster centre was located at 29° 41′ N, 106° 33′ E, the cluster radius was 34.45 km, the average annual rate within this range was 9.2 per 100 000, and the RR was 4.00 (p<0.001).
The most likely location for a cluster of people living with HIV was Jiangjin, Yongchuang, Bishan, Dazu or Rongchang. The cluster centre was located at 29° 26′ N, 105° 83′ E, the cluster radius was 49.12 km, the average annual rate within this range was 77.8 per 100 000, and the RR was 3.22 (p<0.001).
We also obtained several secondary clusters for the three epidemic indicators. The secondary clusters of new HIV cases were primarily located in south-western and south-central Chongqing, those of new AIDS cases were primarily located in south-western and north-western Chongqing, and those of people living with HIV were primarily located in south-western and south-central Chongqing (for further details of secondary clusters, see online supplementary appendix 3).
Economic input analysis
The five economic indicators of HIV/AIDS prevention and control from 2006 to 2012 in Chongqing are shown in online supplementary appendixes 4 and 5. The Chongqing AIDS special funds showed an upward trend (r=0.949, p=0.001), increasing from US$820 062 in 2006 to US$2 584 962 in 2012 (see online supplementary appendix 5A). The unit cost of high-risk population intervention showed a declining trend over the years (r=−0.791, p=0.034) (see online supplementary appendix C), while the unit cost of public awareness showed an increasing trend over the years (r=0.785, p=0.037) (see online supplementary appendix D). AIDS antiviral therapy unit cost did not show any trend (r=−0.431, p=0.335) (see online supplementary appendix B). Supervision costs did not show any trends in their ratio of AIDS special funds (r=−0.258, p=0.577) (see online supplementary appendix E).
We used spatial autoregressive (SAR) models in GeoDa 0.95i software to perform a spatial regression analysis for the numbers of new HIV cases, new AIDS cases, and people currently living with HIV and economic input factors in order to assess the relationship between the spatial distribution of the HIV/AIDS epidemic and economic inputs. The results of OLS regression indicated that the number of new HIV cases, new AIDS cases, and people currently living with HIV all showed spatial dependence, and in the SAR model, the spatial lag model was the most appropriate (p=0.005, p=0.012 and p<0.001, respectively). Spatial regression results are shown in table 1. The results showed that factor 1 (total input of the special funds dedicated to AIDS) had positive correlations with the numbers of new HIV cases, new AIDS cases, and people living with HIV (regression coefficients were 0.775, 0.976 and 0.816, respectively; p<0.001). Factor 4 (public awareness unit cost) had negative correlations with the numbers of new HIV cases, new AIDS cases, and people living with HIV (regression coefficients were −0.188, −0.259 and −0.215, respectively; p<0.01).
Discussion
The new HIV infection rate, the new AIDS incidence rate, and the rate of people living with HIV reflect the AIDS epidemic and the effects of AIDS prevention and treatment. The spatial clustering analysis results for the three epidemic indicators showed that HIV/AIDS showed spatial autocorrelation; this result is consistent with the spatial distribution of the AIDS epidemic in Yunnan.23 The results from spatial distribution analysis (figure 2) showed that high new HIV infection rates mostly occurred in the western region, while high AIDS incidence rates and high rates of people living with HIV occurred in the western region and decreased to the north. The results from spatial clustering analysis (see online supplementary appendix 2) showed that these three indicators had the same 15 hotspots, that is, Chongqing City and its 15 surrounding districts and counties. The spatial distribution of the three indicators were more precise and accurate than the results of spatial clustering analysis on distribution density. Figure 2 shows that high AIDS rates and high rates of people living with HIV occur in the western region and decrease to the north, but they did not show clustering. In online supplementary appendix 2, the three indicators show the 15 same hotspots. The two results are in agreement as both spatial distribution analysis (figure 2) and spatial clustering (online supplementary appendix 2) showed that the western region of Chongqing was the region of most concern concerning HIV/AIDS prevention and intervention.
As the results demonstrate, HIV infection can develop into AIDS, and the consistency in spatial clustering among the three factors reflects this intrinsic link. The 15 districts and counties have a higher average economic level, population density, and proportion of migrants than other districts and counties,1 suggesting that these factors may be related to HIV/AIDS spatial clustering. This view is consistent with the findings of Anderson et al,32 who suggest that the AIDS epidemic in China is negatively impacted by migrating populations.
The temporal-spatial clustering analysis identified the most likely cluster and several secondary clusters for the three epidemic indicators. The time windows were mainly concentrated in 2010–2012, indicating that the incidence and prevalence of HIV/AIDS are increasing, while the aggregations show significant temporal characteristics, which are consistent with the findings of Ding et al.33 In contrast with the hotspot analysis, the most likely cluster and several secondary clusters for the three epidemic indicators differ, due to the fact that the hotspot analysis did not consider the time factor and arbitrarily conducted static scale selection, and because the results obtained were crude. However, the spatial-temporal scanning method achieved effective temporal and spatial integration and was able to evaluate the clustering in different time windows to achieve a dynamic, three-dimensional and multi-scale analysis, making the results more precise.34 For enclaves of new HIV cases, especially in Beibei, Yubei, Jiangbei, Yuzhong and Nananthe, the government should strengthen HIV prevention among high-risk groups such as MSM, IDU and FSW. For enclaves of new AIDS cases, especially in Bishan, Jiulongpo, Dadukou, Shapingba, Nanan and Yuzhong, the government should strengthen drug intervention measures. For enclaves of people living with HIV, especially in Jiangjin, Yongchuang, Bishan, Dazu and Rongchang, the government should simultaneously strengthen prevention in the high-risk population and drug intervention in HIV-infected populations.
The spatial regression analysis showed that special funds for AIDS and public awareness unit costs are positively and negatively correlated, respectively, with the spatial clustering characteristics of HIV/AIDS. The Chongqing AIDS special funds covered high-risk population intervention costs, public awareness costs, antiretroviral therapy costs and supervision costs. The main funding sources included the Global Fund to Fight AIDS (referred to as the Global Fund), a central government transfer payment for AIDS prevention and treatment projects, the Ministry of Health of the People's Republic of China, the Office of the State Council AIDS Working Committee Office, and the US Bill & Melinda Gates Foundation AIDS prevention and care project (China-Gates project).
From the perspective of prevention, we hoped that more funds invested would lead to fewer HIV/AIDS cases. However, the present study found that these two factors showed a significant positive correlation (p<0.001), that is, an increase in special funds dedicated to AIDS led to an increase in HIV/AIDS incidence and the number of people living with HIV/AIDS. However, this study was a cross-sectional study, and the regression methods used here were only for exploratory analysis. The study aimed to determine if there was an association between HIV/AIDS epidemic indices and economic indices of AIDS prevention and treatment, but the relationship was not necessarily causal. So the positive correlation could be interpreted negatively: the increase in HIV/AIDS incidence and in the number of people living with HIV/AIDS resulted in increased AIDS special funds. This positive correlation may be caused by the HIV ‘iceberg phenomenon’,35 where the numbers of people reported and identified as infected with HIV are only the ‘tip of the iceberg’, as a considerable portion may have not been detected or may have become recessive cases. Therefore, more input leads to a larger population targeted by AIDS prevention and control, and so more new HIV infection cases are identified, demonstrating the phenomenon of ‘the more input, the higher the incidence’.
The unit cost of public awareness showed a negative correlation with HIV/AIDS spatial clustering (p≤0.002): an increase in the unit cost of public awareness leads to decreased HIV/AIDS incidence and cases currently living with HIV/AIDS. The above findings suggest that in terms of usage, special funds dedicated to AIDS should ensure an increase in the unit cost of public awareness in addition to increases in the range of populations covered by AIDS prevention, control and interventions, in order to reduce the HIV/AIDS incidence and prevalence.
Limitations
This study was a cross-sectional study, and the regression methods used here were only for exploratory analysis. It aimed to determine if there was an association between HIV/AIDS epidemic indices and economic indices of AIDS prevention and treatment, but the relationship was not necessarily causal. Consequently, we were not able to determine if there was a time lag between policy change and disease rate change. The numbers of HIV/AIDS cases were identified from government surveillance data and were derived from populations covered by the monitoring sites in each district and county; however, recessive cases in untested populations were not included in the analysis. In addition, the time span of the present study was 7 years (2006–2012), which was not long, so we hope to continue to study the subsequent spatial and temporal distribution of the AIDS epidemic in future studies.
Acknowledgments
We would like to thank the Division for AIDS/STD Control and Prevention, Chongqing Center for Disease Control and Prevention for providing the data for HIV/AIDS cases in Chongqing.
References
Supplementary materials
Supplementary Data
This web only file has been produced by the BMJ Publishing Group from an electronic file supplied by the author(s) and has not been edited for content.
Files in this Data Supplement:
- Data supplement 1 - Online supplement
Footnotes
-
Contributors YZ and QX wrote the manuscript. DoY and YZ contributed to the design of the study. RL, LZ and DM participated in data collection and data preparation. QX and YZ performed the statistical analysis and presented the results. LL, RL and DaY revised the manuscript before submission.
-
Funding The study was supported by the Natural Science Foundation of China (No. 81172773 and 81202286) and the 2012 Global Fund China AIDS Program (No. CSO-2012-Research53).
-
Competing interests None.
-
Ethics approval This study was approved by the medical ethics committee of the Third Military Medical University and Chongqing Municipal Center for Disease Control (CQCDC).
-
Provenance and peer review Not commissioned; externally peer reviewed.
-
Data sharing statement No additional data are available.
-
Appendix 2: The distribution of hotspots in Chongqing, China, from 2006-2012 by (A) the average annual number of new HIV cases, (B) the average annual number of new AIDS cases, and (C) the annual average number of people living with HIV/AIDS. Appendix 5: Trends in economic input indicators from 2006 to 2012. (A) Factor 1: Trend in HIV/AIDS prevention and treatment special fund, (B) Factor 2: Trend in HIV/AIDS antiviral unit costs, (C) Factor 3: Trend in high-risk population intervention unit costs, (D) Factor 4: Trend in public awareness unit costs, (E) Factor 5: Trend in the proportion of supervision funding.