Article Text

Abstract
Objective To assess the driving fitness of patients with glaucoma by identifying specific areas and degrees of visual field impairment that threaten safe driving.
Design Case–control study.
Setting, and participants This prospective study included 36 patients with advanced glaucoma, defined as Humphrey field analyzer (HFA; 24-2 SITA standard program) measurements of mean deviation in both eyes of worse than −12 dB, and 36 age-matched and driving exposure time-matched normal subjects. All participants underwent testing in a novel driving simulator (DS) system. Participants were recruited between September 2010 and January 2012.
Main outcome measures The number of collisions with simulated hazards and braking response time in 14 DS scenarios was recorded. Monocular HFA 24-2 test results from both eyes were merged to calculate the binocular integrated visual field (IVF). The position of the IVF subfields in which the collision-involved patients had lower sensitivity than the collision-uninvolved patients was compared with the track of the hazard. The cut-off value to predict an elevated risk of collisions was determined, as were its sensitivity and specificity, with the area under the receiver operating characteristic (AUROC) curve.
Results Patients with advanced glaucoma were involved in a significantly higher number of collisions in the DS than the age-matched and driving exposure time-matched normal subjects (119 vs 40, respectively, p<0.0001), especially in four specific DS scenarios. In these four scenarios, IVF sensitivity was significantly lower in the collision-involved patients than in the collision-uninvolved patients in subfields on or near the track of the simulated hazard (p<0.05). The subfields with the largest AUROC curve had values ranging from 0.72 to 0.91 and were located in the paracentral visual field just below the horizontal.
Conclusions Our novel DS system effectively assessed visual impairment, showing that simulators may have future potential in educating patients.
- driving fitness
- visual impairment
This is an Open Access article distributed in accordance with the Creative Commons Attribution Non Commercial (CC BY-NC 4.0) license, which permits others to distribute, remix, adapt, build upon this work non-commercially, and license their derivative works on different terms, provided the original work is properly cited and the use is non-commercial. See: http://creativecommons.org/licenses/by-nc/4.0/
Statistics from Altmetric.com
Strengths and limitations of this study
-
By newly establishing a driving simulator assessment system for patients with visual impairment, we found that this system successfully enabled patients with glaucoma to understand the specific risks they face of motor vehicle accidents in a variety of common driving situations.
-
This simulating system successfully revealed that the degree of risk of collisions depends on the area and degree of visual field impairment.
-
Lack of a sufficient population to act as a normative reference.
Introduction
Adequately evaluating driving fitness is necessary to ensure safe driving. Many factors and conditions can negatively affect the behaviour and performance of drivers, particularly medical disorders such as dementia, diabetes, seizures and sleep disorders.1 Driving authorities in many countries have therefore established guidelines to enable physicians to make appropriate decisions on the driving fitness of patients with these conditions.2–5
Visual ability is essential to safely control a vehicle and avoid motor vehicle accidents (MVAs), creating a need for guidelines to identify patients who have lost their driving fitness. However, previous studies of the role of visual ability in driving, particularly the roles of the visual field and visual acuity, but also contrast sensitivity and colour vision, have not been sufficient to produce adequate guidelines.2
Visual impairment arising from defects in visual ability caused by any of a number of different ocular and neurological conditions is one of the most common medical disorders affecting MVA risk.6–10 However, it is difficult to investigate the effect of visual field impairment on driving fitness because the area and degree of impairment varies between individuals and between diseases that affect the visual field, such as glaucoma. These variations can obscure the relationship between visual field defects and MVA risk, because these individuals may voluntarily give up driving11 ,12 (a similar problem affects research on individuals with severely impaired visual acuity, ie, worse than 20/100). Glaucoma, for example, which is characterised by progressive optic neuropathy causing a varying degree of visual field loss, does not affect central visual acuity in most cases.13 As a result, most patients with glaucoma , even those with severely impaired visual fields, are able to pass visual acuity tests and are permitted to receive or retain driving licenses. Moreover, glaucoma affects many people who remain unaware of it (in Japan, 90% of patients are undiagnosed14), since the disease is painless and vision is lost only very gradually. While some countries and territories (including the UK and New York State) have defined a minimum field of vision for drivers, many countries only require drivers to have adequate visual acuity. Therefore, there is an evident need to develop a method to alert patients with visual field impairment to their limitations.
The risk of MVAs is a critical problem facing visually impaired patients. Many patients will remain unaware of the risk until they actually experience an MVA, but actual MVA involvement is rare. Alerting patients to the MVA risks they face and establishing appropriate cut-off values for measurable parameters of the visual field are promising ways of reducing both the incidence of MVAs and the unjustifiable removal from the road of drivers who have retained their fitness to drive. As a first step towards helping patients with visual impairment understand their condition, as well as towards gathering information to help create cut-off points for safe driving, we decided to use a driving simulator (DS) to identify crucial areas and degrees of visual field impairment. In the future, this information should provide information to patients on their risk of MVAs. DSs, by removing the influence of driving technique as a confounding factor, provided a valuable opportunity to achieve this goal. Past studies have confirmed that DS systems are a powerful means of evaluating the effect on driving ability of alcohol,15 lack of sleep16 and drug use,17 as well as hemianopia18–20 and other visual field defects.21–26 Moreover, DSs have been found to compare favourably with on-road testing.27 ,28 In the present study, patients with glaucoma with advanced visual field damage served as a model of visual impairment. We assessed these patients by a newly established DS system and identified the areas and degrees of visual field impairment that constituted threats to safe driving. Thus, the present findings illustrate a novel system to help patients understand the limits placed on their driving fitness by their disorder.
Subjects and methods
Driving simulator
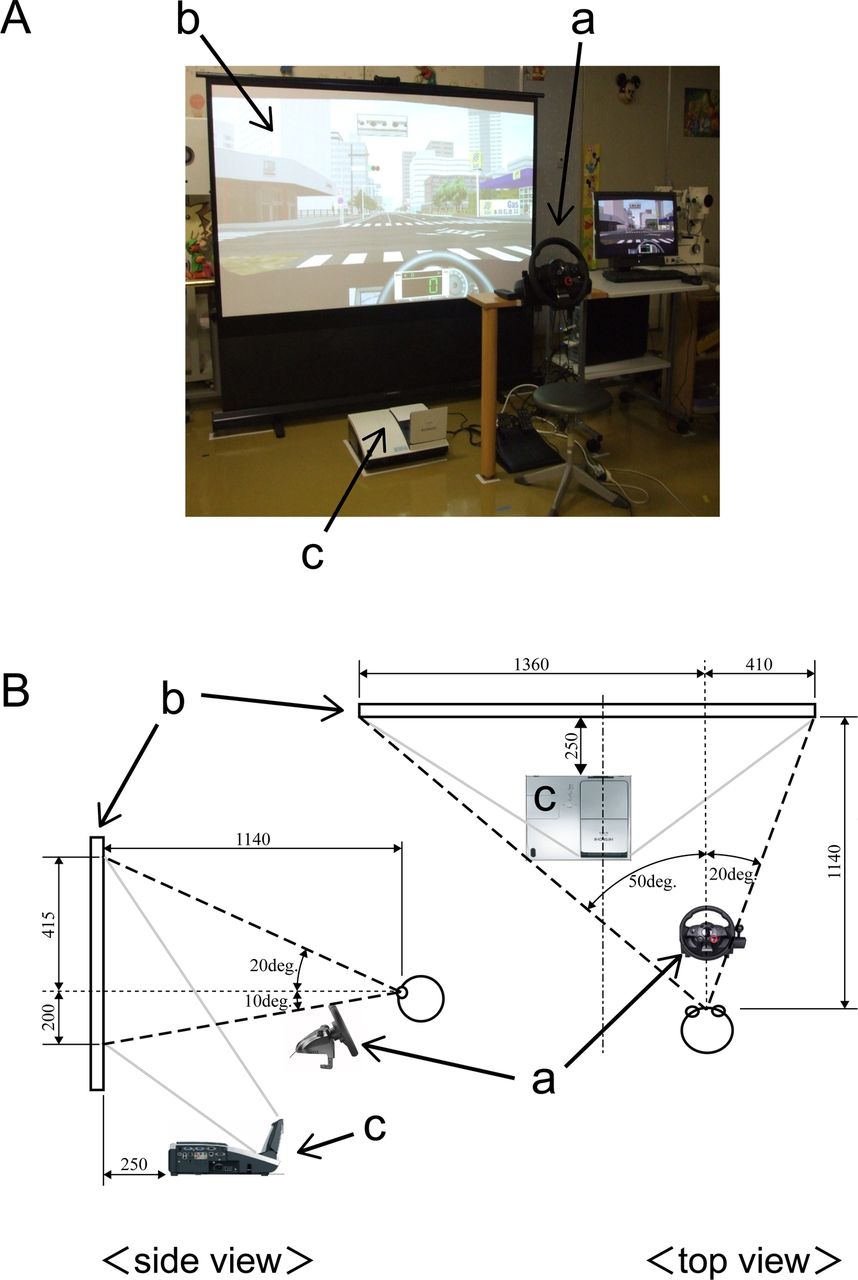
The DS used in this study was a modified version of the Honda Safety Navi system (Honda Motor Co., Tokyo, Japan), a DS used for instruction in efficient, safe driving. The system consists of an ultra short-throw projector (CP-A200J, Hitachi, Ltd., Tokyo, Japan), an 80-inch portable projection screen (GFP-80HDW, Kikuchi Science Laboratory, Tokyo, Japan), a steering wheel and brake and accelerator pedals (LPRC-14 500, Logitech International S.A., Morges, Switzerland; figure 1A). The entire system only requires an area of 180 cm×120 cm, making it usable in the limited space of an ophthalmological outpatient department.

Driving simulator: HONDA Safety Navi Glaucoma Edition. (A) Overall view and (B) side view and top view. a, Driving console (steering wheel, brake, gas pedals) and PC; b, portable screen; c, ultra-short throw lens projector.
The system simulated the driver's view through the windshield of a right-hand-drive automobile (field of view on the screen: upper, 20°; lower, 10°; right, 20°; left, 50°; figure 1B). Before the test began, the participants were informed as to what type of hazard (eg, an oncoming right-turning vehicle) they would encounter. The examinees were not required to operate the steering wheel or accelerator. The only requirements were to keep their gaze centred on the road ahead and to brake when they felt it was necessary. There were no cars driving ahead of the examinee in any of the simulations. When the accelerator was applied, the DS automatically moved at a preset speed: 50 km/h on wide roads and 30 km/h on narrow downtown streets. These driving conditions were consistent in each scenario and for each examinee. The examinees undertook a 2 min practice session followed by the 5 min main test.
The main test included 18 scenarios: in 4, examinees were required to follow traffic signals or stop signs; in 2, examinees were required to avoid oncoming right-turning vehicles, and in 12, children or vehicles rushed out from the sides.
In each scenario, we recorded the occurrence of a collision and brake time, which was defined as the time from when the hazard, that is, the signal, vehicle or child, appeared on the screen to the time the examinee braked. Brake time was not recorded when the examinee collided without braking. In a replay of the simulation, the track of the hazard on the screen was exactly reproduced as (x(t), y(t)), where t denotes the elapsed time from when the hazard appeared on the screen.
Subjects
Forty-four patients with advanced glaucoma and 46 normal subjects from the Department of Ophthalmology of Jichi Medical University and Tajimi Iwase Eye Clinic were initially invited to participate in this study from September 2010 to January 2012. After matching was performed for age and driving exposure time, 36 patients with advanced glaucoma (24 male and 12 female) <70 years old, and 36 age-matched and driving exposure time-matched normal subjects (18 male and 18 female) were included. The Ethics Committee of Jichi Medical University approved the research at both institutions (rinA10-62). Written informed consent was obtained from all participants. All aspects of the protocol conformed to the tenets of the Declaration of Helsinki. All participants were currently licensed to drive in Japan, which requires either (1) binocular visual acuity of 20/30 or (2) monocular visual acuity of 20/30, with a minimum monocular visual field of 150° horizontally on a modified Förster perimeter.
Before using the DS, all participants were asked to complete a questionnaire on their demographic characteristics: (1) age and sex; (2) driving habits and history (years since acquisition of first driving license, time spent driving per week and MVA involvement over the previous 5 years and (3) current illnesses and medical history. They also had a complete ophthalmological examination, including best-corrected visual acuity, a slit lamp examination, intraocular pressure (IOP) measurement with Goldmann applanation tonometry, gonioscopy, a stereoscopic fundus examination and standard automated perimetry (SAP) with the Humphrey 24-2 Swedish Interactive Threshold Algorithm (HFA24-2, Carl Zeiss Meditec Inc., Dublin, California, USA).
The normal subjects had no history of ocular symptoms or disease and no history of treatment with intraocular incisional or laser surgery. Their eyes had an IOP <22 mm Hg, with no history of IOP elevation, and had normal results in a biomicroscopic examination, an examination with indirect ophthalmoscopy through an undilated pupil and a visual field examination with the HFA 24-2 program.
Patients were defined as having glaucoma if at least two reliable visual field examinations confirmed the presence of glaucomatous visual field defects consistent with glaucomatous optic disc changes. Patients were defined as having advanced glaucoma when both eyes had a mean deviation of <−12 dB.29
Patients were excluded if they had significant media opacities or other intraocular or neurological diseases affecting the visual field. Eyes with unreliable visual field results (fixation loss >20%, false-positive >15%, or false-negative >33%) were also excluded.
Integrated visual field
The binocular integrated visual field (IVF) was calculated by merging the two results from the monocular HFA 24-2 test, using the patients’ best point-by-point monocular sensitivity.30–32 The IVF consisted of 52 test points, each effectively representing a 6°×6° visual field area (the IVF subfields).
In a number of the DS scenarios, the patients with advanced glaucoma were significantly more likely to be involved in collisions. We therefore performed a more detailed investigation of these specific scenarios by comparing the visual field sensitivity at 52 IVF subfields (the IVF sensitivity) in the patients who were involved in collisions and in those who were not.
We also compared the track of the hazard across the screen, which moved through multiple visual subfields in each scenario, and the visual subfields in which the two groups showed significantly differing IVF sensitivity. We assumed that the centre of the IVF coincided with the centre of the image, since we had instructed the participants to keep their gaze, that is, their fixation, centred in the direction of the car's motion. However, as the simulation was of a right-hand drive vehicle, the screen was not centred in front of the participants, and their gaze was slightly off-centre. To compensate for this in our analysis, we therefore used gnomonic projection to map the 52 IVF subfields onto the image of the simulation.
This comparison, combined with data for the braking time of each participant, yielded data on the specific visual subfields that played a crucial role in avoiding MVAs, as well as the necessary degree of sensitivity in those subfields.
Statistical analysis
Differences in demographic characteristics were evaluated with the Mann-Whitney U test, χ2 test or Fisher's exact test. Additionally, we compared the number and incidence of collisions in the DS in patients with glaucoma and normal subjects with the χ2 test or Fisher's exact test.
IVF sensitivity in the 52 subfields in patients with glaucoma who were involved in collisions and in those who were not was also compared with the Mann-Whitney U test. The cut-off value to predict an elevated risk of collision, as well as its sensitivity and specificity, was determined with the area under the receiver operating characteristic (AUROC) curve.
All statistical analyses were made with JMP V.9.0. A p value less than 0.05 was considered statistically significant.
Results
There were no differences between the advanced glaucoma and normal control groups in age, sex or driving history, which included the years of driving experience, hours of driving exposure and number of MVAs in the previous 5 years (table 1). Seventeen of the 36 patients with glaucoma had undergone trabeculectomy in at least one eye, with the remaining 19 patients receiving only drug therapy. Nine of the 36 patients with glaucoma and four of the 36 normal subjects reported involvement in at least one MVA in the previous 5 years (Fisher's exact test, p=0.126). It is perhaps worth noting that the fact that there is no significant difference between the number of people involved in MVAs between normal subjects and patients with glaucoma is probably due in part to the low sample size.
Comparison of demographic, driving and vision characteristics of study participants by group
When using the DS, the incidence of collisions per scenario in the 36 normal subjects ranged from 0% to 72.2%. In four scenarios (a blue car approaching from the left; a child appearing from behind a truck; a motorcycle pulling out from the left, combined with an oncoming taxi; and a truck approaching from the right at an unmarked crossing), the incidence of collision was over 33%, suggesting that even for normal subjects, it was too difficult to avoid collisions in these scenarios. These four scenarios were consequently excluded from the further analysis.
In the remaining 14 scenarios, the patients with glaucoma were involved in significantly more collisions than the normal subjects (119 vs 40, respectively, p<0.0001). The average number of collisions per person was 1.1±1.3 in the normal subjects and 3.3±2.0 in the patients with advanced glaucoma (p<0.0001, table 2, the number of collisions that occurred without braking to online supplementary table S1). The average number of collisions was 3.6±1.7 for the nine patients with advanced glaucoma who reported involvement in at least one MVA in the previous 5 years, and 3.2±2.1 in the 27 who reported no MVA (t test, p=0.44). The average number of collisions in the simulator was 3.5±1.3 for the four normal subjects who reported involvement in at least one MVA in the previous 5 years, and 3.3±1.9 in the 32 who reported no MVAs (t test, p=0.78). Among participants in this study who had reported at least one MVA in the previous 5 years, neither the patients with advanced glaucoma nor the normal subjects were more likely to collide with the hazards.
Number and incidence of collisions in 14 scenarios (total participants=36)
Ten scenarios showed no significant differences in the incidence of collisions between the advanced glaucoma and normal control groups (table 2). In eight scenarios (four scenarios with a red signal and stop sign and four scenarios with vehicles approaching from the sides), the number of such collisions was too small to determine whether they were due to the patients having severe visual field loss. However, in two scenarios, the collisions were relatively frequent in both groups, and we were unable to determine the effect of visual field loss in these scenarios.
Finally, four specific scenarios (scenarios 3, 12, 14 and 16) showed a significant difference in the incidence of collision between the advanced glaucoma and normal control groups; two scenarios with oncoming right-turning vehicles (scenarios 3 and 14; p=0.0018 and p<0.0001, respectively), and two scenarios with vehicles approaching from the sides (scenarios 12 and 16; p=0.0018 and p=0.0051, respectively; table 2). These results suggested that of the original 14 scenarios, these 4 were the most representative of the heightened MVA risk arising from glaucomatous visual field damage. We therefore subdivided the patients with glaucoma into those involved and uninvolved in collision in these four representative scenarios, and compared their IVF sensitivity in 52 subfields.
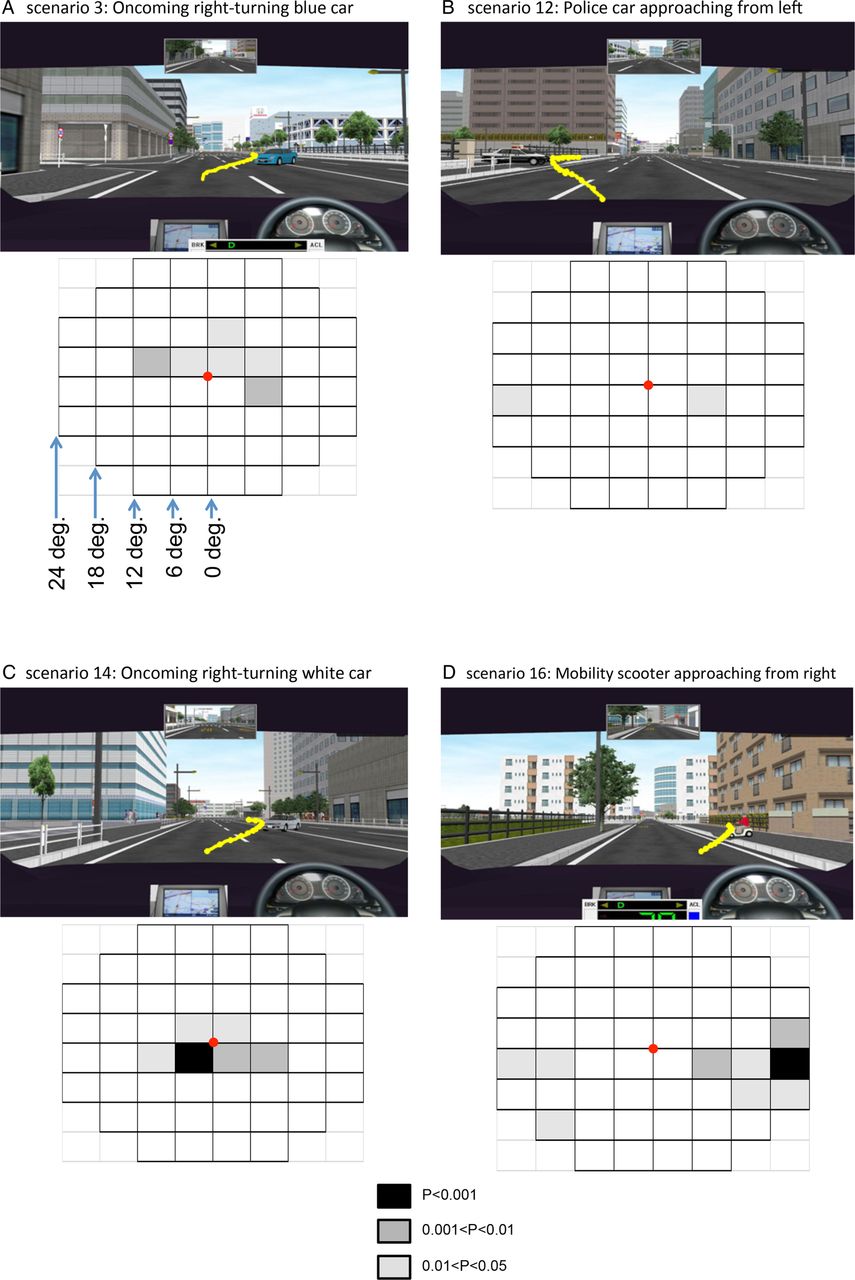
In all four representative scenarios, IVF sensitivity was lower in specific visual subfields in the collision-involved patients with glaucoma than in the collision-uninvolved patients. Figure 2 shows the IVF subfields together with a screenshot of the simulation. In each scenario, the yellow line shows the hazard's track, which was reconstructed from the recorded coordinates (x(t), y(t)). The greyscale-shaded boxes show the degree of difference in IVF subfields in the collision-involved and collision-uninvolved patients. In scenario 3, the region of low sensitivity was in the upper hemifield (within 11° from the fixation point) and in the lower right hemifield (from 6 to 11°; figure 2A, online supplementary figure S1A). In scenario 12, it was in the lower left hemifield (from 18 to 24°) and in the lower right hemifield (from 6 to 11°; figure 2B, online supplementary figure S1B). In scenario 14, it was in the upper hemifield (within 5°) and in the lower hemifield (within 11°; figure 2C, online supplementary figure S1C). In scenario 16, it was in the upper right hemifield (from 18° to 24°), in the lower left hemifield (from 12° to 24°) and in the lower right hemifield (from 6° to 24°; figure 2D, online supplementary figure S1D).

Screenshots of the simulations and integrated visual field (IVF) subfield maps. In the screenshots, the yellow line indicates the track of the hazard across the image. In the IVF subfield maps, the grey boxes indicate significant differences in IVF sensitivity between the collision-involved patients and the collision-uninvolved patients. The greyscale applied is shown on the bottom centre. Each subfield covers 6° of the visual field. (A) Scenario 3. The simulated vehicle speed was 50 km/h. A blue car ahead of the vehicle turned right into its path. This hazard appeared 10° right of centre and moved left. IVF sensitivity was reduced within 11° in the upper hemifield and from 6° to 11° in the lower right hemifield. (B) Scenario 12. The simulated vehicle speed was 50 km/h. A police car crossed the path of the vehicle after exiting a parking area on the left. This hazard appeared 10° below centre, moved left and then moved right. IVF sensitivity was reduced from 18° to 24° in the lower left hemifield and from 6° to 11° in the lower right hemifield. (C) Scenario 14. This scenario was similar to scenario 3. IVF sensitivity was reduced within 5° in the upper hemifield and within 11° in the lower hemifield. (D) Scenario 16. The simulated vehicle speed was 30 km/h. A mobility scooter crossed the path of the vehicle from the right. This hazard appeared 15° right of center, moved left and then moved lower left. IVF sensitivity was reduced from 18° to 24° in the upper right hemifield, from 12° to 24° in the lower left hemifield and from 6° to 24° in the lower right hemifield.
To investigate the impact of sensitivity loss in these specific IVF subfields, we superimposed a gnomonic projection of the IVF grid (see above) onto an image of the simulation that included the track of the hazard, as well as the hazard's outline at the median brake time of the collision-uninvolved patients (figure 3).This analysis revealed that the collision-involved patients with glaucoma had significantly lower IVF sensitivity in the subfields on or near the track of the hazards than the patients who avoided collisions. We thus decided to further analyse these IVF subfields, which were located along the path of the hazard.

Crucial integrated visual field (IVF) subfields were near the hazard. The green line represents the track of the leading edge of the hazard overlaid on the IVF. X indicates the position of the hazard on the track at the median time that the collision-uninvolved patients braked, and the red lines indicate the outline of the hazard. The dark areas are subfields with lowered IVF sensitivity. In the four scenarios shown here, the track of the hazard was located in or near subfields with lowered IVF sensitivity.
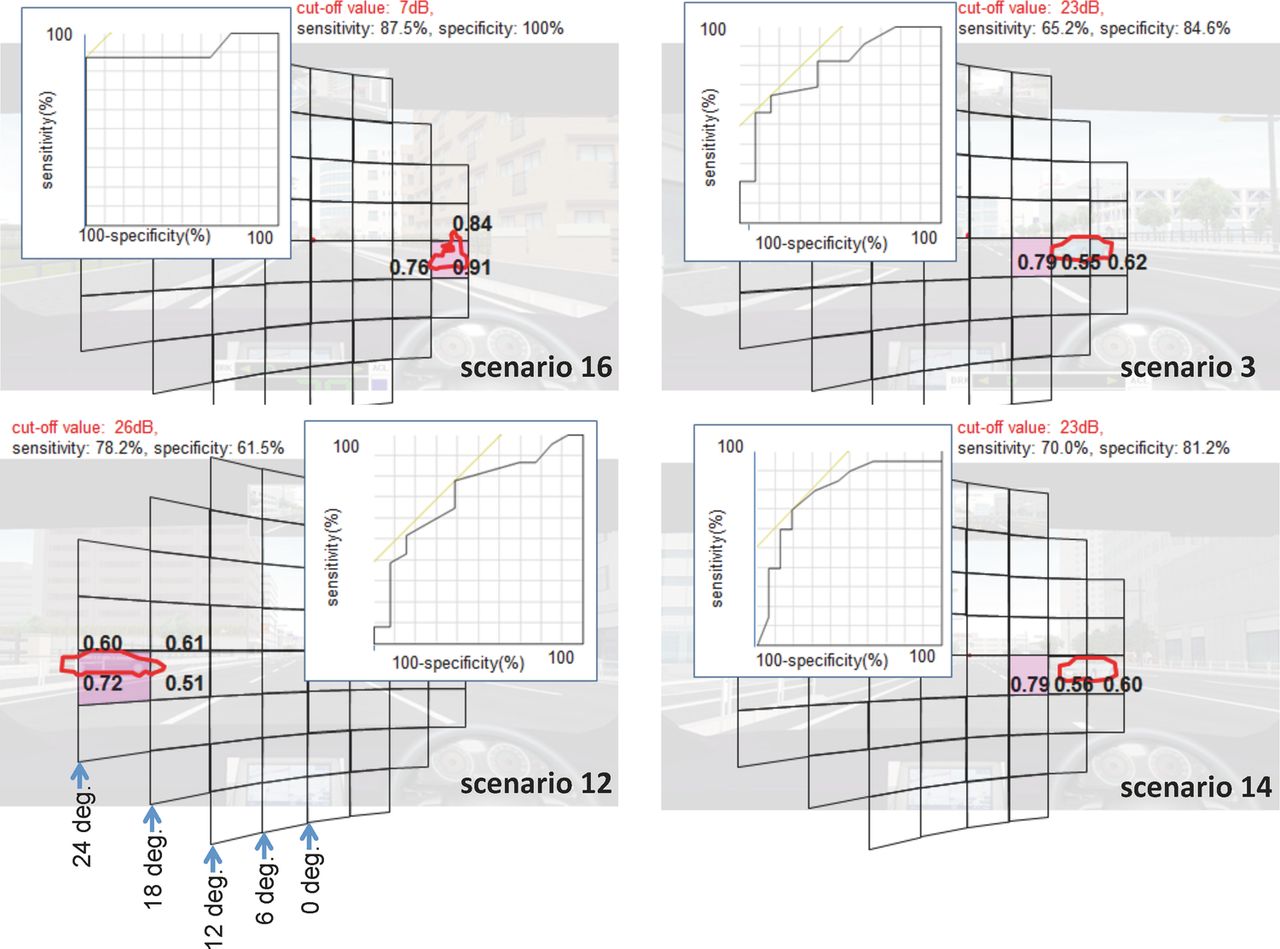
We therefore proceeded to measure the predictive accuracy of these IVF subfields for collisions with a receiver operating characteristic analysis. This analysis also included the subfields that overlapped the hazard at the median brake time of the collision-uninvolved patients (figure 4). In scenario 16, we found that the particiants who avoided collisions braked at a median time of 1.5 s. In the screenshot of this time point, the hazard covered three subfields located 12–24° from the assumed fixation point on the right. Among these subfields, the subfield with the largest AUROC curve had a value of 0.91. A cut-off value of 7 dB in this area had a sensitivity of 87.5% and a specificity of 100%, indicating that patients with sensitivity less than 7 dB in this area had an elevated risk of collision with the hazard in this scenario. Using the same method, in scenario 3, the largest AUROC value was 0.79 and a cut-off value of 23 dB had a sensitivity of 65.2% and a specificity of 84.6%. In scenario 12, the highest AUROC value was 0.72 and a cut-off value of 26 dB in this area had a sensitivity of 78.2% and a specificity of 61.5%. Additionally, in scenario 14, the largest AUROC value was 0.79 and a cut-off value of 23 dB had a sensitivity of 70% and a specificity of 81.2%. Figure 4 shows the subfields that we identified as having a high diagnostic ability among these subfields. These subfields were all located in the paracentral visual field just below the horizontal.
Subfields with the largest area under the receiver operating characteristic curve (AUROC). The AUROC was calculated for the subfields on or near the hazard at the median time that the collision-uninvolved patients braked. The largest AUROCs were 0.91 in scenario 16, 0.79 in scenario 3 and scenario 14, and 0.72 in scenario 12.
It was thus possible, using this analysis, to identify cut-off values for IVF sensitivity in specific subfields that were able to predict an elevated risk of MVAs in each scenario.
Discussion
In this study, we established a novel DS system that allowed us to assess, for the first time, the areas and degrees of visual field impairment that increased the risk of MVA involvement in patients, and to help these patients understand their disorder. Previously, research in this area had been prevented by the difficulty of studying the vast diversity of areas and degrees of visual field impairment that can arise in patients, particularly those with glaucoma. This diversity leads to considerable variation in MVA risk, and can mask the relationship between visual field impairment and risk.
Using the novel system described here, we found that patients with advanced glaucoma were involved in a significantly higher number of collisions in the DS than age-matched and driving exposure time-matched normal subjects, especially in four specific DS scenarios. Superimposing an image of the hazard's track over a map of the patient's IVF showed that when the hazard was located in or near an affected area of the IVF, a collision was more likely. This finding leads us to speculate that subfield-specific reduced IVF sensitivity caused the participants to notice the hazard too late to apply the brake before colliding.
Prado Vega et al26 studied the effect of task complexity in a DS and found that it had a significant impact on patient performance. Our DS may therefore have underestimated the risk of collisions due to the simplicity of the task presented to the patients: they did not need to operate the steering wheel or accelerator, only to watch the road and brake. Nevertheless, we observed a significant difference in the number of collisions in the DS between the patients with advanced glaucoma and the age-matched and driving exposure time-matched normal subjects, suggesting that our results can be considered valid.
DS systems provide controlled conditions that have been specifically designed to test driving performance.33 This is a notable advantage for investigations of the relationship between MVAs and different patterns of visual field impairment, such as those found in patients with advanced glaucoma. In our DS system, the hazards moved through multiple visual subfields, allowing us to identify specific visual subfields, and the degree of visual function in them, necessary to avoid MVAs in a variety of real-world situations. In a previous DS study that included 40 patients with glaucoma with mild to moderate visual field damage, Szlyk et al22 found an association between the number of collisions in a DS and the extent of peripheral visual field loss. A DS study by Bronstad et al,25 which included 11 patients with central field loss, found that reaction times were lengthened when pedestrians appeared in the damaged area of a patient's visual field, and concluded that this was primarily due to the scotoma. Those findings are consistent with the results of this study, but previous studies were unable to identify the areas and degrees of visual field impairment that increase the risk of MVAs. Additionally, previous reports included older patients with only mild or moderate visual field loss. Since age is known to affect MVAs,34 ,35 we included only patients with glaucoma less than 70 years old, with advanced visual field damage, as well as age-matched and driving time-matched healthy controls. We believed that this approach was more likely to reveal details of the influence of visual field impairment on driving fitness.
A key limitation of this study was the use of an assumed fixation point in the analysis. There is thus no way of confirming that the participants used a consistent fixation point. This is an especially important point for further research, because the natural eye movements of patients with visual field defects may become altered in order to compensate for their condition, for example, by scanning their blind side.36 Nevertheless, we believe that our approach was reasonable. Before the simulation, we instructed our subjects to keep their gaze centred on the road ahead. During the subsequent analysis, we chose a point on the image matching the direction of the vehicle's forward motion, which served as the assumed fixation point. Crabb et al37 reported that the saccades made by patients with glaucoma had an amplitude within 5° and were more numerous than those made by controls. Their study allowed for natural scanning to take place, unlike the current study, but since one IVF subfield represents 6°×6° of the visual field, we therefore believe that the patients’ actual fixation most likely stayed within a single grid in the IVF subfield arrangement. Nevertheless, we could not confirm that the patients maintained fixation at the assumed fixation point and future investigations may benefit from monitoring the fixation of the patients with eye-tracking devices similar to those used in existing reports.26 ,37–41
The instruction to maintain fixation in the centre of the screen may have made the simulation unnatural, because normal driving behaviour involves constant scanning of the driving scene and the need to respond as quickly as possible to unexpected hazardous events. The simulation also had other differences with normal driving: the participants did not operate the steering wheel or accelerator, did not monitor their speed with the speedometer, and did not see any cars on the road other than the target hazard. The task the patients were asked to complete was therefore in many respects not a natural simulation of real driving. However, we consider that this simplification of normal driving tasks was crucial in allowing us to examine the effects of visual field defects on MVCs with sufficient precision and clarity.
Additionally, in our study, only four scenarios were identified. Further testing may reveal other subfields that are also crucial for safe driving. Finally, a larger-scale study would allow more precise identification of specific patterns of visual field impairment that threaten the ability to drive safely.
Our system promises to help patients with glaucoma understand which driving situations are particularly risky for them, and may be a valuable future part of education for patients with visual impairment. Actual MVA involvement is rare, and the experience of collisions, even in a DS, is a powerful educational tool. Patient education is particularly important in glaucoma, as even patients with advanced glaucomatous visual field damage often do not recognise the extent of their disability.42 Moreover, patients face different MVA risks in different situations according to their individual patterns of visual field defects. It is therefore essential that patient education for glaucoma include advice on safe driving that is based on a patient's specific pattern of defects. This study provides the foundation for future research into DS systems for glaucoma testing. These systems may provide glaucoma specialists with a valuable source of information for formulating driving advice, and also enable patients themselves to objectively evaluate their own driving ability by watching a recording of their performance (online supplementary video). Thus, DS testing promises to help patients with glaucoma understand the specific risks they face at an early stage. It may also help prevent or reduce MVA involvement before patients become involved in collisions in the real world. Testing with DS systems also has potential usefulness as part of an education system to warrant the driving fitness of patients with glaucoma.
Conclusion
We found that patients with advanced glaucoma were involved in a significantly higher number of collisions in a DS than age-matched and driving exposure time-matched normal subjects, especially in the four DS scenarios. Furthermore, the degree of risk depended on the area and degree of visual field impairment. Among patients with glaucoma, IVF sensitivity was significantly lower in the collision-involved patients than in the collision-uninvolved patients in subfields on or near the track of the hazards. This subfield-specific reduced IVF sensitivity appeared to cause the patients to notice the hazard too late to apply the brake in time. Furthermore, we found that in crucial subfields for each scenario, a statistical analysis was a reliable way to determine IVF sensitivity cut-off values that could predict an elevated risk of MVAs.
This is thus the first report to illustrate a new system in which a DS was used to evaluate driving performance in patients with visual impairment, and also to help patients understand the elevated risk of the MVAs they face in specific driving situations.
Acknowledgments
The authors would like to thank Yu Yokoyama, MD (Department of Ophthalmology, Tohoku University Graduate School of Medicine) for additional statistical support; Mr Tim Hilts for editing the language, and Masahiro Kami, MD, PhD (Division of Social Communication System for Advanced Clinical Research, Institute of Medical Science, University of Tokyo) and Shigeaki Kato, PhD (Sendai Kousei Hospital) for providing assistance with the design and analysis of the study. None of these persons received any compensation for their contributions.
References
Supplementary materials
Supplementary Data
This web only file has been produced by the BMJ Publishing Group from an electronic file supplied by the author(s) and has not been edited for content.
Files in this Data Supplement:
- Data supplement 1 - Online figures
- Data supplement 2 - Online table
- Data supplement 3 - Online video
Footnotes
-
Contributors SK-S designed the study and wrote the manuscript, had full access to all of the data in the study and takes responsibility for the integrity of the data and the accuracy of the data analysis. AI, YA and TH designed the study and collected the data. MA designed the study, interpreted the data and reviewed and edited the manuscript. NT made critical revisions to the manuscript for intellectual content. TY took part in analysing and interpreting the data. TS contributed to proofreading of the paper. TS, HO and MI provided administrative, technical or material support. All authors approved the final manuscript as submitted.
-
Funding This work was supported by a Grant-in-Aid for Scientific Research (Scientific Research (C) H22-22591949) from the Japan Society for the Promotion of Science of Japan.
-
Competing interests All authors have completed and submitted the ICMJE Form for Disclosure of Potential Conflicts of Interest and none were reported. HO is a company employee of Honda Motor Co., Tokyo, Japan.
-
Ethics approval The study protocol was approved by the Ethical Committee of the Jichi Medical University, rinA10-62.
-
Provenance and peer review Not commissioned; externally peer reviewed.
-
Data sharing statement No additional data are available.