Article Text

Abstract
Objective To investigate the levels and factors affecting the perceived quality of HIV/AIDS treatment and care services.
Design A cross-sectional study.
Setting The study was conducted in Wolaita Zone of southern Ethiopia in one hospital and five health centres providing antiretroviral therapy (ART) and pre-ART.
Participants 481 persons infected with HIV on outpatient care, 408 (83.8%) on ART and 73 (16.2%) on pre-ART care.
Results 324 (71.4%) of the participants perceived the quality of HIV care as ‘good’, while 130 (28.6%) stated that it was ‘not good’; 219 (46.2%) and 255 (53.8%) were satisfied and not satisfied with the services, respectively. In the multivariate analysis, a unit increase in the doctors subscale of multidimensional health locus of control-form c score resulted in a 1.27 (1.04 to 1.55) increase in the odds of perceived good quality of care (p<0.05). Similarly, a unit increase in the responsiveness, perceived financial fairness, and perceived transportation convenience scores was associated with a 1.03 (1.01 to 1.05) (p<0.05), 1.08 (1.05 to 1.15) (p<0.01), and 1.07 (1.05 to 1.18) (p<0.05) increase in the odds of perceived good quality of HIV care, respectively. In terms of client satisfaction with services, a 1 km increase in the distance from health facilities, and unemployment were associated with a 4.64 (2.61 to 8.25) (p<0.001), 1.02 (1.01 to 1.04) (p<0.05) and 2.23 (1.30 to 4.54) (p<0.01) times, respectively, increase in the perceived quality of HIV treatment and care services.
Conclusions The majority of the participants reported perceptions of good quality HIV care and satisfaction with the services. Satisfaction with services; responsiveness; health locus of control; perceived financial fairness; perceived transportation convenience; employment status; and distance from the health facility were predictors of the perceived quality of HIV care. Thus, improving quality of HIV treatment services may require addressing the above factors.
- Perceived Quality of Care
- HIV/AIDS
- Responsiveness
- Satisfaction with service
- Wolaita Zone
- Ethiopia
This is an Open Access article distributed in accordance with the Creative Commons Attribution Non Commercial (CC BY-NC 4.0) license, which permits others to distribute, remix, adapt, build upon this work non-commercially, and license their derivative works on different terms, provided the original work is properly cited and the use is non-commercial. See: http://creativecommons.org/licenses/by-nc/4.0/
Statistics from Altmetric.com
Strengths and limitations of this study
The study provides novel information on the relationships between perceived quality of care and health system responsiveness and multidimensional health locus of control measures.
Selection bias was reduced by randomly selecting people on antiretroviral therapy (ART) using client enrolment and follow-up registration books although this was not possible with pre-ART clients due to a small number of pre-ART clients available for interview.
Social desirability bias could not be ruled out as self-reported measures were used.
The results may not represent all people infected with HIV.
Follow-up studies may be required to confirm the conclusions.
Introduction
Quality of care has become an important indicator of health system performance and access to healthcare.1 However, measuring quality of care is a complicated and often difficult task due to its characteristics such as intangibility (dependence on facility performance rather than product), non-uniform client perceptions, and the role of clients in producing care.2–4 In the absence of tangible evidence, clients evaluate quality of care based on the performance of the health facility and contact with care providers, compared with their expectations and previous experiences.2 This places client perceptions of quality of care at an important position, with quality of care regarded as either ‘good’ or ‘bad’ based on their level of health literacy and knowledge, and beliefs and attitudes about the healthcare services.1 On the other hand, perceived quality of care provides a link between perceived and realised access to healthcare1 and is important in order to ensure the ‘fit’ between clients and the healthcare system to ensure better health outcomes.5
Numerous studies have found that perceived quality of care is affected by client satisfaction, provider-client interactions, affordability or health insurance, and geospatial factors.3 ,6–9 However, there is a paucity of research on how health system responsiveness10 and health locus of control beliefs11 of clients affect quality of care. If the healthcare fails to meet clients’ expectations or if the care experience is not optimal, clients will not be satisfied and the perceived quality of care will deteriorate.7 ,8
Health problems that require lifelong care call for quality care that meets clients’ expectations in order to encourage adherence to treatment and achieve better health outcomes.12–14 People infected with HIV (PIWH), are challenged by the health impact of opportunistic infections and the social consequences of having HIV (stigma and discrimination). They, thus, require care that accommodates their health condition, meets their expectations and encourages them to live positively.13 ,15 While the recent universal scale up of HIV/AIDS treatment and care services (HATCS) has saved many lives, much remains to be done to ensure quality of care, satisfy clients and promote adherence and retention in care.16–18
In developing countries, HATCS has low coverage and offers poor quality of care.16 Many of those in care are lost to follow-up and challenged to keep up the care. While approximately 70% of PIWH lived in sub-Saharan Africa and almost 66% of global HIV/AIDS-related deaths occurred in the region, only 41% of PIWH had access to antiretroviral therapy (ART) in 2014. In 2014, more than 800 000 PIWH were living in Ethiopia.19 While ART coverage increased from 9 000 in 2005 to 344 344 in 2014, the quality of care required improvement as evidence showed discrepancies in following standard guidelines, challenges in meeting client expectations, and shortages of drugs for the treatment of opportunistic infections.20 ,21
Previous studies on perceived quality of care sought to understand the impact of sociodemographic characteristics, client satisfaction, waiting time, access to healthcare and the cost of care on perceived quality of care.3 ,6 ,20 ,22 ,23 However, to the knowledge of the authors, the influence and relationships between health system responsiveness, health locus of control beliefs, health characteristics of the clients, relative financial fairness of healthcare and travel expenses and perceived quality of care have received little attention. Furthermore, the role of these and other factors (client satisfaction, distance, experience with traditional medical practitioners, etc) have not been examined in relation to perceived quality of HATCS. Therefore, this study aimed to investigate the levels of and factors affecting perceived quality of HATCS in Wolaita Zone of southern Ethiopia.
Method
Study area
The study was conducted in the Wolaita Zone of southern Ethiopia inhabited by 1 866 400 people according to projections based on the 2007 Population and Housing Census of Ethiopia.24 Christians made up 98.0% of the population and 96.8% spoke Wolaita Donna (the main local language). The adult literacy rate was low at 46.1%, and 97.2% of the inhabitants were employed, primarily in agriculture. Using the regional (Southern Nations, Nationalities and Peoples Region's) 0.9% HIV prevalence rate, based on the EDHS 2011 report,25 an estimated 16 795 PIWH lived in the zone in 2014.
According to the 2013/2014 annual performance report of the administrative zone that is served by three hospitals, 63 health centres and 333 health posts staffed by 1 709 health professionals and 775 health extension workers, the health coverage was estimated to be over 95%. Comprehensive HATCS (pre-ART and ART) was provided at 14 health facilities (eight being new starters) and 3 038 people (only 18.1% of PIWH) were accessing ART care. The lack of studies on perceived quality of HATCS and low utilisation of HATCS, and the need for evidence to improve healthcare performance motivated the selection of this zone for the study.
Study design and sampling
A cross-sectional study was conducted on PIWH, and on HIV treatment and care in Wolaita Zone from November 2014 to March 2015. Of the 14 health facilities, six (one hospital and five health centres) of these which provided comprehensive HATCS for at least 12 months were selected for the study as they provided care to 2 262 (74.5%) of all those accessing ART in the zone. The sample size was determined using ‘single population proportion formula’ at α-error of 5%, 80% power of study, 95% CI and 50% perceived good quality of care (50% proportion was used to obtain the largest sample size possible as data were not available on the topic).26 The formula provided a sample size of 385 that increased to 424 with 10% non-response included and allocated to selected health facilities based on ‘probability proportional to size’.26 ART clients from the health facilities were randomly selected using ART enrolment registration books. All pre-ART clients were invited to participate in the study due to the small number observed in the health facilities’ registers. The inclusion criteria for participation were age ≥18 years, permanent resident in the zone, not seriously ill, on outpatient care and consenting to participate in the study.
Measurements and data collection
A questionnaire was adapted from the SERVQUAL scale,27 WHO health system responsiveness multicountry study instrument and healthcare climate questionnaire (HCCQ),28–30 patient health questionnaire (PHQ 9),31 WHO disability assessment schedule 2.0 (WHODAS 2.0)32 and multidimensional health locus of control—form C (MHLC-C).11 It included variables such as sociodemographic characteristics (age, gender, residence, income, education, religion and marital status), and health status measurements (CD4 cell count, HIV clinical state, PHQ 9 scale and WHODAS 2.0 scores). It also included health services performance measurement (perceived financial fairness, health system responsiveness and perceived quality of care), MHLC-C, use of traditional medicine, type of health facility and out-of-pocket expenses.
The outcome variable of the study was the overall perceived quality of HATCS rated on a five-point Likert scale from ‘very poor’ to ‘very good’ with a ‘neutral’ option (neither good nor bad) in the middle. ‘Very poor’, ‘poor’ and ‘neutral’ responses were recoded into ‘not good’ while ‘good’ and ‘very good’ were recoded into ‘good’ during data analysis.
All other variables were considered independent factors of the study. The individual characteristics and how these were measured are discussed below. Satisfaction with services was rated on a five-point Likert scale from ‘very dissatisfied’ to ‘very satisfied’ and was recoded as ‘not satisfied’ and ‘satisfied’, that is, ‘very dissatisfied’, ‘dissatisfied’ and ‘neutral’ were recoded into ‘not satisfied’ while the remainder were recoded as ‘satisfied’ during data analysis.
A score computed by summing up the responses to the questions presented in the seven domains of responsiveness was used to create the HSR score. The domains of HSR used in the study (number of questions shown in parenthesis) were client autonomy (six), prompt attention (seven), confidentiality (three), choice (three), respect (seven), communication (seven) and amenities of care (eleven).10 Similarly, a score for financial fairness was computed from eight questions, rated on a five-point Likert scale from ‘very unfair’ to ‘very fair’ based on the fairness of the cost of medical care and travel expenses relative to the quality of HIV care obtained from each service outlet of the health facility.
The questionnaire was prepared in English and translated into Amharic and Wolaita Donna (local languages), and piloted on 20 people using ART care before data collection. Nine data collectors who were fluent in both local languages, and possessing health qualifications (Nursing or Public Health) and research experience were identified and trained for 3 days. Data collection was supervised by a research assistant and the principal investigator. Selected participants were initially contacted by ART unit nurses, provided orientation, and linked with the data collectors when they gave permission to participate. The data collectors provided further orientation and obtained written consent from all participants.
Analysis
Data were analysed with STATA V.13.1 (StataCorp, Texas, USA); individual variables were examined and cleaned before advanced analysis. Univariate and bivariate analysis were conducted and data were visualised for normality, patterns and relationships. In the univariate analysis, the figures followed±symbol represented SD. The logit function of STATA was used in the bivariate and multivariate analyses to establish if associations existed between the independent and outcome variables. A p value ≤0.10 in bivariate analysis was used as a cut-off for selecting variables for the multivariate analysis to avoid overfitting in the multivariate analysis. Variables which did not show significant association with perceived quality of care and excluded from the multivariate analysis included age, residence, educational status, marital status, years lived with HIV (since diagnosis), years on HIV treatment, waiting time for service, HIV disclosure, co-infection with TB, perceived health and loss to follow-up (number of times defaulted from HATCS).
Postestimation diagnostics were conducted after the multivariate logit analysis. Eleven observations with extreme values were examined for residuals, deviance and Pregibon's leverage, and were removed. Multicollinearity was ruled out after the estimated variance inflation factor equalled 1.69 (tolerance between 27.6% and 97.7%). Model fit, goodness-of-fit, and model specification tests showed appropriate results required for model fitting such as p<0.001, p>0.05 and _hatsq p>0.05, respectively. In full factorial analysis of variables included in the final multivariate logit model, none of the interactions’ terms showed statistically significant association; only main effects were reported in the results. The statistical cut-off point was set at p<0.05 and 95% CI.
Results
Participants’ characteristics
The final sample included 481 people using HATCS after removing 11 (2.2%) observations with missing values for the outcome variable. During data collection, three people in inpatient care, four people who failed to provide consent and six people who were unreachable after 5 months of follow-up were not included in the study. The majority 408 (83.8%) were on ART care and the response rate was 96.2% of the calculated sample size for ART. Seventy-three (16.2%) participants were on pre-ART care. Two hundred and twenty (40.5%) and 261 (59.5%) of the participants accessed care at health centres and the hospital, respectively. The mean age of the participants was 34.8±8.8 years while the majority of the participants, 373 (77.6%), were aged between 25 and 44 years, 286 (59.5%) were female, and 329 (68.4%) were rural residents (table 1). The health facilities registries showed that 349 (72.6%), 105 (21.8%) and 27 (5.6%) of the participants had stage 1, 2 and 3 HIV, respectively. The latest CD4 count (in the past 6 months) showed that 261 (54.4%) had ≥500 cells/cm3 while 219 (45.6%) had <500 cells/cm3.
Sociodemographic characteristics of participants on HIV care, Wolaita Zone, Ethiopia
Health system based and spatial factors
Out-of-pocket expenses for travel and/or medical care were reported by 378 (78.6%) of the participants while 103 (21.4%) reported none. The financial fairness score for 468 participants was between 12 and 34 (of 35), with a mean score of 26.4±5.7 and 56.6% scored above the mean. Satisfaction with services was reported by 219 (46.2%) and 255 (53.8%) were not satisfied. The mean transportation convenience score (for 477 observations out of 20) was 14.9±3.2 and 48.2% scored above the mean. The overall responsiveness score (for the 7 domains of 219) was computed for 481 observations; the mean score was 152.9±17.4 and 49.7% scored above the mean.
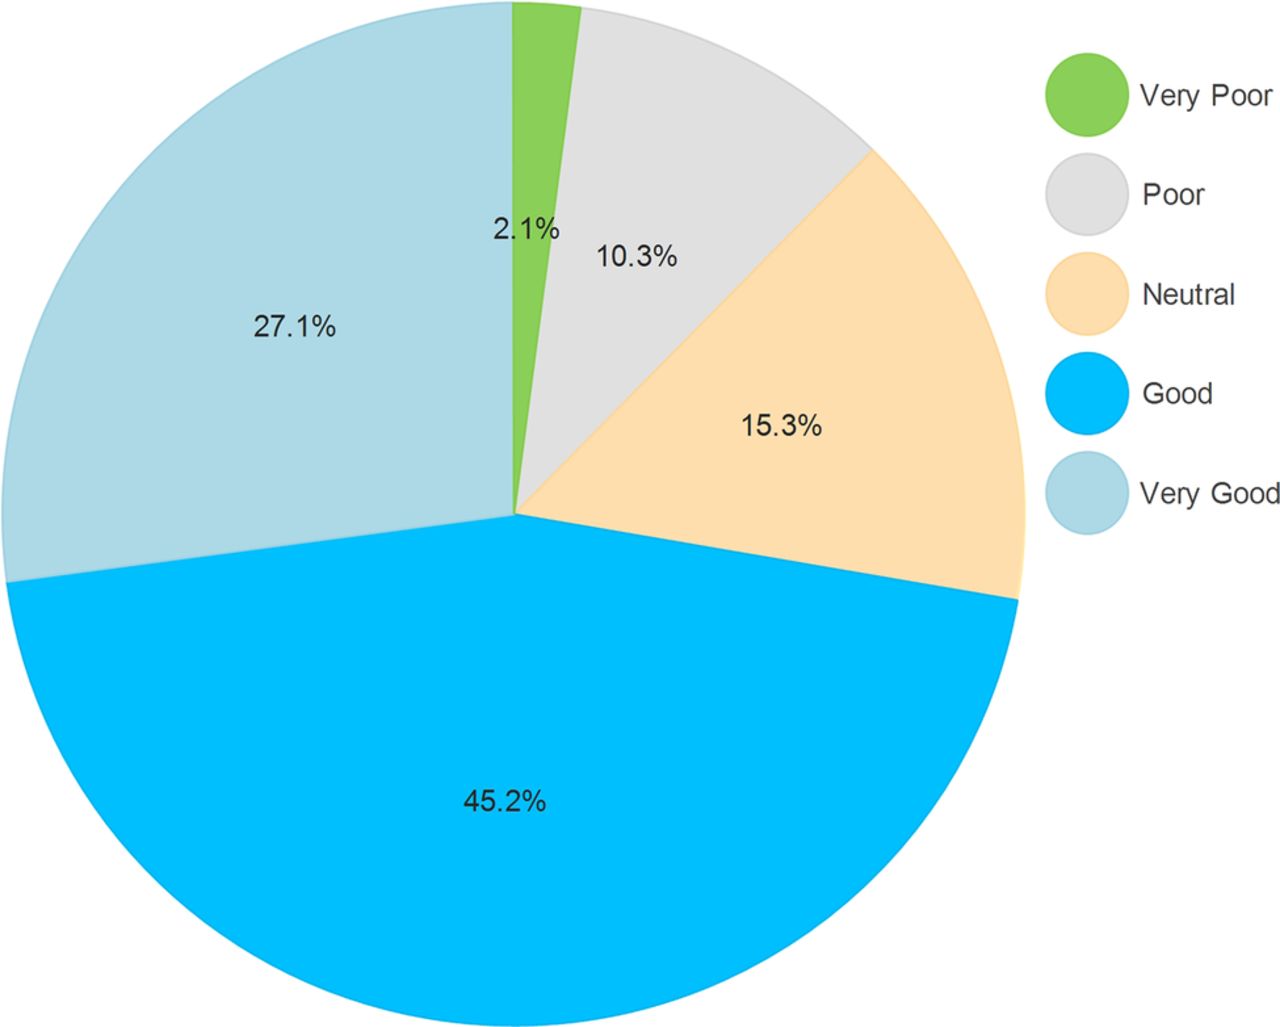
On average, the participants travelled 16.5±13.6 km to access HATCS; the minimum and the maximum distances were 1 km and 90 km, respectively. On average, they spent 2.22 h accessing HATCS (for travel, waiting and service): 392 (82.0%), ≥1 h; 280 (58.6%), ≥2 h; and 139 (29.1%), ≥3 h, respectively, with the minimum and the maximum being 0.67 h (40 min) and 12 h, respectively, as estimated by them. Figure 1 shows the level of perceived quality of HATCS as rated by the participants: very bad, 10 (2.1%); bad, 49 (10.3%); neutral (neither bad nor good), 73 (15.3%); good, 215 (45.2%); and very good, 129 (27.1%). By combining the ‘good’ and ‘very good’ ratings, approximately 324 (71.4%) participants perceived at least good quality of HATCS and 130 (28.6%) perceived ‘not good’ quality of care.
Perceived quality of HIV/AIDS treatment and care services (%).
Factors associated with perceived quality of care
In the bivariate analysis (table 2, column 3 and 4), among the sociodemographic characteristics, only employment status showed a statistically significant association with perceived quality of HATCS, that is, being unemployed was associated with good perceived quality of HATCS (p<0.01). The clients of health centres on pre-ART care and with CD4 count ≥500 cells/cm3 showed higher levels of perceived quality of HATCS than those with lower CD4 cell count (p value <0.05). In terms of the MHLC-C, the chance and other people scores did not show a statistically significant association with perceived quality of care (p>0.05), while an increase in the internal and doctors scores (shown in table 2) were associated with higher levels of perceived quality of care (p<0.001). Similarly, an increase in responsiveness, perceived transportation convenience, and financial fairness scores was positively and significantly associated with perceived good quality of HATCS. In addition, a 1 km increase in distance from health facilities was associated with a 2% increase in the odds of perceived good quality of HATCS (p<0.05). The odds of perceived good quality was 6.91 times higher for the clients satisfied with services than those not satisfied with services (p<0.001).
Factors associated with perceived quality of HATCS
In the multivariate analysis (table 2, column 5 and 6), after being adjusted for the associated factors in the bivariate analysis, employment status, the ‘doctors’ subscale of the MHLC-C, satisfaction with services, responsiveness, financial fairness and transportation convenience scores, and distance from the health facility showed a statistically significant association with perceived quality of care. The clients of HATCS who were not employed were 2.23 times more likely to report perceived good quality of care (p<0.01) when other factors were held constant.
The clients who believed ‘doctors’ control health had a 27% increased odds of perceived good quality of HATCS if other factors were held constant (p<0.05). An increase in the responsiveness, financial fairness and perceived transportation convenience scores was associated with a 3% (p<0.05), 8% (p<0.01), and a 7% (p<0.05) increase in the odds of perceived good quality of HATCS when other factors were held constant. When adjusted for other factors, the odds of perceived good quality of HATCS was 4.64 times higher for satisfied clients than those that were not satisfied with services (p<0.001). In addition, a 1 km increase in distance from the health facility was associated with a 2% increase in the odds of good perceived quality of HATCS when adjusted for other factors (p<0.05).
Discussion
To the knowledge of the authors, this was the first study that measured the relationships between perceived quality of HATCS and health system responsiveness, MHLC-C, financial fairness, satisfaction with services, health and sociodemographic characteristics. The principal findings of the study are discussed below.
The study showed that the majority of PIWH had ‘good’ perceived quality of care that did not vary significantly across the sociodemographic characteristics except for employment status. Unemployed persons perceived a higher quality of HATCS than their employed counterparts although the reason was not clear. Research may be required to investigate if this was due to a lower threshold of ‘zone of tolerance’ for unemployed persons, that is, low expectations are easier to satisfy and result in greater perceived quality of care than high expectations.33 ,34 Health status indicators, such as type of care and HIV clinical stage, were not found to be significant predictors of perceived quality of care. The differences observed could be due to confounding or sampling errors. However, it would be important to investigate the impact of these factors on satisfaction with services which was found to be a significant predictor of perceived quality of care.
The ‘doctors’ subscale of the MHLC-C appeared to be an important factor in perceptions of quality of care. The subscale refers to the belief that regularly visiting or consulting doctors during times when one is not suffering health problems and/or during times of ill-health, and adhering to prescribed treatment is important.11 ,35 This finding implies that healthcare facilities and planners may be required to put measures in place to enhance care providers’ expertise and communication skills to improve client experiences of healthcare. However, increases in the ‘internal’, ‘chance’ and ‘other people’ subscales of the MHLC-C were not significant predictors of perceived quality of care, that is, a belief that one controls one's own health or that one's health is controlled by external factors, such as fate and other people,11 were not important factors when the clients judged quality of care. As this was probably the first study on the relationships between health locus of control and perceived quality of care, further studies are required to confirm the findings.
This study found a strong association between satisfaction with services and the perceived quality of HATCS, confirming the inseparable deterministic relationships reported by other studies in different settings.36–39 Although the direction of the relationships between the two factors can be debated (the ‘egg and chicken’ dilemma), the study showed that client satisfaction has a positive influence on perceived quality of HATCS. Both satisfaction with and perceived quality of care depend on preconceived ideas and expectations about services and past experiences with healthcare facilities, in addition to achieved service performance.7 ,40 ,41 In recognition of this fact, healthcare facilities should initiate or implement socially acceptable practices and optimise client experiences through the facility by becoming responsive to their demands (a welcoming environment, good communication and care with respect).10 ,41 This is especially true for patients on HIV treatment due to the nature of the lifelong care required and the need to enhance adherence to care therapy and treatment outcomes, and moderate future intentions to visit the health facility.10 ,39 ,42
The findings revealed that the hospital and health centres did not vary significantly in terms of perceived quality of HATCS, and that both high and/or low performance in quality of care were explained by other factors investigated in this study. The study also showed that improvement in the health system's responsiveness (increase in the scores) affected perceived quality of HATCS. When healthcare facilities improved, performance in the responsiveness domains (autonomy, prompt attention, respect, confidentiality, amenities of care, choice and communication)10 was perceived as good quality of care. This implies that the healthcare climate and client experiences with the health facility are important aspects of HIV care and treatment that need to be followed up and continuously improved to ensure good quality of care.7 ,8 ,34 More research may be required to understand the role of health system responsiveness on perceived quality of care and satisfaction with HATCS.
The study confirmed that clients’ evaluation of financial fairness not actual out-of-pocket expenses predicted perceived quality of HATCS, with more weight apparently placed on the worthiness of the care than discomfort due to travel and medical expenses. Consistent with this finding, a study in Burkina Faso reported less or no effect of fee waiver on the perceived quality of care.22 However, it is important to note that with increasing out-of-pocket expenses, healthcare will become unaffordable and that access to HATCS (enrolment on care) could be inhibited. This will affect clients’ perceptions and expectations.8 ,43 ,44 For instance, a study in Ethiopia found that a shortage of prophylactic antibiotics impacted service quality21 despite the government's efforts to ensure universal free access to ART and treatment of opportunistic infections. In addition to physical access to care, health systems require essential medical logistics that are accessible at all times and commensurate with the financial resources available to their clients.
The findings of the study showed that convenience and access to transportation, and distance from the health facilities were important factors in the evaluation of quality of HATCS, thus demonstrating the role of factors for which the health system is not directly responsible. Increased difficulties relating to transportation can derail perceived quality of HATCS. On the other hand, ease of transportation results in improved perceptions of quality of HATCS, indicating its optimisation effect on the health system-based factors. Ensuring access to transport might lie outside the realm of responsibility of the health sector and might require multisectoral collaboration and a coordinated response.
The study also found the clients living some distance from the health facility perceived a higher level of quality of HATCS than those from nearby areas. While the questions of how and why distance affects perceived quality of care and the implications for policymakers will require further research, it can be speculated that these clients from distant locations might be disappointed with poor quality of care offered by the health facilities closer to their homes. Second, attending HATCS in nearby health facilities might expose their HIV status and increase stigma and discrimination, forcing them to seek care at more distant facilities.
Unanswered questions
Further studies are required to understand the relationships that appear to exist between perceived quality of care and employment status, and distance from health facilities. Furthermore, research is needed to generalise the findings of this study to national level and for wider application. The relationships among responsiveness, satisfaction with services and quality of care are under-researched and more studies are required to expand the body of knowledge, enhance the learning and its impact on policy choices.
Strengths and limitations of the study
The study provides novel information on the relationships between perceived quality of care and health system responsiveness and multidimensional health locus of control measures. Selection bias was reduced by randomly selecting people on ART using client enrolment and follow-up registration books. However, this was not possible with clients on pre-ART due to the small number of clients available; therefore, generalisation of the findings should be made cautiously. Social desirability bias could not be ruled out as self-reported measures were used. The results may not represent all PIWH and the results may be generalisable to people using HATCS in Wolaita Zone; however, these need to be generalised more cautiously for other similar contexts. Follow-up studies may be required to confirm the conclusions
Conclusions
The study found that a substantial proportion of people using HATCS perceived good quality of care and identified its predictors in three categories - client-based and health system-based factors, and factors external to the health system. Client-based factors that affected quality of care included employment status and belief in consulting and following prescriptions by doctors (of MHLC-C). Satisfaction with services, health system responsiveness, and perceived financial fairness were the health system-based factors that influenced perceived quality of care. Finally, transportation accessibility and convenience and distance from health facilities were factors external to the health system that affected perceived quality of care.
Healthcare facilities and managers need to understand the potential impact of these factors when planning and implementing initiatives to improve quality of HATCS. Concerted and coordinated efforts from multiple sectors may be required to ensure transportation accessibility. Studies may be required to answer the questions of how and why employment status and distance from health facilities affected perceived quality of HATCS. Further studies on the relationships between health system responsiveness, satisfaction with services, and financial fairness of HATCS will enhance understanding of the factors associated with quality of HATCS.
Acknowledgments
The authors acknowledge the study participants and data collectors for their contribution. The authors also thank Wolaita Zonal Health Department and Chief Administrator's Office, district health offices and health facilities for supporting and collaborating during data collection, and for providing valuable information.
References
Footnotes
Contributors BY conceived the study. BY and BPN designed the study. BY conducted data analysis, and BPN supervised and confirmed data analysis. BY wrote the manuscript. BPN reviewed the draft manuscript for intellectual content. BY and BPN read and approved the final manuscript.
Funding BY covered fieldwork expenses. BY's salary was paid by the PhD Scholarship Program of the Health Economics and HIV/AIDS Research Division (HEARD), University of KwaZulu-Natal, Durban, South Africa.
Competing interests None declared.
Ethics approval Ethical approval was obtained from the Wolaita Soddo University Institutional Review Board (Ethiopia) and the Biomedical Research Ethics Committee of the University of KwaZulu-Natal (South Africa). Permission letters were obtained from Zone Health Department, Zone Chief Administrator's Office, Woreda health offices and all health facilities.
Provenance and peer review Not commissioned; externally peer reviewed.
Data sharing statement No additional data are available.