Article Text

Abstract
Objectives To perform a systematic review of reported HRs of all cause dementia, Alzheimer's disease (AD) and vascular dementia (VaD) for late-life depression and depressive symptomatology on specific screening instruments at specific thresholds.
Design Meta-analysis with meta-regression.
Setting and participants PubMed, PsycInfo, and Cochrane databases were searched through 28 February 2014. Articles reporting HRs for incident all-cause dementia, AD and VaD based on published clinical criteria using validated measures of clinical depression or symptomatology from prospective studies of general population of adults were selected by consensus among multiple reviewers. Studies that did not use clinical dementia diagnoses or validated instruments for the assessment of depression were excluded. Data were extracted by two reviewers and reviewed by two other independent reviewers. The most specific analyses possible using continuous symptomatology ratings and categorical measures of clinical depression focusing on single instruments with defined reported cut-offs were conducted.
Primary outcome measures HRs for all-cause dementia, AD, and VaD were computed where possible for continuous depression scores, or for major depression assessed with single or comparable validated instruments.
Results Searches yielded 121 301 articles, of which 36 (0.03%) were eligible. Included studies provided a combined sample size of 66 532 individuals including 6593 cases of dementia, 2797 cases of AD and 585 cases of VaD. The increased risk associated with depression did not significantly differ by type of dementia and ranged from 83% to 104% for diagnostic thresholds consistent with major depression. Risk associated with continuous depression symptomatology measures were consistent with those for clinical thresholds.
Conclusions Late-life depression is consistently and similarly associated with a twofold increased risk of dementia. The precise risk estimates produced in this study for specific instruments at specified thresholds will assist evidence-based medicine and inform policy on this important population health issue.
- CES-D
- Late-life depression
- Alzheimer's disease
- Vascular dementia
- Meta-regression
- DSM-IV
This is an Open Access article distributed in accordance with the Creative Commons Attribution Non Commercial (CC BY-NC 4.0) license, which permits others to distribute, remix, adapt, build upon this work non-commercially, and license their derivative works on different terms, provided the original work is properly cited and the use is non-commercial. See: http://creativecommons.org/licenses/by-nc/4.0/
Statistics from Altmetric.com
Strengths and limitations of this study
This study used a robust methodology that included a very broad search of the literature using clearly defined search terms and stringent inclusion and exclusion criteria.
Particular care was taken to assess study characteristics so only studies that used compatible exposure and outcome measures would be combined.
Detailed subanalyses were conducted to provide estimates for specific tools at specific thresholds.
Study quality, publication bias and influence of relevant factors were formally investigated by meta-regression.
The study was limited by the relatively small number of articles with relevant data published in this domain and, particularly so for vascular dementia, and by the fact that the Centre for Epidemiological Studies Depression scale (CES-D) was the only instrument that could be analysed separately.
Introduction
In a clinical environment where no cure for Alzheimer's disease (AD) and other dementias is available or likely to be developed in the near future, and in the context of a growing ageing population it is increasingly important to consider the potential of preventative approaches to decrease the impact of these debilitating conditions.1 ,2 This requires the identification of risk factors and estimation of the magnitude of their effect, but critically it also requires the availability of reliable measures of risk exposure based on specific, validated instruments so individuals at higher risk can be identified and interventions and/or treatment can be calibrated at the individual level. Moreover, evidence-based medicine requires that clinical advice and decision-making be informed by precise and reliable evidence based on validated instruments at known thresholds.3 Unfortunately, this evidence is not available.
A link between late-life depression and dementia has already been established and population-level risk estimates are available. However, results from studies investigating this question have important limitations.4–6 Of three available meta-analyses on this topic, none has reported on risk measures related to specific instruments. Current evidence has been produced by combining findings based on different instruments and using both continuous measures of depressive symptomatology and categorical classification of major or minor depression with all three systematic reviews including findings based on self-report.4–6 In addition, some of the available meta-analyses combined findings from studies using outcome measures of dementia based on accepted diagnostic criteria (eg, Diagnostic and Statistical Manual (DSM), National Institute of Neurological and Communicative Disorders and Stroke and the Alzheimer's Disease and Related Disorders Association (NINCDS-ADRDA)) with those of studies using criteria of unclear validity or relating to Mild Cognitive Impairment (MCI) and not dementia.4 In at least one instance findings unrelated to dementia (cognitive decline in non-demented participants) were included in the analyses.4 These methodological limitations have likely led to less reliable estimates of risk which are not clearly attributable to single screening instruments with known clinically relevant cut-offs.
The aim of this study was therefore to systematically review the literature on dementia risk for late-life depression and conduct meta-analyses pooling separately compatible findings from population studies using either continuous measures or specified cut-offs on validated instruments (eg, Centre for Epidemiological Studies Depression scale (CES-D)) to assess depression status and only in those studies which relied on widely accepted clinical criteria for dementia (eg, DSM-IV). Other aims included estimating and reporting relative risks (RRs) for dementia subtypes including AD and vascular dementia.
Methods
This systematic review and meta-analysis follow the Meta-analysis of Observational Studies in Epidemiology (MOOSE) and the Preferred Reporting Items for Systematic Reviews and Meta-Analyses (PRISMA) guidelines.7 ,8
Search strategy
We conducted a systematic literature search of PubMed, PsycInfo and Cochrane databases for studies describing the association between depression (defined by self-reported scales or clinical diagnoses) and dementia incidence published between 1996 through 28 February 2014. Details of search terms are presented in online supplementary table ST1. In summary, we combined two sets of search terms which identified articles relating to (1) depression, anxiety (because of its comorbidity with depression), or medication for these conditions AND (2) measures of cognition or diagnosis of any type of dementia. Searches were restricted to human studies and articles published in English. In addition, we searched the reference lists of identified relevant publications and reviews. Searches were conducted by experienced and qualified researchers following our published methodology.9–11 All articles were reviewed for inclusion by two reviewers (JY and SK). An independent review of all articles was conducted by a second set of reviewers (KJA and NC). Any disagreement was resolved by consensus among all reviewers.
Selection criteria and article screening
The study inclusion criteria ensured that all articles included in the review met the Oxford Centre for Evidence-Based Medicine Level of Evidence 1B (http://www.cebm.net). Studies included following article screening were required to be prospective, longitudinal, population-based studies with a minimum follow-up period of 1 year. Studies were required to measure depression at baseline or during a follow-up period that preceded the final follow-up examination. Baseline depression was required to be measured using a standardised assessment tool with articles relying on self-report of depression diagnosis excluded from the analysis. The outcome measure had to include dementia. Studies were required to have screened for dementia at baseline unless the sample mean age at baseline plus two SDs was less than 60 years old. Cross-sectional, experimental and clinical studies and studies with a sample size of less than 100 and those not reporting on original published peer-reviewed studies were excluded to ensure only research of high quality would be considered. We identified articles eligible for further review by performing an initial screen of titles and abstracts, followed by a full-text review.
Data extraction
Data relating to depression and dementia diagnosis were extracted by two reviewers (JY and SK) from included articles for potential meta-analysis. Information extracted included: study design (sample source, number of participants and observation period), sample characteristics (country, percentage female, average age, age range, years of education, dropout rate), measurement of depression (measurement scale used and/or clinical criteria), covariates included in statistical models, dementia assessment and clinical criteria, and unadjusted and/or adjusted estimates of associations. Where results for more than one follow-up period were reported for the same study, the estimate from the longest follow-up was selected. Adjusted results were used where available. Data extraction was checked by a third reviewer (NC). Where insufficient data were available in articles meeting the inclusion criteria authors were contacted directly.
Statistical analysis
We used HRs as common measure of association across studies and considered RRs as equivalent since it has been shown that for rare events they can be considered equivalent.12 We assessed heterogeneity across studies with the Q statistic (with p<0.10 being suggestive of significant heterogeneity) and the I2 statistic (values of 25%, 50% and 75% were indicative of low, medium and high heterogeneity). The HRs were pooled using the DerSimonian-Laird random-effects model13 as the fixed-effects model is regarded as inappropriate in this type of meta-analysis where study design and methodology vary substantially.14 Sensitivity analyses were conducted to identify studies that excessively contributed to heterogeneity with the leave-one-out method. The possible presence of publication bias was assessed through visual inspection of funnel plots, with the ‘trim and fill’ method,15 and with the ‘fail-safe’ method.16 In addition, sensitivity analyses were conducted to evaluate the influence of selected study and participants characteristics on results. Analyses were conducted in R V.3.117 using the metafor package V.1.9.318 and Review Manager V.5.1.19
Data synthesis
Data were pooled separately across studies for continuous and categorical measures of depression predicting all-cause dementia, AD or vascular dementia (VaD). Least specific analyses including studies using more diverse measures of depression were conducted first, followed by more specific analyses which focused on single instruments and/or on single cut-offs. Studies were considered compatible for combined analyses if (1) they provided risk estimates for the same type of measure (categorical or continuous) (2) they reported on instruments and cut-offs that would be widely considered as similar and comparable (eg, the long and the short form of the CES-D which have been validated against each other or instruments at specific thresholds validated against clinical criteria) (3) they estimated the risk for the same type of dementia (all-cause, AD or VAD) (4) they did not report on the same cohort. For continuous depression measures, data from all compatible studies were pooled in a first step followed by analyses including only instruments used to assess depressive symptomatology with a similar range (eg, CES-D range 0–60 and Hamilton rating scale for depression (HAM-D) 0–54). For categorical depression measures, data from all compatible studies using validated cut-offs (eg, CES-D≥20) or clinical diagnoses based on accepted criteria (eg, DSM-IV) were pooled in a first step. In studies which used the CES-D and reported on multiple cut-offs, estimates for a cut-off of 20/21 were used as this threshold has been reported as optimum for screening for major depression20 (Note, however, that Fuhrer et al21 have used a threshold of 17 for men and 23 for women because French validation studies have found these cut-offs most sensitive for clinical depression in their population and therefore we have considered them compatible but also conducted sensitivity analyses without this study). This was followed by analyses based on single instruments at a specific cut-off. Studies which exclusively reported an outcome of AD and/or VaD were not pooled in all-cause dementia analyses. Studies using the short form of CES-D with a cut-off of 10 were pooled with those using the long form with a cut-off of 16 as the psychometric properties of these two forms have been found to be comparable.22 Studies were evaluated for methodological quality using the Newcastle-Ottawa scale.23 Influence of study characteristics on pooled estimates, including study quality, proportion of females, length of follow-up, and sample mean age, was investigated by meta-regression.
Results
Literature search
The search strategy identified 121 301 unique citations. After initial screening based on titles and abstracts 700 publications remained for further assessment. After close inspection of these articles and application of inclusion and exclusion criteria a further 565 articles were excluded (figure 1). Of those, 99 publications did not report relevant data or necessary data could not be extracted or obtained from authors, leaving 36 publications reporting on 29 unique cohorts for meta-analysis. Among included articles two were obtained from reference lists.
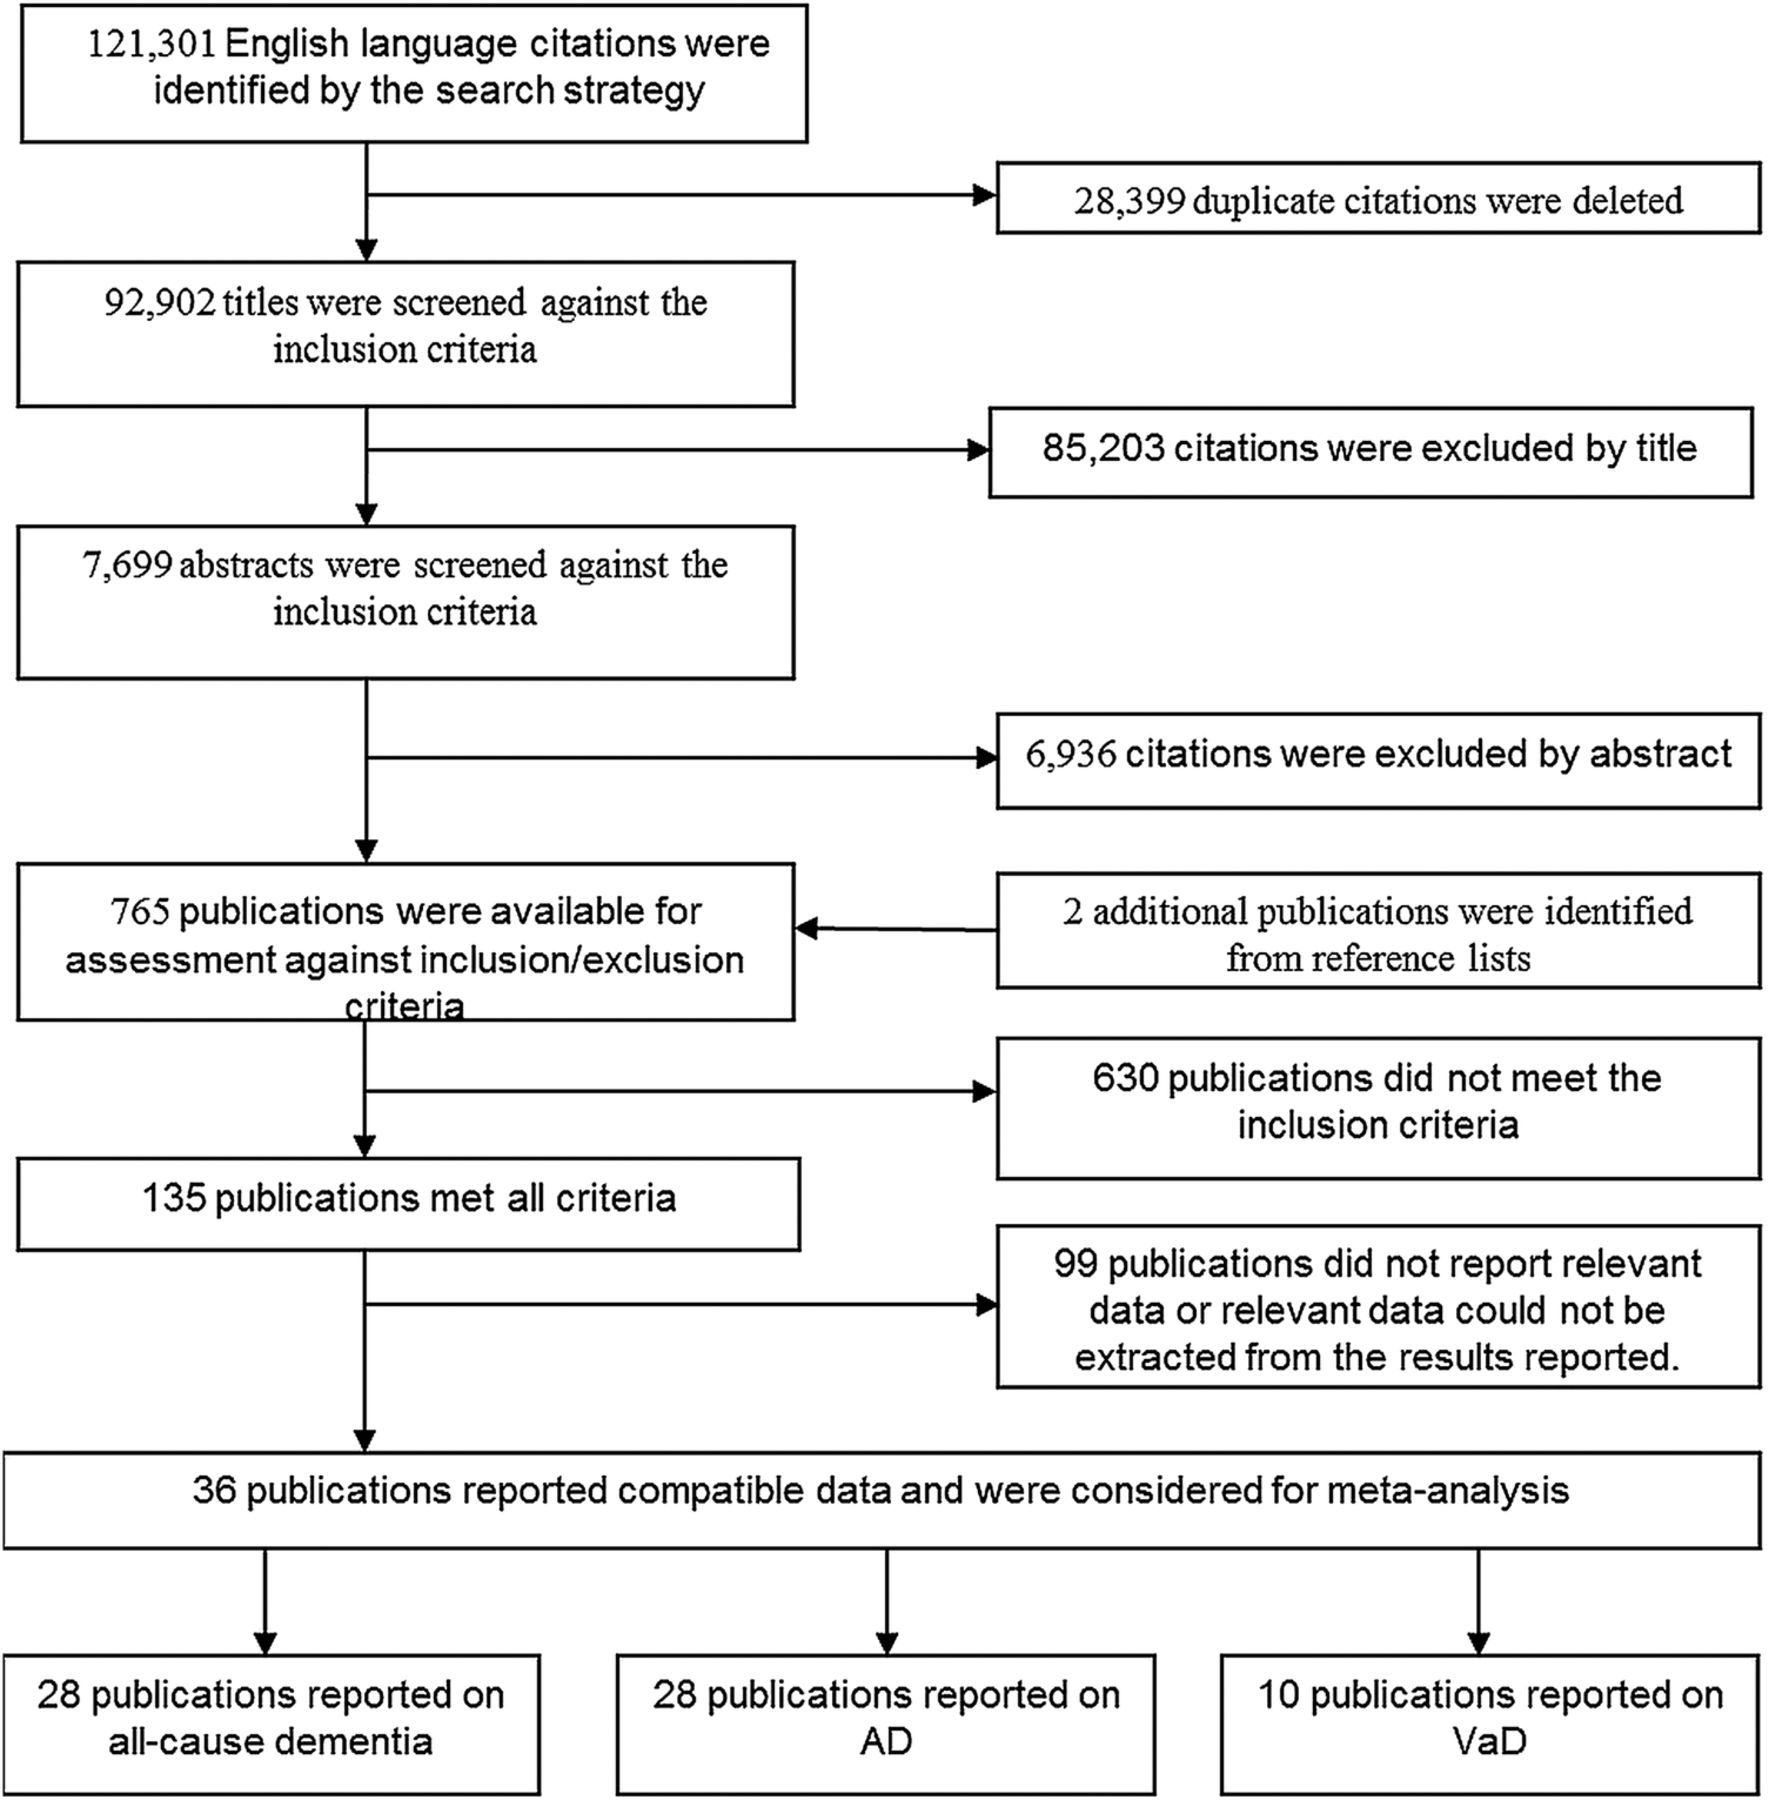
Flowchart of the search and study selection process. AD, Alzheimer's disease; VaD, vascular dementia.
Of the 36 articles included 28 studies reported results on all-cause dementia, 28 studies on AD, 10 studies on VaD and surveyed a total of 66 532 participant including 6593 participants with all-cause dementia, 2797 with AD, and 585 with VaD. Regions of origin of participants included Europe (n=19), North America (n=13 studies), South Korea (n=2) and China (n=1). We considered the results as adequately adjusted if they were adjusted for at least age and education, but where available, we included the more fully adjusted models in analyses. Most studies adjusted for age, sex and education (n=21).
Multiple reports
Findings based on the same cohort were reported multiple times for six studies covered by 14 separate articles. When multiple reports were available for the same cohort, a risk estimate from only one publication was used in any single analysis. The most appropriate estimates were selected based on recency, sample size and methodology. When different articles from the same cohort reported on different depression measures (eg, continuous vs categorical, different cut-off, different diagnostic tools) or on different diagnostic outcomes (dementia, AD and VaD) estimates from the same cohort were sometimes used in different analyses (but never in combination).
Study characteristics
Characteristics of the 36 selected studies are presented in table 1. The assessment of depression was most frequently based on: CES-D (n=17), Geriatric Mental State (GMS) (n=4), Geriatric Depression Scale (GDS) (n=3), HAM-D (n=2), Comprehensive Psychopathological Rating Scale (CPRS) (n=1), Neo (n=1), Symptom Checklist (SCL)-90 (n=1), clinical diagnosis (DSM-III/IV, n=5; Composite International Diagnostic Interview (CIDI), n=1), or international classification of diseases (ICD)-9 (n=1). Dementia diagnosis was most frequently established based on DSM-III/IV criteria (n=22), GSM-AGECAT (n=2), ICD9/10 (n=2) or Cambridge Cognition Examination (CAMGOG) (n=1). AD diagnosis was most frequently established based on National Institute of Neurological and Communicative Disorders and Stroke and the Alzheimer's Disease and Related Disorders Association (NINCDS-ADRDA) (n=22) or DSM-III/IV (n=3) criteria. VaD diagnosis was based on National Institute of Neurological Disorders and Stroke and Association Internationale pour la Recherche et l'Enseignement en Neurosciences (NINDS-AIREN) (n=8) or DSM-III/IV (n=2) criteria.
Characteristics of included studies (n=36).
Study quality rating
Most studies were of excellent quality as attested by the scores ranging from 7 to 9 on the Newcastle-Ottawa scale (maximum 9; see online supplementary table ST2). Five of 36 studies were rated as not representative of the population mostly because they only reported on one gender. Eleven studies did not control for at least age and sex together, while only four studies did not control for other factors. Five studies did not fully account for all participants.
Summary risk estimates
Summary HRs for different measures of depression (continuous measures of symptomatology or categorical clinical thresholds), and different dementia outcome categories (all-cause dementia, AD and VaD) are presented in table 2. Sufficient data were only available for the CES-D using a cut-off of either 20 or 16 to conduct subanalyses on individual scales at specified thresholds. More detailed statistical outputs for all analyses are presented in online appendix SA1.
Summary of risk estimates (HRs) for different measures of depression (continuous measures of symptomatology or categorical clinical thresholds), and different dementia outcome categories (all-cause dementia, Alzheimer's disease, vascular dementia)
Depression and all-cause dementia risk
Risk estimates were first pooled across 10 studies24–32 which assessed depression symptomatology as a continuous measure and a diagnosis of all-cause dementia as outcome. Instruments used to assess depression included the CES-D, HAM, GSM, and the SCL-90. In a second analysis estimates were only pooled across studies using instruments of similar range. This included the CES-D and HAM. The two sets of analyses led essentially to identical results indicating that each one point increase on the CES-D/HAM in a pooled sample with a mean age of 73.2 years (SD∼6) was associated with a 5% increased risk of dementia over a mean follow-up of 5.2 years (n=8644) (see table 2 and figure 2). In addition, because the study by Devanand et al was the only study reporting results as RR, we conducted additional analyses excluding this study to determine whether this difference substantially influenced outcomes. These analyses showed that results remained identical when all continuous measures were considered (HR 1.05, 95% CI 1.02 to 1.08) and marginally different for CES-D/HAM measures (HR 1.04, 95% CI 1.02 to 1.07).

Forest plots of analyses investigating the risk of dementia (top row) and Alzheimer's disease (bottom row) associated with continuous (left column) and categorical (right column) depression measures including all comparable instruments.
With respect to categorical thresholds HRs were pooled across 11 studies21 ,25 ,27 ,28 ,30 ,33–36 and, as expected, risk estimates were higher for more stringent clinical criteria. A clinical diagnosis or a score greater than 20/21 on the CES-D (or equivalent) in individuals (n=15 553) in a pooled sample with a mean age of 72.0 years (SD∼6) was associated with an 83% increased risk of dementia over a mean follow-up of 8.2 years. Sensitivity analyses without the study by Fuhrer et al which used the equivalent validated French thresholds yielded a HR of 2.18 (95% CI 1.28 to 3.71). When a cut-off of 1618 ,27 ,31 ,33 ,34 ,37–40 on the CES-D was used a 69% increased risk was observed.
Depression and AD risk
Risk estimates were first pooled across 10 studies24 ,25 ,27 ,29 ,31 ,41–44 which assessed depression symptomatology as a continuous measure and a diagnosis of AD as outcome. Instruments used to assess depression included the CES-D, HAM, GDS, SCL-90 and the NEO. In a second analysis estimates were only pooled across studies using instruments of similar range. This included the CES-D and HAM.24–27 ,29–31 The two sets of analyses led essentially to identical results indicating that each one point increase in a pooled sample with a mean age of 72.7 years (SD∼6) on the CES-D/HAM was associated with a 6% increased risk of AD over a mean follow-up of 5.9 years (n=4401) (see table 2 and figure 2).
As in all-cause dementia analyses, pooled risk estimates for AD based on categorical depression thresholds across 10 studies21 ,25 ,27 ,34 ,36 ,45–47 were higher for more stringent clinical criteria. A clinical diagnosis or a score greater than 20/21 on the CES-D (or equivalent) in individuals (n=7831) in a pooled sample with a mean age of 75.8 years (SD∼5) was associated with a 97% increased risk of AD over a mean follow-up of 6.3 years. Sensitivity analyses without the study by Fuhrer et al which used the equivalent validated French thresholds yielded a HR of 2.43 (95% CI 1.42 to 4.16). When a cut-off of 1627 ,31 ,34 ,38 ,39 ,48 on the CES-D was used a 58% increased risk was observed.
Depression and VaD risk
Very few studies provided risk estimates for VaD. Consequently, although pooled estimates were computed to provide approximate metrics to compare with risk estimates for other dementia types, they should be considered with caution. Only two studies29 ,49 (n=3187; 37 VaD cases) reported on continuous measures of depressive symptomatology and produced a pooled risk estimate of 1.06 (95%CI 0.92 to 1.21). Three studies18 ,34 ,39 (n=13 331, 113+VaD cases) reported on categorical depression thresholds that were most consistent with a CES-D threshold of 16 and produced a pooled risk estimate of 2.20 (95% CI 0.87 to 5.59).
Sensitivity analyses
For most analyses heterogeneity was low to moderate but was substantial for CES-D subanalyses using a threshold of 20. Influence of single studies was investigated with leave-one-out analyses (see online supplementary appendix SA1). In most part, they revealed no particularly influential study which could be considered outliers with some notable exceptions. The female cohort of Fuhrer et al21 was found to be very influential and excluding it from the analyses for any major depression diagnosis with dementia as outcome (HR 2.29, 95% CI 1.81 to 2.88), for CES-D >20 with dementia as outcome (HR 2.56, 95% CI 1.71 to 3.84), and for CES-D >20 with AD as outcome (HR 2.79, 95% CI 1.79 to 4.33) produced notable but not significantly different estimates.
Publication bias
Publication bias was formally investigated by two methods. The fail-safe methods computes the number of studies with null findings that would be needed to reduce the significance level to α=0.05. For most analyses a large number (n=43–142) of null studies would need to be added to achieve an α level of 0.05 which suggest overall robustness to bias. Exceptions were analyses using a threshold on the CES-D of ≥20 which had a fail-safe estimate of 16 studies indicating a possible publication bias in these subanalyses. The second method used to assess publication bias was the trim-and-fill method which estimates the number of missing studies based on funnel plot asymmetry. The number of missing studies ranged from 0 to 4 representing overall about 30% (range 20–50%) of the studies included in the analyses. These results suggest that some publication bias is likely to be present and that actual effect sizes could be smaller than those reported.
Meta-regression
Influence of study quality, proportion of females, length of follow-up, and sample mean age, on pooled estimates was investigated by meta-regression on the larger analysis groups which estimated risk of all-cause dementia and AD using all compatible continuous or categorical depression measures. Some of the factors considered significantly predicted the unexplained variance in risk estimates but only in analyses including continuous measures of depression. First, when estimating the risk of all-cause dementia while considering all continuous measures of depression symptomatology, drop-out rate, female proportion, mean age and study quality accounted for 46% of unexplained variance. Studies with higher drop-out rates (β −0.2263, SE 0.0921, p=0.0140), a higher proportion of females (β −0.0077, SE 0.0021, p=0.0003), lower mean age (β 0.0115, SE 0.0039, p=0.0031), and of higher quality (β −0.0873, SE 0.0370, p=0.0182) reported on average slightly lower risk estimates. Second, when estimating the risk of AD while considering all continuous measures of depression symptomatology, female proportion and age accounted for 5% of unexplained variance. Studies with a higher proportion of females (β −0.0122, SE 0.0052, p=0.0020) and of lower mean age (β 0.0283, SE 0.0101, p=0.0052) reported on average slightly lower risk estimates.
Incompatible studies
Apart from studies which could not be pooled in specific subanalyses because they did not report on a relevant threshold on a specific instrument or on a specific outcome, and those which reported on the same outcomes in a single cohort,50–55 only a single study56 was not included in any of the analyses. This is because it was based on medical records and used ICD-9 classification to assess depression and dementia status with the possibility that particularly the latter might not reach the level of accuracy provided by methodologies used in other studies which relied on more reliable clinical criteria. However, because this study was larger than any other (n=13 535) it is important to note that the estimates it produced (dementia: HR1.77, 95% CI 1.52 to 2.06; AD: HR 2.06, 95% CI 1.67 to 2.55; VaD: HR 3.51, 95% CI 2.44 to 5.05) were remarkably consistent with the pooled estimates reported in table 1, although somewhat higher than estimates reported above for VaD but not significantly so.
Discussion
The major contribution of this study was to produce precise dementia risk estimates associated with the presence of clinically significant late-life depression or depression symptomatology and which can be related to specific thresholds on validated instruments. These findings are important because evidence-based clinical practice mandates that clinical advice and decision-making be based on objective measures of risk. Until now, this evidence was not available for specific instruments at specified thresholds.
Great care was taken to avoid the combination of incompatible findings. As such we were not only able to confirm that depression is associated with increased risk of dementia but also to provide summary estimates showing that this association is very similar for all-cause dementia and AD. Importantly detailed analyses at specific cut-offs further confirmed this pattern of association. Of particular relevance to clinicians and researchers, separate analyses of studies using a cut-off most consistent with major depression and previously validated against clinical criteria (CED-D>20)57 demonstrated somewhat higher risk estimates (dementia HR 1.83 (trend) and AD HR 1.97) than those using a more lenient cut-off (CES-D>16; dementia HR 1.58 (trend) and AD HR 1.69). Together these findings suggest that clinical depression is likely associated with an approximately 80–100% increased risk of dementia and AD. However, milder presentation is still associated with an approximately 60–70% increased risk of dementia and AD. In this context it is noteworthy that Coopers et al58 found, when considering risk of transition from MCI to dementia, that depression was associated with an increased risk when focusing on population studies but not when investigating clinical studies. The reason for these findings remains to be elucidated. However, it is possible that depression is most predictive of dementia risk in the early, preclinical stages of the disease and that in individuals involved in clinical studies who are likely to be in more advanced stages of the disease, depression is a less sensitive predictor.
Analyses of continuous measures with a similar range (CES-D, HAM and SCL-90) or from the CES-D alone also suggest depression may be associated with dementia in a dose-dependent manner and possibly starting in the subclinical range. Indeed, every one point increase on these measures was associated with a 5–6% increased risk of AD or dementia. The available data do not allow us to investigate whether the demonstrated association is driven by a stronger dose-dependent effect within the clinical population or whether a smaller effect is at play across the whole subclinical and clinical ranges. This question should be addressed in future research as it will lead to more reliable risk estimates and will help clarify the extent to which those with subsyndromal symptomatology are at risk.
Too few studies were available to produce reliable risk estimates for VaD. However, despite this major limitation, summary HRs for VaD were very consistent with those produced for all-cause dementia and AD, and did not significantly differ (as demonstrated by the predominantly overlapping CIs). Together these findings suggest that the risk associated with depression does not differ for the main types of dementia considered here.
Interestingly, meta-regression analyses showed that higher drop-out rate, larger female proportion, younger mean age and higher study quality ratings were associated with lower dementia and AD risk estimates but only when continuous depression measures were considered. These findings further emphasise the need for very robust methodology in epidemiological research based on designs that minimise drop-out, do not cover excessively large age ranges (or stratify by age groups), include similar proportions of males and females (or stratify by sex), and that adhere and report high scientific quality practices. It is also particularly notable that according to our meta-regression analysis late-life depression in women appeared to be associated with a slightly lower risk.
An incompletely resolved question is whether depression is a risk factor for dementia or whether it is an early biomarker which indicates the development of depressive symptomatology in the prodromal stages of the disease. Indeed, while all studies included in the present investigation excluded individuals presenting with dementia at baseline, at least in those studies with short follow-ups it could be argued that participants might have already have developed mild cognitive impairment and/or substantial cerebral pathology. While this may be in part the case it is also unlikely that depression is only a symptom of dementia and not a risk for it. This is because even studies with long follow-ups (eg, more than 20 years in Dotson et al37) have found a significant risk of dementia associated with depression but perhaps even more convincing is the profuse evidence demonstrating links between the development of depression and increased neuroinflammation, oxidative stress, white matter lesions and cerebral atrophy which are already detectable in younger cohorts (see ref. 59 for a review and discussion).
Major strengths of this study were that it used a robust methodology which included a very broad search of the literature using clearly defined search terms and stringent inclusion and exclusion criteria. Particular care was taken to assess study characteristics so only studies which used compatible exposure and outcome measures would be combined. Detailed subanalyses were conducted to provide estimates for specific tools at specific thresholds. Moreover, study quality, publication bias, and influence of relevant factors were formally investigated by meta-regression. However, the study was limited by the relatively small number of articles with relevant data published in this domain and particularly so for VaD. Estimated HRs had relatively wide CIs which suggest that further research is required to produce even more precise estimates. The fact that the CES-D was the only instrument that could be analysed separately was also a limitation. Another limitation stems from the fact that different studies did not control for exactly the same covariates which may have somewhat biased estimates.
In conclusion, when considering specific screening instruments at specified threshold, late-life depression and depressive symptomatology are consistently associated with an increased risk of dementia and AD. The CES-D is the only psychometric instrument for which specific risk estimates could be computed at known validated thresholds (16 and 20). More research needs to be conducted to determine the extent to which depressive symptomatology in the subclinical range is associated with increased dementia risk. While this study could only demonstrate associations and not causal links, available evidence support the view that depressive symptomatology is associated with pathological mechanisms associated with neurodegeneration.59 Therefore, preventative approaches to reduce the prevalence and virulence of depressive illness need to be further developed as, in addition to personal costs, it will be associated with exponential social and economic costs in our ageing population.
Acknowledgments
The authors are grateful to Jennifer Young for her contribution to the search process.
References
Supplementary materials
Supplementary Data
This web only file has been produced by the BMJ Publishing Group from an electronic file supplied by the author(s) and has not been edited for content.
- Data supplement 1 - Online supplement
- Data supplement 2 - Online tables
Footnotes
Contributors NC contributed to the design of the study, data screening and extraction, conducted all statistical analyses, and managed all aspects of manuscript preparation and submission. SK contributed to the literature search, data screening and extraction, and manuscript preparation. KJA contributed to the design of the study, provided methodological input and theoretical expertise, and contributed to writing and editing of the manuscript. All authors meet the criteria for authorship and NC accepts to provide access to the data on request. This work is valid and is not considered for publication elsewhere.
Funding Nicolas Cherbuin is funded by ARC Research Fellowship No. 120100227 and Kaarin Anstey by NHMRC Research Fellowship No. 1002560. This research was supported by the Dementia Collaborative Research Centre—Early Detection and Prevention, an Australian Government initiative.
Competing interests None declared.
Provenance and peer review Not commissioned; externally peer reviewed.
Data sharing statement No additional data are available.