Article Text

Abstract
Objectives To estimate premature mortality by age, sex and cause of death in India.
Background Studies on premature mortality in India are limited. Although evidence suggests recent reductions in infant and child mortality, little is known about the age and sex patterns of premature deaths in India.
Methods Secondary data from the Sample Registration System and, census of India and report on cause of death. A set of indices are used to estimate the premature mortality were analysed.
Primary and secondary outcome measures Standardised years of potential life lost (YPLL), premature years of potential life lost (PYPLL) and working years of potential life lost (WYPLL) for broad age groups and by selected causes of death.
Results From 1991 to 2011, the age-standardised rate of YPLL (per 1000 population) declined from 310 to 235 for males and from 307 to 206 for females. The estimated YPLL (in millions) declined from 134 to 147 for males and from 123 to 108 for females, the YPLL for adults (aged 15–65) increased by 32% for males and 28% for females, the standardised PYPLL (per 1000 population) declined from 259 to 137 for males and from 258 to 115 for females, the estimated PYPLL increased by 13% for all adult males and by 32% for 30–45-year-old adult males, and the standardised rate of WYPLL declined from 274 to 131 for males and from 295 to 91 for females. These findings suggest a significant improvement in early childhood mortality and increasing mortality trends in 30–45-year-old adult males. The YPLL and WYPLL standardised rates for males and females were highest for cardiovascular disease.
Conclusions The increasing share of premature deaths among adults and high levels of premature mortality suggest an improvement in child survival increased attention should be given to prevention and treatment of non-communicable diseases in order to avoid premature deaths in India.
- PUBLIC HEALTH
This is an Open Access article distributed in accordance with the Creative Commons Attribution Non Commercial (CC BY-NC 4.0) license, which permits others to distribute, remix, adapt, build upon this work non-commercially, and license their derivative works on different terms, provided the original work is properly cited and the use is non-commercial. See: http://creativecommons.org/licenses/by-nc/4.0/
Statistics from Altmetric.com
Strengths and limitations of this study
-
This is the first ever study to describe trends in standardised estimates of premature mortality by age and sex in India.
-
It also estimated the standardised indices by cause of death.
-
However, the study could not analyse the trends and patterns in cause specific estimates for all Indian states due to the unavailability of reliable data over time.
Introduction
Premature mortality by age 60 accounted for one-third of total deaths in low and middle income countries in 2008.1 While under-5 mortality as a proportion of premature mortality remains high in some countries, premature adult mortality is also increasing. The higher level of premature mortality is mainly due to demographic and epidemiological changes that have altered mortality levels and disease patterns across age groups.2 ,3 Non-communicable diseases (NCDs) are the leading cause of death and primarily affect those of working age.4 ,5 Studies suggest that premature deaths and hospitalisation adversely affect economic growth and development.6–8 In 2004, the estimated loss to GDP in India due to cardiovascular disease (CVD) alone was about 1 trillion rupees.8
The premature mortality rate is used to analysis the increasing social and economic cost of mortality at a younger age because conventional measures such as crude death rate and age specific death rate do not quantify the extent of life years lost following early death.9 Premature mortality is the best single proxy measure for reflecting differences in the health status of populations.10 A number of measures have been developed and used to quantify the extent of premature mortality: the potential years of life lost (PYLL), the premature years of potential life lost (PYPLL), the working years of potential life lost (WYPLL) and the valued years of potential life lost (VYPLL). All measures are a function of age at death and the number of deaths at that age,11 but they vary with respect to weight and upper and lower age limits. Although many new indices have been developed to measure premature mortality such as the DALY (disability adjusted life years), HALY (health adjusted life years) and YLL (years of life lost), these are based on a number of assumptions and have data limitations. On the other hand, the YPLL, PYPLL and WYPLL capture premature mortality as they are based on fewer assumptions and less data input.
The PYLL is the most commonly used indicator to quantify premature mortality. A large number of studies have estimated PYLL in order to rank cause of death and understand the levels, patterns and differentials in mortality by income, gender, ethnic groups and regions. Analysis of the major causes of premature mortality in Canada using PYLL revealed that accidents (38.66%) account for most PYLL followed by circulatory system diseases (24.85%) and neoplasms (15.67%).12 The PYLL varies widely among OECD countries and by sex. Among females, the estimated PYLL (per 1000) was highest in Russia (7.1) and lowest in Iceland (1.5). Among males, the PYLL was 20.2 in Russia and 3.0 in Iceland.13 Using over four decades of mortality data of USA, studies found absolute and relative declines in premature mortality across socio-economic and racial/ethnic groups during 1966–1980 and widening relative health inequalities during 1980–2002.14 The large health disparities between African American and other ethnic groups in San Francisco were estimated using expected years of life lost. There were an estimated 73 627 years of life lost among males and 51 194 among females. The leading causes of premature deaths were HIV/AIDS followed by suicide and drug overdose among males, and lung cancer, breast cancer and hypertensive heart disease among females.15 Studies also suggest that the association between income and premature mortality (deaths before age 75) was stronger in low-income counties compared to high-income counties. Among the different income groups, premature mortality varies by geographic, socio-demographic, racial/ethnic and behavioural factors.15
Like other developing countries, India is also experiencing rapid demographic and epidemiological transition. While the total fertility rate is close to replacement level, life expectancy had reached 64.6 years for males and 67.7 years for females by 2008.16 There has been a significant reduction in under-5 deaths in the last decade, decreasing from 2.5 million in 2001 to 1.5 million in 2012.17 ,18 During 1991 and 2011, under-5 deaths as a percentage of total deaths declined from 35% to 17%, while adult deaths (deaths at 15–59 years of age) as a percentage of total deaths increased from 27% to 30%.19 NCDs are the leading cause of mortality and morbidity and account for 62% of the total burden of foregone DALYs and 53% of total deaths in India.20 Deaths from CVD were estimated to be 1.4 million (56.2% in the 25–69-year-old age group) in 2004 and are projected to reach 2.1 million (45% in the 25–69-year-old age group) by 2021.21 Between 1995 and 2004, the hospitalisation rate and outpatient visits due to NCDs rose from 32% to 40% and from 22% to 35%, respectively.20 Deaths from CVD resulted in a loss of 9.2 million years among the 35–64-year-old age group in 2000, which loss is projected to reach 17.9 million years by 2030.22 Although many studies on trends, differentials and determinants of mortality have been carried out, no study has examined premature mortality in India.23–26
The aim of this paper is to examine the age and sex patterns of premature mortality in India over the last two decades (1991–2011). It also estimates the extent of premature mortality by selected causes of death for 2002. This study has been carried out for several reasons. First, evidence suggests an increase in premature and avoidable adult deaths in India. As the social, psychological and economic costs associated with premature deaths are enormous, the prevention of these deaths must be a public health priority. Second, NCDs are the leading cause of death in India and affect individuals 10–15 years earlier than in developed countries. These deaths primarily occur among those of working age causing a rise in premature mortality. However, public health centres are not sufficiently equipped to treat NCDs. Third, although premature mortality has been extensively studied in developed countries, no study has estimated the level of and trends in premature mortality in India. Quantification of premature mortality would help identify the social and economic cost associated with mortality, rank the disease burden and be useful for policy making. In this context, this paper provides numerical estimates on premature deaths in India over time and by causes of death for broad age groups.
Data and methods
This paper uses data from multiple sources: the Census of India for 1991, 2001 and 2011, the Sample Registration System (SRS), 1991–2011 and reports on causes of death, 2001–2003.27–31 We have used published data and there are no ethical issues. The Indian census is the largest single source of information on demographic and selected socio-economic characteristics of the population. We have used the age and sex distribution of the population for 1991, 2001 and 2011, and information on the age and sex distribution for intercensal periods (1996 and 2006) from the SRS. Data on causes of death are extremely useful for planning health programmes and intervention strategies. The Special Survey of Deaths (SSD) was jointly undertaken by the Office of the Registrar General, India (ORGI) and the Centre for Global Health Research (CGHR)27 in 2004–2005 and covered 114 000 deaths in 1.1 million households recorded during 2001–2003 in SRS.27 The cause of death was determined using an advanced form of verbal autopsy called the ‘RHIME’ (Representative, Re-sampled, Routine Household Interview of Mortality with Medical Evaluation) method. We have used data on the distribution of deaths by age, sex and cause from this report to estimate premature mortality. The vital registration system and the Medical Certification of Cause of Deaths (MCCD) also provide information on deaths by age, sex and selected characteristics. However, the vital registration system in India is incomplete and is of limited use for analyses,32 while the MCCD also has very low coverage and is not suitable for a representative analysis.33
This paper use three indices, namely, the YPLL, PYPLL and WYPLL, and their standardised rates to examine the extent of premature mortality in India. In case of standardised rates, the age distribution in Kerala for 2011 is used as the reference population because Kerala is a demographically advanced Indian state. The 3-year moving average of the age specific death rate is used. Individuals aged 15–65 years are considered adults. The analysis has been carried out for all India. The method of computing each of the indices is given below.
Years of potential life lost (YPLL)
The YPLL is a summary measure of premature mortality that gives higher weight to deaths occurring at younger age and lower weight to deaths at higher age. It estimates the average years a person would have lived had he or she not died prematurely.11 The method used in this study is given by: 1where Li is the life expectancy at age i, and di is the number of deaths at age i. The deaths are weighted by life expectancy at each age.
The standardised YPLL and corresponding rates have been calculated as follows12: 2where Pi,r is population in the ith age group in the reference population (Kerala), Nr is the total reference population (Kerala), N is the total study population, and Pi is the population in the ith age group in the study population.
The rate of YPLL is calculated as follows: 3
3
Premature years of potential life lost (PYPLL)
The PYPLL measures the loss of years of productive life due to death before a cut-off age. The upper age limit on estimating PYLL varies by countries and authors.11 We have used the upper age limit of 65 years, close to average life expectancy in India: 4where di is the number of deaths at age i, and U is the upper limit of age (65 years). At each age, the deaths are weighted by the difference between the upper age limit and age at death.
The standardised PYPLL is calculated as follows: 5where Pi,r is the population in the ith age group in the reference population (Kerala), Nr is the total reference population in the 0–65 age group (Kerala), N is the total study population in the 0–65 age group, and Pi is the population in the ith age group in the study population.
The rate of PYPLL is calculated as follows: 6where N is the total population in the 0–65 age group.
Working years of potential life lost (WYPLL)
The WYPLL measures the years of working life lost during ‘the working age period’ in a population: 7where di is the number of deaths at age i, U is the upper cut-off age (65 years), and W is the lower cut-off age (14 years).
Here a constant weight is assigned to deaths before age 14 years; differences in the upper and lower age cut-offs and deaths at age 14 and above are weighted by the difference between the upper age limit and age at death: 8where Pi,r is population in the ith age group in the reference population (Kerala), Nr is the total reference population in the 0–65 age group (Kerala), N is the total study population in the 0–65 age group, and Pi is the population in the ith age group in the study population.
The rate of WYPLL is calculated as: 9where N is the total study population in the 0–65 age group.
The estimated population and deaths by age and sex for 1991–2011 are shown in supplementary online appendices 1 and 2.
Cause specific indices of premature mortality
Using a similar weighting procedure and methods, we have also computed the YPLL, PYPLL and WYPLL for selected causes of death for 2002. The distribution of deaths by cause, age and sex is taken from the Report on Causes of Death for 2001–2003 of the Registrar General, India. The weight assigned to each age group is built into each of the indices. In general, in each method, the younger age groups are assigned a higher weight and the older age group a lower weight.
Results
Results are presented in two sections. The first section describes the trends in premature mortality by age and sex, while the second section describes premature mortality by causes of death.
Trends in premature mortality by age and sex, 1991–2011
Table 1 presents the standardised YPLL in millions for a period of two decades (1991–2011) by broad age group and sex. From 1991 to 2011, the YPLL increased from 134 million to 147 million among males, while it declined from 123 million to 108 million among females. The rate of YPLL declined from 310 to 235 per 1000 population for males and from 307 to 206 for females in the same period. Although the overall decline in YPLL reflects a marked improvement in mortality in the population, it conceals large discrepancies between age groups. The decline in YPLL was significant among the younger age group, particularly among children, while it increased among adults (15–64 years). Among children under 5 years of age, the YPLL declined by 38% for males and 32% for females in this period. Among adults aged 15–64 years, the YPLL increased for males in most age groups. For example, during 1991–2011, the YPLL for males increased by 48% in the 30–45 age group and by 25% in the 45–59 age group. Among adult females, the largest decline in YPLL was in the 5–14 age group, while it increased in the 60–70 age group. Although the absolute value of YPLL increased during 1991–2011, the rate of YPLL declined. Although the YPLL showed a large decline for those aged under-5, it was still highest in this age group. The YPLL did not show a secular decline: it initially increased during 1991–2001 and declined thereafter.Table 2 provides the PYPLL by age and sex for the last two decades. The PYP LL fixes an upper limit until which individuals are expected to survive and measures the loss of years of productive life due to death before a selected cut-off age. During 1991–2011, the estimated PYPLL for males declined from 108 to 81 million, while that for females declined from 99 to 64 million. The rate of PYPLL among males declined from 259 in 1991 to 224 in 2001 and 137 in 2011. Among females, the rate of PYPLL declined from 258 in 1991 to 213 in 2001 and 115 in 2011. The decline in PYPLL was faster among females compared to males. During 1991–2011, the YPLL among children under 5 years of age declined from 64 million to 35 million for males and from 60 million to 34 million for females. The decline was secular for both males and females. On the other hand, in the 15–65 age group, the PYPLL declined for females but not for males. The PYPLL for males in the 30–45 age group increased from 11 million to 14 million. In all years studied, the PYPLL among males was highest in the under-5 age group followed by the 45–59 age group. Similarly for females, the PYPLL was highest in the under-5 age group followed by the 15–29 age group. The PYPLL increased by 13% among adult males and declined by 20% among adult females. The highest increase in PYPLL was among males in the 30–45 age group (32%) followed by the 60–65 age group. While a declining PYPLL among children is a good sign, the increase in these indices among working age adults is a concern. This is possibly due to an increase in NCDs that largely affect the prime working age groups. Table 3 presents the WYPLL by age and sex for the last two decades. The WYPLL assigns a higher weight to the working age population. From 1991 to 2011, the WYPLL declined from 114 million to 77 million among males and from 113 million to 45 million among females. The rate of WYPLL declined from 274 in 1991 to 131 in 2011 for males and from 295 in 1991 to 91 in 2011 for females. The estimate of WYPLL by age over time shows a pattern similar to that of YPLL. Among females, the WYPLL declined over all age groups, while for males it declined only for the younger age group. Among males aged 30–45 years, the WYPLL increased from 9 million in 1991 to 13 million by 2011. The WYPLL was higher among females compared to males in all age groups. The WYPLL does not change the gradient across age and sex over a period of time.
Trends in years of potential life lost (YPLL) in millions (standardised) and rate of YPLL (per 1000 population by age and sex) in India, 1991–2011
Trends in premature years of potential life lost (PYPLL) in millions (standardised) and rate of PYPLL (per 1000 population by age and sex) in India, 1991–2011
Trends in working years of potential life lost (WYPLL) in millions (standardised) and rate of WYPLL (per 1000 population by age and sex) in India, 1991–2011
Premature mortality by causes of death
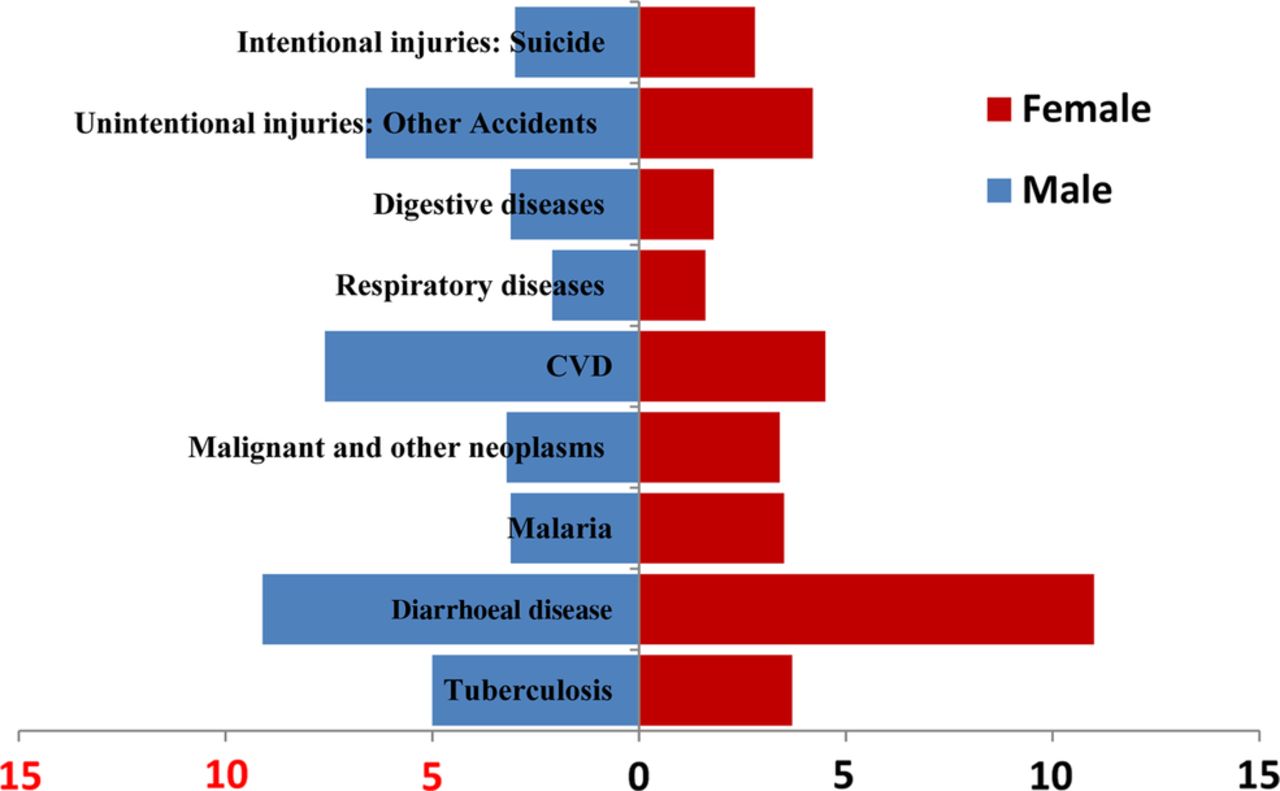
Table 4 and figures 1⇓–3 present the indices of premature mortality by causes of death for males and females. We have taken the top nine causes of death among adults and computed the YPLL, PYPLL and WYPLL. These indices were estimated for 2002 because causes of death data were available only for this year. Among the nine leading causes of death, CVD accounts for the greatest loss in YPLL and WYPLL. The WYPLL among males was 26 million due to CVD, 12 million due to tuberculosis, and 11 million due to diarrhoeal diseases. The rate of WYPLL among males was also greatest for CVD (50 million) followed by tuberculosis (23 million) and diarrhoeal diseases (22 million). Similarly, for females, the WYPLL was highest for CVD (15 million) followed by diarrhoeal diseases (14 million) and malignant and other neoplasms (8 million). Among males, the YPLL was highest for CVD (21 million) followed by diarrhoeal diseases (12 million) and tuberculosis (9 million). For females, the YPLL was highest for CVD (17 million) followed by diarrhoeal diseases (9 million) and respiratory diseases (8 million). Regarding PYPLL, among males, the PYPLL rate was highest for diarrhoeal diseases (9 million) followed by CVD (8 million) and accidents (7 million). In the case of females, the rate of PYPLL was also highest for diarrhoeal diseases (11 million) followed by CVD (4 million) and accidents (4 million). The corresponding YPLL, PYPLL and WYPLL rates show the same trends for the given causes of death.
Estimates of years of potential life lost (YPLL), premature years of potential life lost (PYPLL) and working years of potential life lost (WYPLL) and the corresponding rates by cause in India, 2002
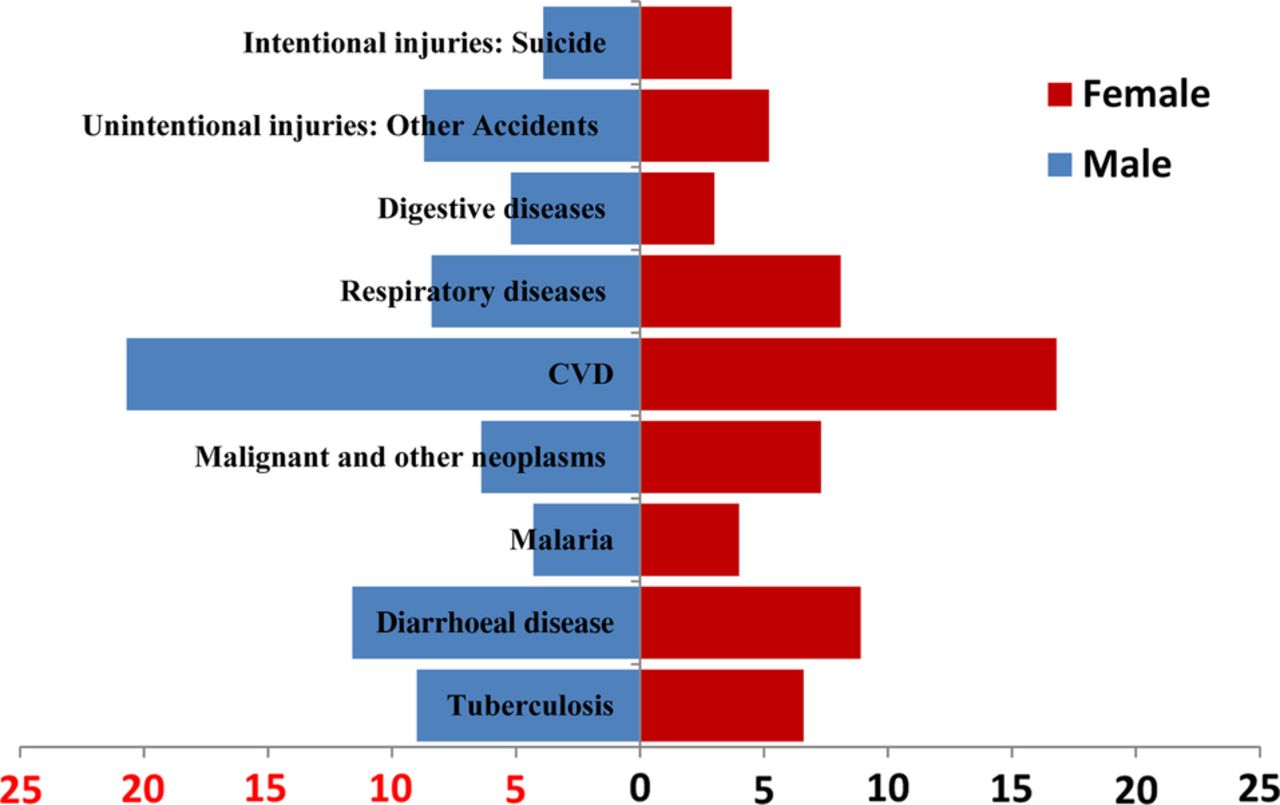
Years of potential life lost (YPLL; (in millions) for top nine causes of death among adults by sex in India, 2002. CVD, cardiovascular disease.

Premature years of potential life lost (PYPLL; in millions) for top nine causes of death among adults by sex in India, 2002. CVD, cardiovascular disease.

Working years of potential life lost (WYPLL; in millions) for top nine causes of death among adults by sex in India, 2002. CVD, cardiovascular disease.
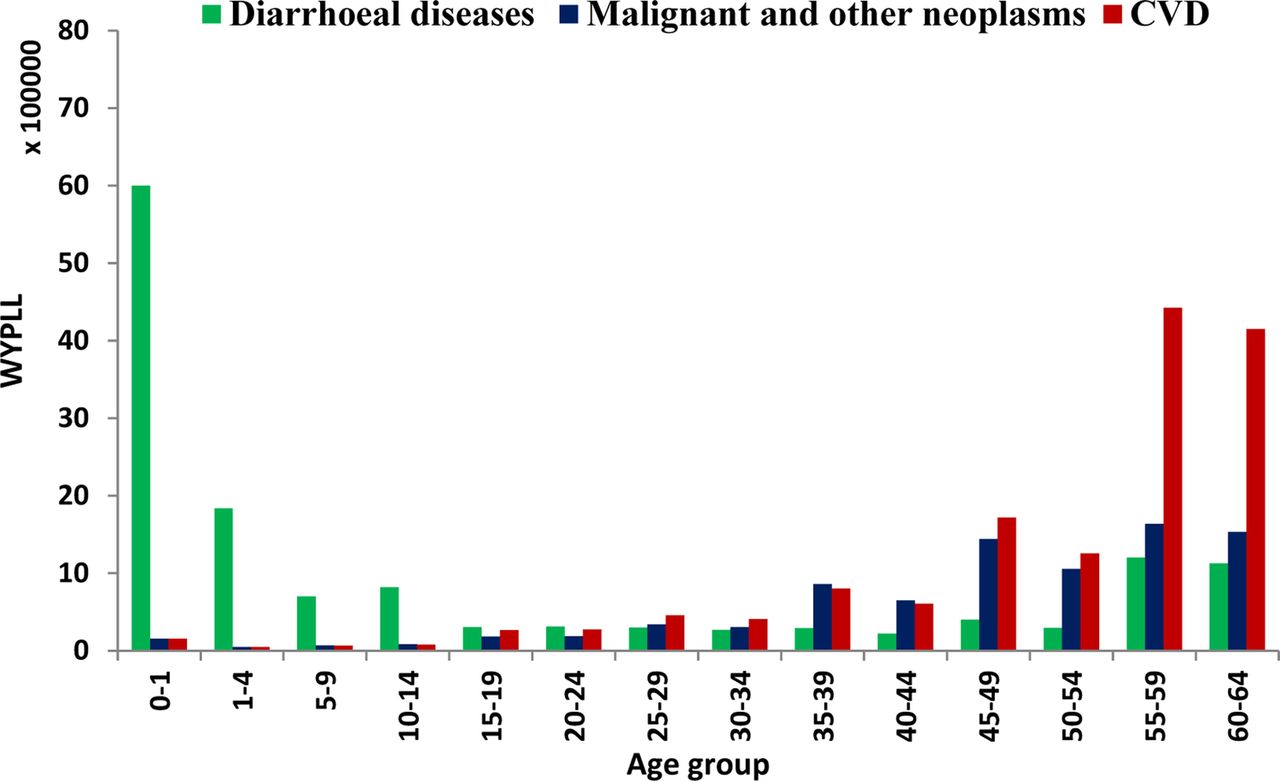
Figures 4 and 5 depicts the age pattern of WYPLL for the top three causes of death among males and females. Diarrhoeal diseases account for the majority of years lost among children (0–14 years), while CVD accounts for the most life years lost among adults and the older population. The adult population is affected by both communicable and non-communicable diseases. For example, among males, CVD and tuberculosis are high at adult ages. Similarly, among adult females, CVD and malignant and other neoplasms are leading causes of premature mortality.

Standardised working years of potential life lost (WYPLL) by top three diseases and age among males in India, 2002. CVD, cardiovascular disease.
Standardised working years of potential life lost (WYPLL) by top three diseases and age among females in India, 2002. CVD, cardiovascular disease.
Discussion and conclusion
The rate of premature mortality has been used as an important measure of health status and as a guide for health policies in many developed countries. Estimates of premature mortality and understanding the factors affecting premature mortality are essential for reducing preventable deaths and improving population health. Over the last two decades, India has made significant progress in reducing infant and child mortality and improving life expectancy. The increase in life expectancy is evident across socio-economic groups and regions. A number of studies have helped in understanding the differentials, determinants of and inequality in infant and child mortality in India.17 ,34–36 However, evidence suggests adult mortality is increasing although studies examining premature mortality in India are limited. In this context, we have attempted to provide numerical estimates of premature mortality using a set of indices by age and sex over two decades. We have used published data from SRS and a special survey on cause of death and estimated the YPLL, PYPLL and WYPLL for broad age groups. Although the estimates of premature mortality by cause of death are 13 years old, the inferences remain the same because of an increasing incidence of NCDs. The following are the salient findings.
First, we found a decline in premature mortality indices (YPLL, PYPLL and WYPLL) and their rates for both males and females except for YPLL for males. This is consistent with the overall improvement in the health of the population. Second, the decline in premature mortality indices conceals large differentials across age groups and sex. The decline in premature mortality indices is largely due to an improvement in mortality in the younger age group, for example, 0–14 year-olds, as it has actually increased among male adults. Third, the age pattern of the indices reveals that premature mortality continued to be highest in the under-5 age group although the decline was also highest in this same age group, decreasing by more than one-third in the last two decades. However, all these indices have increased in the 35–49 age group suggesting increasing adult male mortality. Fourth, the highest YPLL and WYPLL for both males and females were due to CVD. Most CVD deaths are premature and affect the prime working age groups. Fifth, the estimate of PYPLL was highest for diarrhoeal diseases followed by CVD. This is because the PYPLL assigns a higher weight to children and diarrhoeal diseases are higher among children.
From the above findings, it is clear that the level of premature mortality in India is higher than in many developing and developed countries. The level of premature mortality is high because of both higher under-5 mortality and higher adult mortality. While the existing programme to reduce under-5 mortality should continue, efforts need to be intensified to reduce adult mortality. Adult mortality could be reduced by increasing central and state government spending to combat NCDs. Large scale investment in the medical infrastructure to treat NCDs and increased health insurance coverage would also be helpful. Policies aimed at reducing the production and consumption of alcohol and tobacco and at creating awareness of a healthy lifestyle can reduce the risk factors for NCDs and avoidable mortality. The central government programme to combat NCDs has been implemented and the twelfth 5-year plan made specific provision for the management and control of NCDs under three categories: programmes for lifestyle chronic diseases and risk factors, programmes for disability prevention and rehabilitation, and programmes for health promotion and prevention of NCDs.37 Continuation of the maternal and child health programme and effective implementation of programmes to combat NCDs can reduce avoidable mortality in India.
References
Supplementary materials
Supplementary Data
This web only file has been produced by the BMJ Publishing Group from an electronic file supplied by the author(s) and has not been edited for content.
Files in this Data Supplement:
- Data supplement 1 - Online appendix 1
- Data supplement 2 - Online appendix 2
Footnotes
-
Contributors MD and SKM conceptualised the paper, prepared the analytical plan and wrote the paper.
-
Competing interests None.
-
Provenance and peer review Not commissioned; externally peer reviewed.