Article Text

Abstract
Objective Diarrhoea is a significant contributer to morbidity and is among the leading causes of death of children living in poverty. As such, the incidence, duration and severity of diarrhoeal episodes in the household are often key variables of interest in a variety of community-based studies. However, there currently exists no means of defining diarrhoeal severity that are (A) specifically designed and adapted for community-based studies, (B) associated with poorer child outcomes and (C) agreed on by the majority of researchers. Clinical severity scores do exist and are used in healthcare settings, but these tend to focus on relatively moderate-to-severe dehydrating and dysenteric disease, require trained observation of the child and, given the variability of access and utilisation of healthcare, fail to sufficiently describe the spectrum of disease in the community setting.
Design Longitudinal cohort study.
Setting Santa Clara de Nanay, a rural community in the Northern Peruvian Amazon.
Participants 442 infants and children 0–72 months of age.
Main outcome measures Change in weight over 1-month intervals and change in length/height over 9-month intervals.
Results Diarrhoeal episodes with symptoms of fever, anorexia, vomiting, greater number of liquid stools per day and greater number of total stools per day were associated with poorer weight gain compared with episodes without these symptoms. An instrument to measure the severity was constructed based on the duration of these symptoms over the course of a diarrhoeal episode.
Conclusions In order to address limitations of existing diarrhoeal severity scores in the context of community-based studies, we propose an instrument comprised of diarrhoea-associated symptoms easily measured by community health workers and based on the association of these symptoms with poorer child growth. This instrument can be used to test the impact of interventions on the burden of diarrhoeal disease.
This is an Open Access article distributed in accordance with the Creative Commons Attribution Non Commercial (CC BY-NC 3.0) license, which permits others to distribute, remix, adapt, build upon this work non-commercially, and license their derivative works on different terms, provided the original work is properly cited and the use is non-commercial. See: http://creativecommons.org/licenses/by-nc/3.0/
Statistics from Altmetric.com
Strengths and limitations of this study
-
A standardized measure of diarrhoeal severity was derived in order to improve the assessment of diarrhoeal morbidity in community-based studies.
-
Intensive (three times weekly) surveillence was used to capture caregiver-reported symptoms and signs of diarrhoeal episodes and to relate these to weight gain.
-
The resulting measure is non-etiology specific, unlike prior measures that favor particular enteropathogens.
-
A lack of information about clinical signs associated with severe disease, including dehydration and rectal temperature, limits the comparability of this instrument to existing diarrhoeal severity scores.
Introduction
Diarrhoea is a common cause of morbidity and mortality among children in the developing world.1 In addition to causing an estimated 0.75 million deaths per year,2 it is estimated that the average child under five in the developing world will experience 2.9 episodes per year.3 The severity of these episodes is a common factor of interest in community-based epidemiological studies designed to test the impact of an intervention and/or quantify the burden of diarrhoeal disease.4
Within the context of community-based studies, diarrhoea is defined as three or more loose stools per 24 h period,5 prolonged diarrhoea is diarrhoea lasting between 7 and 13 days and ‘persistent’ diarrhoea as an episode of at least 14 days.6 ,7 These definitions were standardised in the early 1990s, leading to greater comparability between studies and progress in the field.
Definitions of diarrhoeal severity, however, have remained variable.4 Clinical indicators of severity such as dehydration and dysentery8 are associated with an acute risk of patient mortality and are used to guide therapy. These signs and symptoms, in addition to the need for hospitalisation, can define moderate-to-severe diarrhoea among cases presenting for care at a healthcare centre, but will not gradate between the majority of mild-to-moderate cases in the community (see figure 1). As diarrhoea case death rates decline, there is increasing interest in understanding the impact of mild-to-moderate disease on child health and development. For these episodes, there is a need for non-clinical measurement instruments adapted for use at a community level.
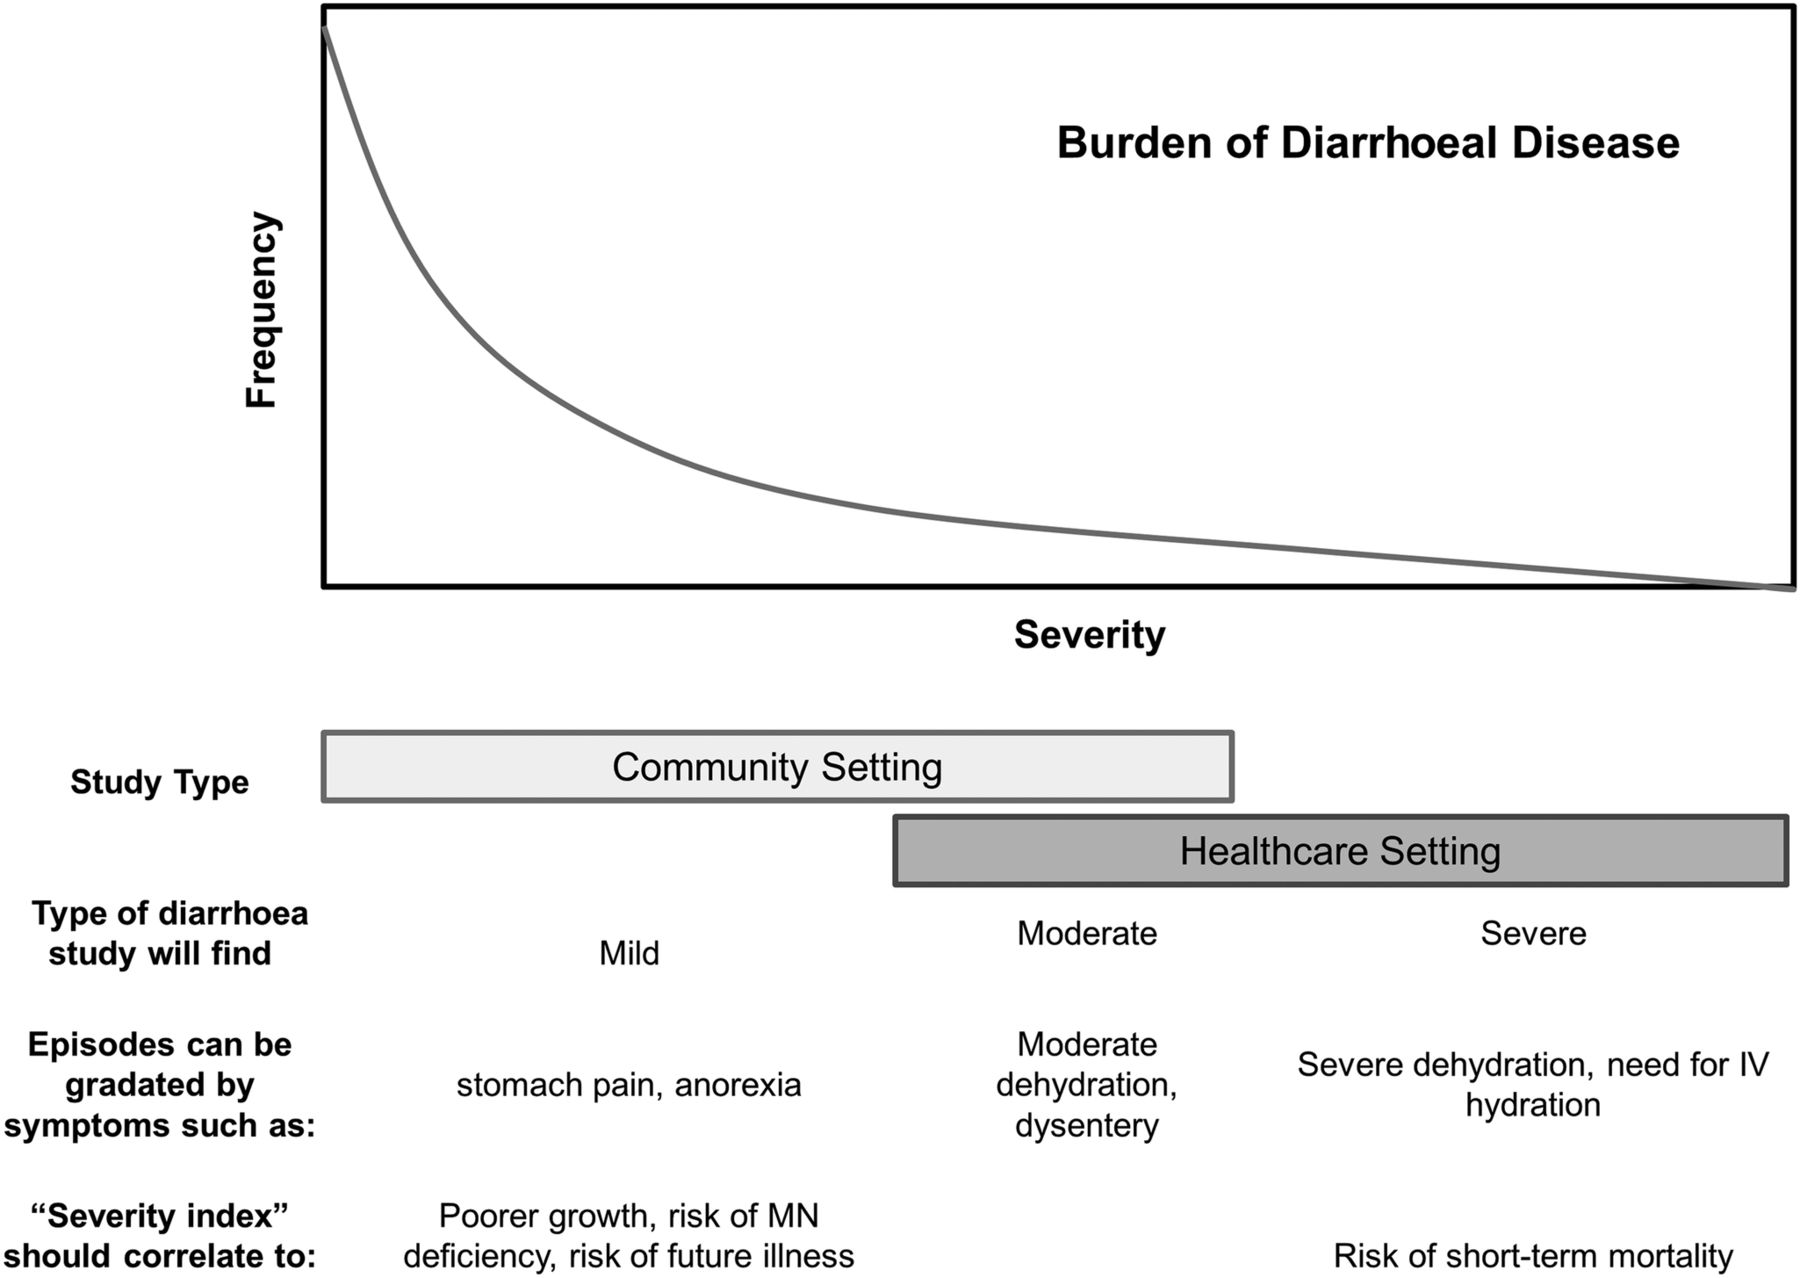
Conceptual diagram of idealised severity score.
Several severity measurement instruments have been developed for classifying rotavirus diarrhoea.9–11 However, these scores were not designed to differentiate the severity of non-rotavirus diarrhoea, which is less frequently associated with symptoms such as vomiting. Although rotavirus is the most frequently isolated pathogen among hospitalised diarrhoea cases, there are other pathogens that are isolated more frequently in a typical community context. Furthermore, instruments that include hospitalisation as a model input are problematic in settings where access to inpatient care facilities is heterogeneous, as can be observed in many low-income and middle-income settings.
Previous instruments have included components such as rectal temperature and indexes of dehydration require either an invasive measurement or one that may be challenging to consistently measure across studies. These scales cannot be implemented in the context of community-based studies, where caregivers may not seek care for episodes of mild-to-moderate diarrhoea and where surveillance is frequently bi-weekly or weekly12 and many episodes resolve in the interval between a study worker's regularly scheduled visits. While some studies have attempted to correct this problem through the creation of ‘modified’ Vesikari scores,13 ,14 these scores were based on data from Canadian infants and HIV+ infants, respectively, making their findings less generalisable to the typical cases of paediatric diarrhoea in the developing world.
Finally, the determination of severity with these instruments has generally been based on the empiric distribution of characteristics such as fever or dysentery associated with that particular cohort, rather than through association with morbidity.4 There are currently no instruments that correlate on the high end with severe outcomes such as mortality and hospitalisation, and on the middle-to-low end with other more frequently occurring adverse health outcomes.
The acute weight loss associated with a diarrhoeal episode puts a child at risk of becoming underweight and/or wasted, outcomes associated with an increased risk of mortality,15 ,16 further infectious disease17 and future stunting.18 Poorer linear growth in early childhood is associated with long-term negative outcomes including poorer cognitive development,19 adult work capacity and income20 and, for girls, poorer maternal health.15 Therefore, short-term weight gain and medium-to-long-term linear growth are appropriate functional outcomes through which to validate measures of disease severity, and signs and symptoms associated with poorer growth should be prioritised in the formation of diarrhoeal severity scores.
Using data from a previously established longitudinal cohort with a high incidence of diarrhoea and stunting and with standard community-based active surveillance measures, we evaluated the impact of diarrhoeal-associated signs and symptoms on short-term weight gain in the subsequent temporal period. From this, we formed a diarrhoeal severity score to predict the acute weight loss as well as depressed linear growth over longer temporal windows. This instrument may be validated for use in community-based studies, clinical trials, and water, sanitation and hygiene interventions.
Methods
Data were from a prospective, community-based study of 442 children 0–72 months of age living in the community of Santa Clara, located 15 km southeast of Iquitos, Peru. The cohort and study design were described previously21 ,22; the overall objective was to explore the association between common aetiologies of diarrhoea and early childhood growth. The work described here was a prespecified secondary objective of the study.
From October 2002 to April 2006, participating families were visited three times weekly by a trained health promoter to document the number and consistency of stools passed by the child over the previous 24 h period, as well as other signs and symptoms such as fever, anorexia, malaise, nausea, vomiting, stomach pain and the reported presence of blood and mucus in the child's faeces. For example, malaise was translated as ‘malestar general’ and described to mothers as a lack of energy or irritability in the child, and anorexia (translated as ‘recibe bien la comida’) was described as the child's willingness/eagerness to eat as usual. This generated a continuous history of diarrhoeal disease over the surveillance period for each participating child. Anthropometry was collected monthly, and socioeconomic and demographic information were collected during two community censuses before and during the study period. Diarrhoea was defined by three or more semiliquid stools reported over a 24 h period, with episodes separated by at least three symptom-free days. Stool samples were collected as soon as possible after the case definition for diarrhoea was met, and not more than 2 days after the episode ended. Faecal blood and mucus, as reported by a laboratory technician, were also reported once per episode.
Symptoms associated with diarrhoea were defined as having occurred during the diarrhoeal episode if they were present on any day of the episode. The duration of symptoms associated with diarrhoea was defined as the number of days of the episode in which the symptoms occurred. Symptoms which were present the day before or the day after an episode of diarrhoea were not counted.
Since persistent diarrhoea is regarded as a separate epidemiological phenomenon with effects on growth apart from those of shorter episodes,23 only episodes of <14 days were retained in the analysis. In this cohort, less than 2% of episodes were persistent (≥14 days=2.4% of all episodes).
Statistical methods
The percentages of episodes associated with a given symptom by age were tabulated and compared (analysis of variance), and correlations and partial correlations between the presence and duration of symptoms during an episode were calculated. All analyses were performed using Stata V.11 and Stata V.12 (StataCorp, College Station, Texas, USA).
Effects of specific symptoms on short-term weight gain
The effect of the presence of a sign or symptom (see the list of symptoms in table 1) on a child's weight gain was modelled using the change in the weight of the child before versus after the episode. Only intervals in which a diarrhoeal episode was present were included in the model (ie, episodes of diarrhoea were compared with each other, and were not compared with periods in which no diarrhoea occurred). Only episodes that occurred between two instances of anthropometry 1 month apart were considered, that is episodes which overlapped an anthropometric measurement were discounted. In order to avoid instances in which acute dehydration might have impacted the weight gain, episodes that ended less than 2 days before anthropometry were also excluded. Rather than including the same 1-month interval of anthropometry repeatedly within the model, when more than one episode occurred within the same 1-month interval, only the episode of longer duration was retained, and the total number of episodes in the month was considered as a covariate in the analysis. Sensitivity analysis was performed to determine the effect of these omissions on model outputs. 1
1
Association of signs and symptoms with weight gain
The final model used to evaluate associations of symptoms with weight gain is shown in equation 1.  represents the presence or absence of a symptom during the episode or the duration (in days) of the symptom during an episode (column 2 of table 1). Seasonal variation in weight gain was modelled by adding the terms
  and
and  , where d is the day of the year and t is 365.24 Age term 1 and age term 2 are fractional polynomials used to estimate the impact of age on monthly weight gain. The models were also fitted with a child-level random intercept and a covariance structure that fixed a first-order autoregressive residual structure to account for those instances in which a child experienced episodes of diarrhoea over consecutive 1-month intervals.
Formation of a severity score
Symptoms negatively associated with weight gain were categorised by duration and combined to form a severity score. In order to judge how many points should be given to symptoms of a given duration, models where the duration was categorical were used to determine whether the association per day of the symptom with weight gain was additive, or whether there were threshold effects. After obtaining the score, sensitivity analysis was used to check that the inclusion of each additional component improved the overall model fit.
The score was then collapsed into three categories representing relatively mild, moderate and severe diarrhoea. The same model was then fit using the categorised variable. The unadjusted mean change in weight and the weight-for-height z-score (WHZ) by severity category, and the adjusted 1-month change in WHZ by severity category, were also estimated.
Effects of specific symptoms and overall severity on linear growth
In order to examine the relationship between individual symptoms and change in length/height, the cumulative incidence of episodes with and without each symptom was summed over 9-month intervals, and the effect of these episodes on linear growth (change in length/height) was modelled using equation 2, where  is the cumulative incidence of diarrhoeal episodes in which the symptom occurred, and
  is the cumulative incidence of diarrhoeal episodes in which the symptom was absent, during the 9-month interval. The same seasonal terms and a set of fractional polynomial terms generated separately from those in the weight model were included. The models were also fitted with a child-level random intercept and a covariance structure that fixed a first-order autoregressive residual structure.
 2
2
The impact of episodes of varying severity, as categorised by the severity score developed above, was then tested similarly, using a model with three incidence terms,  ,
,  and
and  , representing the cumulative incidence of mild, moderate and severe episodes in the 9-month interval, respectively. A similar model using a 9-month change in height-for-age Z score (HAZ) as an outcome was used to test the effects of disease severity on HAZ.
Results
A total of 3915 acute episodes were available for analysis. Of these, 2462 were used in building the severity score (on the basis of being associated with anthropometry according to the criteria above, and with shorter episodes in the same month discounted; see figure 2). Sensitivity analysis did not reveal any bias introduced by removing these episodes. Overall, 93.2% of the non-persistent episodes were associated with a laboratory result, of which 96.6% were collected within 2 days of the onset of the episode.

Episodes included in the analysis.
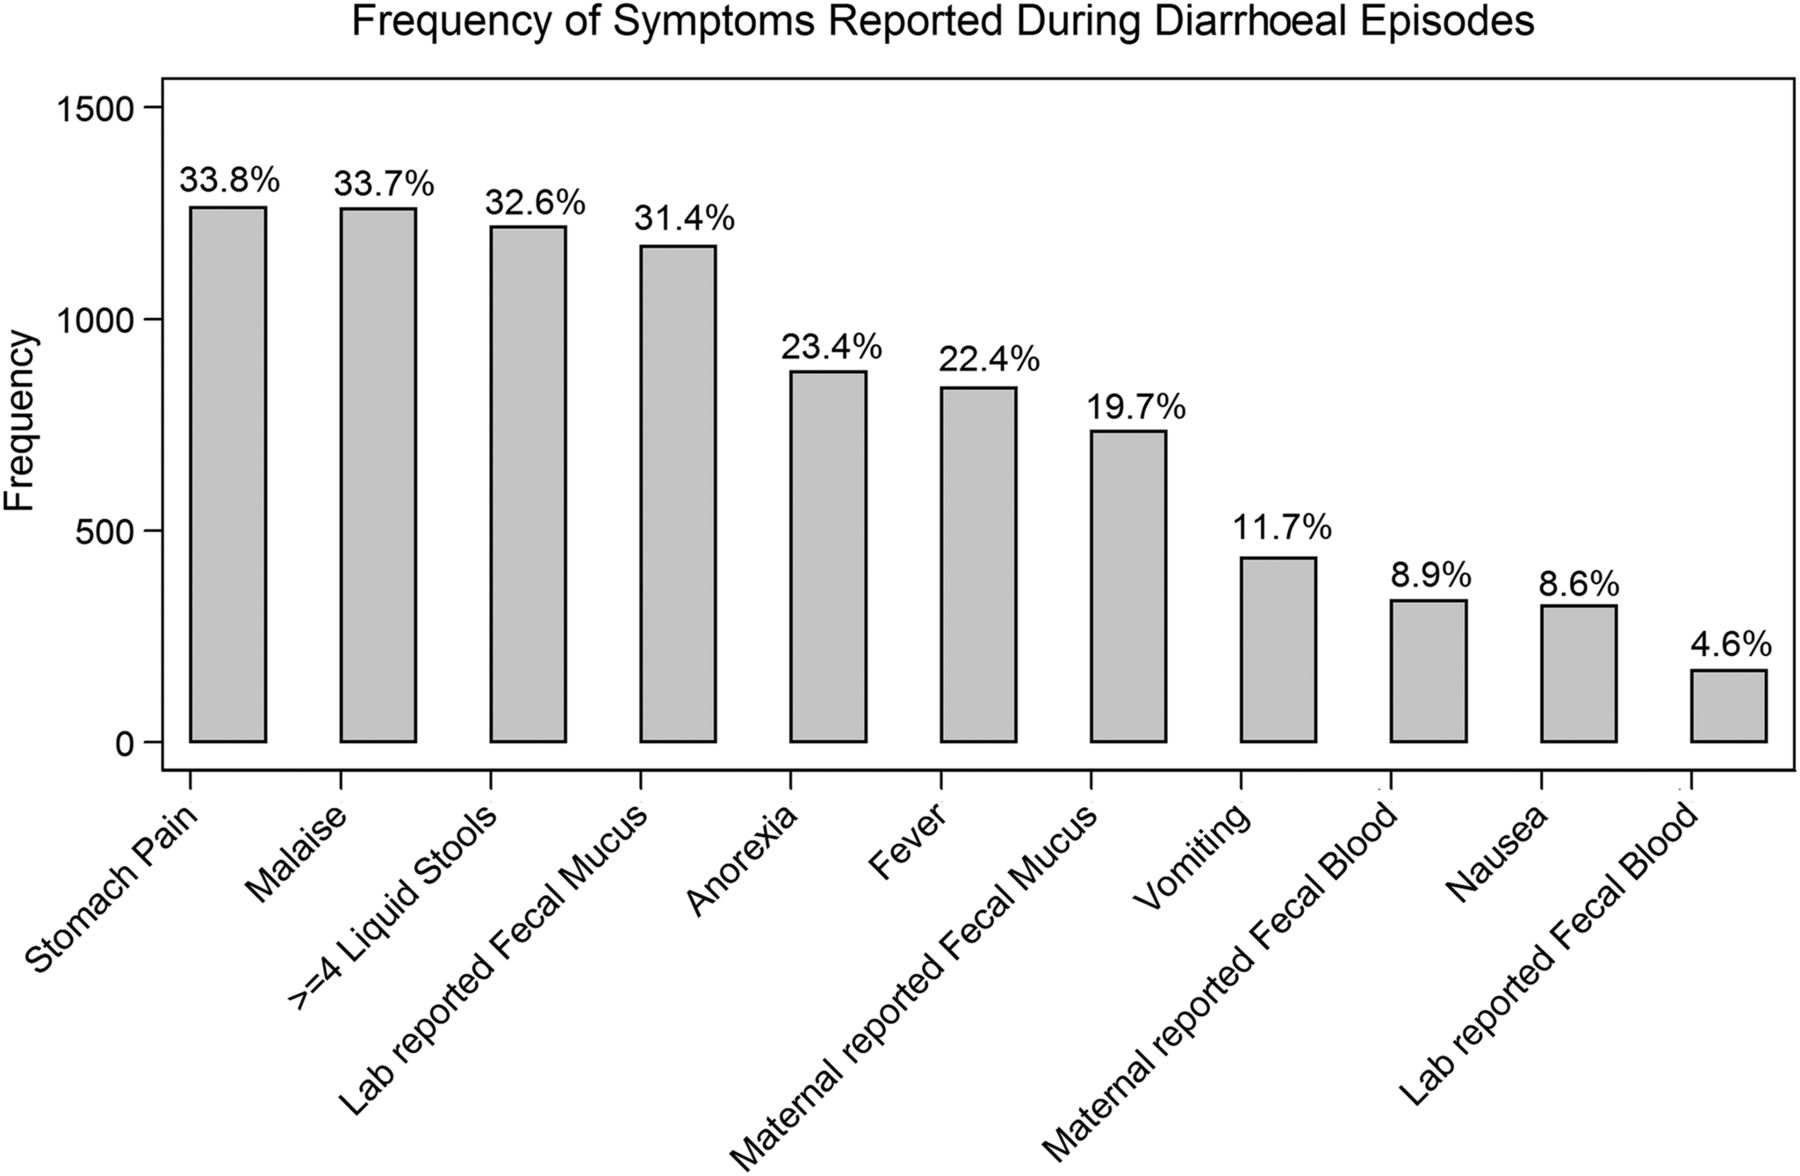
The signs and symptoms considered in the analysis are reported in table 1. The number of episodes associated with each symptom is shown in figure 3. Most symptoms (all except anorexia and dysentery) were most common among the youngest children (≤2 years) and decreased in prevalence with age.

Distribution of signs and symptoms: out of all episodes (n=3915).
Correlations between the reporting of these symptoms during an episode ranged from 0.02 to 0.64. The strongest correlations were between the maternal report of blood and the laboratory-reported blood (r=0.64), followed by nausea and vomiting (r=0.64), total and liquid depositions ≥4 (r=0.59), maternal report of blood and mucus (r=0.59), malaise and stomach pain (r=0.55) and malaise and anorexia (r=0.43). The correlations between the symptoms as categorised in the final severity score are reported below (table 2).
Correlations between symptoms retained in the final severity score (N=3915)
Effects of specific symptoms on short-term weight gain
Anorexia, fever, malaise, vomiting and the maximum number of stools per 24 h period were all associated with poorer weight gain in months associated with diarrhoea (p≤0.010). These symptoms were associated with between 9.9 and 28 g less weight gain per each day in the episode during which they occurred (table 1).
The number of days in an episode with ≥2, ≥4, ≥6 and ≥8 liquid and or/semiliquid stools was strongly correlated with each other. Of these, the number of days with ≥4 liquid stools led to the greatest improvement in model fit and was therefore retained for further analysis. Each day in which ≥4 liquid stools were present was associated with 23.5 g less weight gain (table 1).
Formation of a severity score
In total, six factors were associated with poorer weight gain. With the exception of malaise, these variables were then categorised into four levels according to the duration of the symptom (table 3), and the severity score was built by summing these five categorical variables (table 3, figure 4 and online supplementary table S1). In order to make the score more parsimonious, malaise was excluded while anorexia, which was correlated with malaise (r=0.43), appeared in multivariate models to explain the association between malaise and weight gain, and was also perceived as less subjective, and was retained. Other symptoms were more weakly correlated with each other (r<0.40; table 2), and the exclusion of anyone from the overall score led to a decrease in model fit. A model that included the overall score also fit better than one in which all variables were included individually.
Severity score card

Histogram of severity score distribution: the y-axis (frequency) indicates the number of episodes assigned to the score (N=3915).
Episodes were categorised empirically based on their distribution within this dataset as mild (score=0, no additional symptoms present beyond meeting the minimum criteria for diarrhoea), moderate (1–6; 35th–95th centile) and severe (≥7; >95th centile). Using this categorisation process, episodes of moderate severity did not predict less weight gain over 1 month than episodes of mild severity (−25.4 g, p=0.186), and episodes of high severity predicted 132.2 g less weight gain (table 4). When the change in WHZ was used as the outcome, moderate and severe episodes predicted a loss of 0.008 (p=0.720) and 0.171 (p=<0.001) z-scores over the month of the episode, respectively (table 4).
Association between the severity score and the change in weight and WHZ
Effects of specific symptoms and overall severity on linear growth
Of all the signs and symptoms tested, only dysentery, as defined by laboratory-observed blood in stool, was independently predictive of poorer linear growth (results not shown). Because dysentery was not included in the severity score, it was then added as an independent variable to the model testing the impact of the severity score overall.
Incident episodes of low severity were not associated with poorer linear growth or changes in HAZ, while each episode of moderate severity predicted 0.035 cm less linear growth and 0.009 less HAZ. Episodes of the highest severity were also unassociated with changes in linear growth and HAZ over the 9-month period (table 5).
Association between severity score and linear growth
Discussion
During diarrhoeal episodes, anorexia/malaise, fever, vomiting, the number of days with ≥4 liquid stools and the maximum number of depositions per 24 h period were the symptoms most strongly associated with poorer weight gain. This suggests the prioritisation of these symptoms in the formation of a severity score to characterise mild-to-moderate diarrhoea in community-based study settings.
Several symptoms of potential interest were not collected and therefore could not be included in our analysis, limiting our ability to compare our severity score with that of the 20-point Ruuska and Vesikari score,11 the 24-point instrument proposed by Clark9 or the index proposed by Ericsson and subsequently adapted by Jacobs et al.25–27 The symptoms that were not collected are those which require measurement or assessment of the child by a trained health worker, that is, rectal temperature and dehydration. Additionally, the maximum number of emesis in a 24 h period was not noted. Our final severity score, which is based exclusively on the information extracted from the verbal report of a caregiver during three time weekly visits, is similar to the Vesikari and Clark scores, with the addition of anorexia and the number of days with four or more liquid stools, and minus those components that depend on trained observation, on the level of healthcare received (outpatient, hospitalisation, etc) or on treatment decisions made by a healthcare professional during the episode (eg, intravenous rehydration therapy required yes/no) (see online supplementary table S1).
For these reasons, our score may have greater utility than existing severity indices in a variety of community-based study designs where daily clinical assessments are not realistic. However, the ability to compare our score with observations made in a clinical setting would be of methodological value,28 particularly as symptoms based on the maternal report are relatively subjective (although more severe symptoms do tend to be more reliably reported29). A severity score that includes clinical observations but could also be harmonised with a simplified version based on caregiver-reported symptoms, and/or objective measures that can be used in a community-based setting, is also desirable. The association between severity and the risk of hospitalisation should also be considered and assessed in a variety of settings,30 ,31 but because hospitalisation and treatment are dependent on access and not purely on clinical need, these are better considered as outcomes that may be associated with diarrhoeal severity rather than components of diarrhoeal severity in and of themselves.
Another limitation of our study was a relatively large number of ‘mild’ episodes with a severity score of 0, and the relatively small number of ‘severe’ episodes with a severity score of 7 or above. Many episodes were of 1 or 2 days in duration, associated with a low (three or four) number of maximum stools per 24 h period, and although they met epidemiological criteria for diarrhoea, no other signs or symptoms that might suggest systemic involvement were present. In contrast, episodes required the presence of at least three symptoms to be scored as ‘severe’ (defined here as approximately the 95th centile). These observations are consistent with the best available estimates of the proportion of categorisation in mild, moderate and severe episodes in the community setting.7 In the ‘severe’ category, there was a trend towards episodes of higher scores being associated with greater weight loss, that is, an episode of severity score 15 had a greater impact than that of severity score 8 (result not shown). However, because the number of episodes of greater severity was small, they were grouped into a single category. The estimated association between severe episodes and weight gain and linear growth is also correspondingly less precise. While other categorisations of each symptom within the overall score were considered, including categorisations that resulted in a greater proportion of episodes having higher scores, these were less strongly associated with weight gain than the one we present here.
In this index, we assess the duration of symptoms differently from previous scores. The Vesikari and Clark indices include the possibility of less than three maximum number of stools per day, which conflicts with the widely accepted definition of diarrhoea in a community-based setting as requiring a minimum of three liquid or semiliquid stools (see online supplementary table S2). We defined the bounds of an episode according to the standard epidemiological definition, and then calculated the duration of each symptom under that assumption. Instead of the episode duration being included as a separate component, it was only included indirectly, through the duration of days in which each symptom was present. We believe this is important in evaluating enteric disease caused by a range of invasive and non-invasive pathogens where the illness syndrome is diverse. In contrast, previous severity scores have been built around the ability of a symptom to discriminate between pathogens: for instance, rotavirus diarrhoea is typically associated with significant vomiting and frequent stools, but with relatively less fever, and the Vesikari index gives the purging frequency and duration a high weight accordingly.i Unfortunately, although common bacterial enteropathogens (enterotoxigenic Escherichia coli, Shigella and Campylobacter) were screened in this study,21 ,32 rotavirus was not, and so, while validation of this scoring system against the Vesikari score would be of particular interest, we are unable to do so in this study.
We also included in our score the total number of days with four or more liquid stools. The number of total liquid+semiliquid stools, and the number of days with ≥4 liquid+semiliquid stools were strongly correlated with the maximum number of stools per 24 h period, while the number of days with ≥4 liquid stools was relatively less correlated with the total or maximum number of stools and was strongly associated with poorer weight gain even after adjusting for total stools.
Dysentery, as defined by caregiver-reported or laboratory technician-reported visible blood, was not found to be a predictor of immediate episode-associated weight loss. However, it was independently predictive of poorer linear growth, a finding in agreement with other reports.33 The prevention of dysenteric diarrhoea, which is associated with progression to persistent diarrhoea23 and mortality,34 merits prioritisation. The importance of dysentery as a cause of linear growth faltering but not acute weight loss also suggests that multiple measurement tools for diarrhoeal severity may be useful. In addition to acute weight loss and linear growth, which we used here, factors such as the likelihood of further infectious disease, the risk of acute dehydration8 and the risk of mortality are important child health outcomes that should be considered in score building (figure 1).
Standardised and carefully considered measures of diarrhoeal severity are desirable in clinical trials, intervention studies and descriptive community-based studies of diarrhoea in the low-income settings,35 and would improve the understanding of the impact of disease control measures on the morbidity burden. The severity score we derived here is composed of simple components and allows for the meaningful classification of a diarrhoeal disease episode based on the most common adverse events associated with diarrhoea; depressed weight gain and poorer linear growth, an improvement over earlier scores built empirically around the symptom frequency. The collection of the input data for this score is highly feasible and are likely available in many extant datasets; further validation could improve the estimates of diarrhoea severity and disease burden across epidemiological settings.
Acknowledgments
The authors would like to thank Dr William Pan for his contribution to the data analysis and Dr Jamie Perin for her review of the manuscript. We would also like to thank Matilda Bustos Aricara, Victora Lopez Manuyama, Marla Judith Aricari Huanari and Lleny Amasifuen Llerena for their hard work and thoughtful contributions in the field, and the study families for their generosity with their time and willingness to participate.
References
Supplementary materials
Supplementary Data
This web only file has been produced by the BMJ Publishing Group from an electronic file supplied by the author(s) and has not been edited for content.
Files in this Data Supplement:
- Data supplement 1 - Online table 1
- Data supplement 2 - Online table 2
Footnotes
-
Contributors MK conceived and designed the study. MK, MPO, PPY designed the data collection tools, monitored recruitment and data collection for the study and supervised the study. PPY managed and cleaned the data. GL designed and implemented the analysis. CFW, LEC, REB and DAS provided guidance during the analysis and contributed to the interpretation of data. All the authors helped in writing and critically reviewing the article, and all the authors have approved the final version to be published and agreed to be accountable for all aspects of the work. MK and GL are the guarantors.
-
Funding This work was supported by the National Institutes of Health (K01-TW05717 to MK). GL was supported by a National Institutes of Health International Maternal and Child Health Training Grant (T32HD046405) (PI Dr Joanne Katz) and a Proctor and Gamble Doctoral Dissertation Fellowship, awarded by the Johns Hopkins Bloomberg School of Public Health.
-
Competing interests None.
-
Ethics approval This study was approved by the Institutional Review boards of the Johns Hopkins Bloomberg School of Public Health, Baltimore, MD (IRB H.22.01.01.02.A), the US Naval Medical Research Center, Silver Springs, MD (IRB NMRCD.2002.0009), and Asociaciόn Benéfica PRISMA, Lima, Peru (no IRB number). All participating families gave signed, informed consent before taking part in the study.
-
Provenance and peer review Not commissioned; externally peer reviewed.
-
Data sharing statement Raw data used in the analysis are available on request from the corresponding author at mkosek@jhsph.edu. The statistical code is also available on request.
-
↵i With a maximum of six points related to vomiting and a maximum of three related to fever.