Article Text

Abstract
Objectives To explore whether service configuration and obstetric unit (OU) characteristics explain variation in OU intervention rates in ‘low-risk’ women.
Design Ecological study using funnel plots to explore unit-level variations in adjusted intervention rates and simple linear regression, stratified by parity, to investigate possible associations between unit characteristics/configuration and adjusted intervention rates in planned OU births. Characteristics considered: OU size, presence of an alongside midwifery unit (AMU), proportion of births in the National Health Service (NHS) trust planned in midwifery units or at home and midwifery ‘under’ staffing.
Setting 36 OUs in England.
Participants ‘Low-risk’ women with a ‘term’ pregnancy planning vaginal birth in a stratified, random sample of 36 OUs.
Main outcome measures Adjusted rates of intrapartum caesarean section, instrumental delivery and two composite measures capturing birth without intervention (‘straightforward’ and ‘normal’ birth).
Results Funnel plots showed unexplained variation in adjusted intervention rates. In NHS trusts where proportionately more non-OU births were planned, adjusted intrapartum caesarean section rates in the planned OU births were significantly higher (nulliparous: R2=31.8%, coefficient=0.31, p=0.02; multiparous: R2=43.2%, coefficient=0.23, p=0.01), and for multiparous women, rates of ‘straightforward’ (R2=26.3%, coefficient=−0.22, p=0.01) and ‘normal’ birth (R2=17.5%, coefficient=0.24, p=0.01) were lower. The size of the OU (number of births), midwifery ‘under’ staffing levels (the proportion of shifts where there were more women than midwives) and the presence of an AMU were associated with significant variation in some interventions.
Conclusions Trusts with greater provision of non-OU intrapartum care may have higher intervention rates in planned ‘low-risk’ OU births, but at a trust level this is likely to be more than offset by lower intervention rates in planned non-OU births. Further research using high quality data on unit characteristics and outcomes in a larger sample of OUs and trusts is required.
- Obstetrics
This is an Open Access article distributed in accordance with the Creative Commons Attribution Non Commercial (CC BY-NC 4.0) license, which permits others to distribute, remix, adapt, build upon this work non-commercially, and license their derivative works on different terms, provided the original work is properly cited and the use is non-commercial. See: http://creativecommons.org/licenses/by-nc/4.0/
Statistics from Altmetric.com
Strengths and limitations of this study
-
The study used high quality data on maternal characteristics and outcomes (interventions) collected in a nationally representative sample of obstetric units (OUs).
-
OU intervention rates were evaluated only in planned OU births, so the rates are unaffected by women with complications transferring into the OU during labour from non-OU settings.
-
Supplementary data collected in the Birthplace research programme were used to generate unit-level variables on midwifery staffing, presence of an attached alongside midwifery unit and percentage of planned non-OU births which are not routinely available.
-
Limitations: exploratory association study using ecological design; inter-relationships between potential explanatory variables were not explored; confirmation in a larger dataset is required.
Introduction
In England, most births, 87% in 2012,1 take place in obstetric units (OUs) but healthy women with straightforward pregnancies may be offered the option of planning birth at home or in a midwifery unit. Midwifery units may be either alongside midwifery units (AMUs), on the same site as an OU, or free-standing midwifery units (FMUs), on a separate site. There is considerable geographical variation in service provision, and the proportion of births planned in midwifery units or at home varies from area to area.2
Overall rates of medical intervention during labour and childbirth are increasing in many countries, although levelling off in some.3–5 In England, there is a policy of offering low-risk women a choice of birth setting, including midwifery-led settings which are associated with lower rates of intervention compared with OUs.6 ,7 Information about intervention rates in individual maternity units is available online to inform women's decision-making about place of birth,8 ,9 and has also been proposed as a basis for quality indicators, with the recognition that it is important to understand potential sources of variation in these rates.10
The maternal characteristics and clinical risk factors of women planning birth differ between hospitals and can affect intervention rates, but these factors alone explain only a small part of the wide variation between OUs’ intervention rates in England.10–12 Studies exploring the impact of organisational factors, including obstetric and midwifery staffing,13 unit size and the level of specialist care available,14–16 on intervention rates during labour and birth have shown inconclusive or mixed results and there is little evidence from the UK.
Recent years have seen changes in the configuration of care. There has been a move towards fewer, larger OUs17 with the expectation that the increased consultant presence possible in larger units will improve quality and safety1; the proportion of OUs in England with an attached AMU has increased, from 30% in 2010 to 53% in 20131 ,2; and there has been an increase in the proportion of births in midwifery units, from 4% in 2006/2007 to 11% in 2012.1 However, little appears to be known about the possible effects of the configuration of care on intervention rates either at a trust level or in individual units. It is plausible, for example, that more women opting for non-OU births might change the casemix of women giving birth in OUs, possibly resulting in a ‘higher risk culture’ developing in OUs. Alternatively, National Health Service (NHS) trusts offering more midwifery-led birth options could be those with a culture of promoting ‘normal’ birth in all maternity settings.
Midwifery staffing levels (midwives per birth) have been increasing since 2008, but there are currently fewer midwives per birth than a decade ago.1 A recent national survey found that 63% of trusts had fewer midwives per birth than the recommended minimum level, and only 78% of maternity units reported that they were achieving one-to-one care in labour 90% of the time.1 Higher midwifery staffing levels are believed to improve outcomes and possibly reduce interventions, but the existing evidence is limited.18
This study aimed to explore the extent to which configuration of care and unit characteristics may explain variation in unit intervention rates in ‘low-risk’ women in all planned birth settings (OUs, midwifery units and home). This paper focuses on intervention rates, including rates of ‘normal’ birth and ‘straightforward’ birth, in births to ‘low-risk’ women planned to take place in OUs.
Methods
Data and sources
Maternal characteristics, interventions and outcomes
Data on maternal characteristics, interventions and outcomes came from the Birthplace national prospective cohort study. The cohort study methods are described in full elsewhere.6 ,19 Data were collected between 1 April 2008 and 30 April 2010 in 142 (97%) of the 147 NHS trusts supporting home birth, in 53 (95%) of the 56 FMUs, in 43 (84%) of the 51 AMUs and in a stratified random sample of 36 OUs. The random sample of OUs was stratified by unit size (<2600; 2600–4850 and >4850 births/year) and geographic location (northern or southern England) and was sampled so that each OU in England had approximately the same probability of selection.
Data were collected by midwives attending the birth. Births to all women attended by an NHS midwife during labour in their planned place of birth, for any amount of time, were eligible for inclusion in the cohort. Women who had a caesarean section before labour, who presented in preterm labour (<37 weeks gestation), had a multiple pregnancy or who received no antenatal care were excluded, as were women who had a stillbirth before the start of care in labour. In total, the cohort included 79 774 births, including 18 269 planned at home, 11 666 planned in FMUs, 17 582 planned in AMUs and 32 257 planned in OUs.
Women were classified as ‘low-risk’ if, before the start of labour, they were not known to have any of the medical or obstetric risk factors listed in national intrapartum care guidelines in England and Wales as “indicating increased risk suggesting planned birth in an obstetric unit.”20 Otherwise, women were classified as ‘higher risk’.
The main study population for the analyses reported here was ‘low-risk’ women with a term pregnancy (37–42+0 weeks gestation) planning a vaginal birth in an OU.
Unit and configuration of care characteristics
We used the following sources of data to derive variables on configuration of care and unit characteristics:
-
Birthplace research programme sources:
-
Monthly logs recording the number of births planned in each unit (or trust for home births) during data collection for the cohort study.
-
Data on openings and closures of maternity units collected from all NHS trusts participating in the cohort study.
-
Staffing and activity logs completed twice daily by midwives during data collection for the cohort study.
-
Office for National Statistics (ONS) data on numbers of women delivering by establishment for 2009/2010 (provided under license by BirthChoiceUK8).
Using the methods described below, we derived the following variables to describe units and configuration of care and considered these as factors which might be associated with the study outcomes:
Size of the OU (number of births)
We used ONS data to derive the number of births per year in each hospital. Where there was an AMU in the same hospital as the OU, these data included births in both settings. Using Birthplace monthly logs of planned births in each unit and cohort study data on transfers, we estimated the annual number of births in each AMU and subtracted this from the total number of births in the hospital to estimate the number of births in the OU. In one AMU, the available data were insufficient to enable us to estimate the number of births in the associated OU.
Number of delivery beds or bed spaces in the OU
We used data from the 2010 mapping survey on the number of delivery beds or ‘bed spaces’ in the unit on 31 March 2010.2 For units which did not respond to the 2010 survey, we used data from the 2007 Healthcare Commission Maternity Care Review survey.21 Data on the number of delivery beds were available from one of these sources for all 36 OUs in the sample.
Presence of an AMU in the hospital
An OU was defined as having an AMU if the associated AMU was open for the whole of the period when cohort study data for the OU were being collected. One OU was excluded from these analyses because its associated AMU was open for only part of this period.
Proportion of births in the NHS trust planned outside an OU (ie, in an AMU, FMU or at home) and ‘out of hospital’ (ie, in an FMU or at home)
We used Birthplace monthly logs of planned births in units and at home to calculate the number of births planned to take place outside of an OU and ‘out of hospital’ in each NHS trust. The total number of births in the NHS trust was calculated by summing ONS data on maternities in 2009/2010 for each of the maternity units in the trust (OU, AMU or FMU) and adding to this the estimated annual number of planned home births in the trust (from Birthplace data). Unplanned home births were excluded from the numerator and denominator when calculating proportions. For six OUs, it was not possible to calculate the proportion of non-OU and ‘out of hospital’ births because insufficient data were available to estimate the annual number of planned FMU births (four trusts) or home births (two trusts).
Midwifery ‘under’ staffing
We used data from Birthplace staffing logs to estimate the proportion of shifts where the total number of women in the delivery suite or labour ward exceeded the number of midwives on duty as a measure of midwifery staffing. Staffing data were available for 30 of the OUs.
Outcome measures
The four main ‘outcome measures’ considered for these analyses were the adjusted OU rates of intrapartum caesarean section and instrumental delivery (forceps or ventouse) and rates of two composite indicators of low medical intervention: ‘straightforward’ birth (defined as birth without forceps or ventouse, intrapartum caesarean section, third or fourth degree perineal trauma or blood transfusion) and ‘normal’ birth (defined as birth without induction of labour, epidural or spinal analgesia, general anaesthetic, forceps or ventouse, caesarean section or episiotomy).22 Rates were adjusted for maternal characteristics: maternal age, ethnicity, English language fluency, marital status, Index of Multiple Deprivation (IMD) quintile,23 body mass index and gestational age, and for the presence of one or more of the following complicating conditions identified at the start of care in labour: prolonged rupture of membranes >18 h, meconium-stained liquor, proteinuria 1+ or more, hypertension, abnormal vaginal bleeding, non-cephalic presentation, abnormal fetal heart rate.
Statistical methods
Adjusted unit-level event rates were calculated using an indirect standardisation procedure.10 ,24 Briefly, for each outcome, a multiple logistic regression model was used to estimate the probability of a woman planning to give birth in the OU having had the outcome on the basis of her demographic and clinical characteristics (listed in the preceding section). These probabilities were then summed to give the OU's predicted rate for each outcome. Adjusted rates for planned births in each OU were calculated by dividing the OU's (observed) unadjusted rate by its predicted (‘expected’) rate, and multiplying this by the average rate across all OUs in the sample (weighed to take account of the duration of participation of the OUs and their probability of selection in the Birthplace cohort).
We plotted the adjusted event rates against the number of women in the sample on funnel plots with 95% and 99.8% control limits.24 The control limits, which represent approximately 2 and 3 standard deviations, respectively, around the event rate, were used to assess whether there was more variation in the study outcomes between units than might be expected by chance, given the differences in maternal characteristics.24
Simple linear regression was used to investigate whether unit characteristics were associated with variations in the study outcomes (the adjusted event rates). The adjusted event rates were regressed on each of the unit characteristics in turn. Robust SEs were used to take account of non-constant variance among the outcome rates with increases in some of the unit characteristics (heteroscedasticity). All analyses were stratified by parity and significance was determined by using two-sided p values at p<0.05. We used Stata V.12 for all analyses.25
Further exploratory analyses
We carried out a series of post hoc analyses to further explore some of the associations found in the main analyses. First, because of their possible association with other interventions, we carried out additional analyses of rates of augmentation and epidural use. Second, we explored whether the proportion of planned births in a unit that were ‘higher risk’ (estimated from the Birthplace cohort) had an impact on intervention rates in planned ‘low-risk’ births. Finally, we investigated whether intervention rates were correlated in ‘low-risk’ and ‘higher risk’ women within the same OU. Pearson's correlation coefficients were used to describe the strength of association between rates, and p values were calculated after verifying approximate Gaussian distributions of the variables.
Results
Characteristics of the units
The 36 OUs included in this study varied in size, as measured by the number of births per year and number of delivery beds (table 1). Nine OUs had an associated AMU in the same hospital. In line with the national figures, a relatively small proportion of births were planned to take place outside OUs and ‘out of hospital’ but with some variation between trusts.
Characteristics of OUs
Variation in intervention rates between units
For all study outcomes, funnel plots showed that there was more variation in rates than would be expected by chance alone, even after adjustment for maternal characteristics (figure 1).
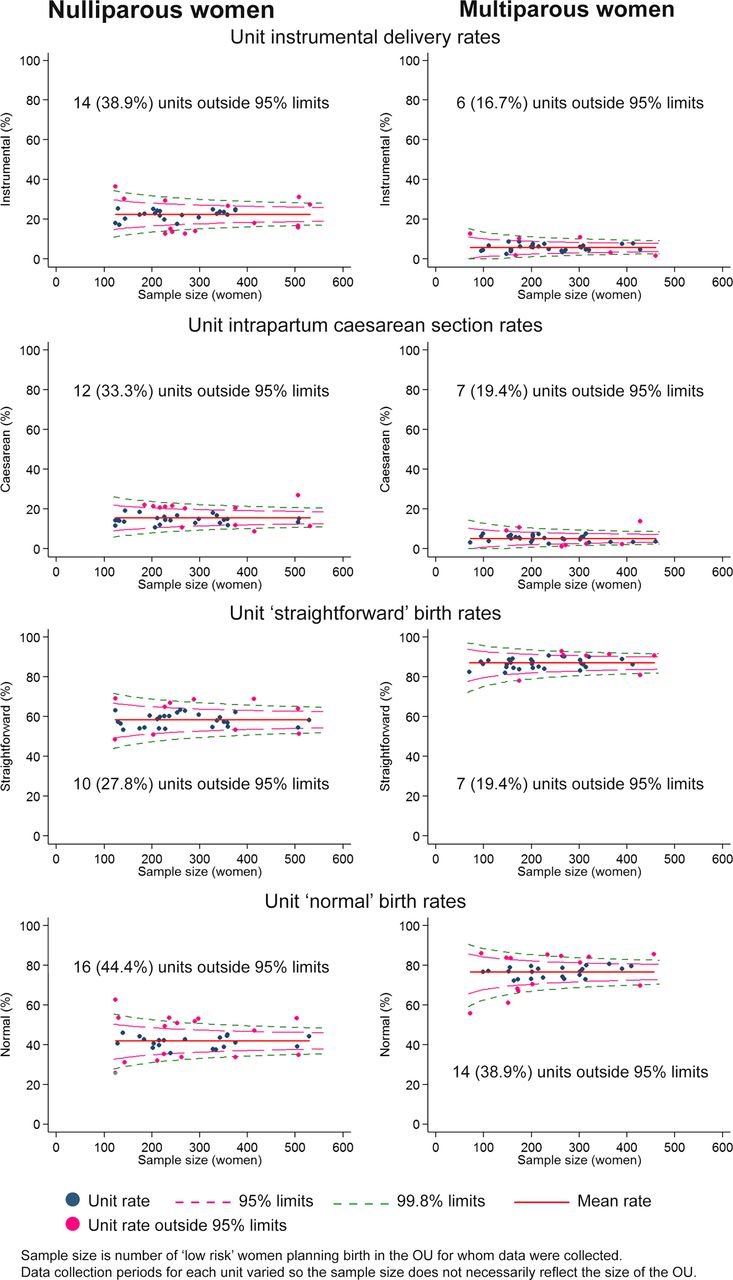
Funnel plots showing obstetric unit (OU) intervention rates adjusted for maternal characteristics.
Configuration, unit characteristics and intervention rates
There was no significant association between the number of OU delivery beds or the percentage of births in the trust that were planned ‘out of hospital’ and any of the main outcome measures studied (table 2).
Association between configuration, unit characteristics and adjusted intervention rates in low-risk women in OUs
There was a significant association between the OU size (number of births) and the intrapartum caesarean section rate in planned OU births; larger OUs had lower caesarean section rates in nulliparous and multiparous women. Larger OUs also had a significantly higher ‘straightforward’ birth rate in multiparous women.
For nulliparous women, there was a significant association between our measure of midwifery staffing and the intrapartum caesarean rate in planned OU births with lower caesarean section rates observed in planned ‘low-risk‘ births in OUs with lower staffing levels. For multiparous women, rates of ‘straightforward’ birth were significantly higher in units with lower levels of staffing.
There were significant associations between the proportion of births that were planned outside the OU and three of the four main outcome measures: the proportion of non-OU births was significantly positively associated with the OU intrapartum caesarean section rate for nulliparous and multiparous women, and significantly negatively associated with rates of ‘straightforward’ and ‘normal’ birth in multiparous women. For nulliparous women, the proportion of non-OU births was not significantly associated with the rates of ‘straightforward’ birth and ‘normal’ birth (p=0.06 and 0.08, respectively), but the direction of effect was the same as that seen for multiparous women.
For ‘low-risk’ women planning OU birth, having an AMU in the hospital was also associated with a significantly higher intrapartum caesarean section rate in nulliparous women and significantly lower rates of ‘normal’ birth and ‘straightforward’ birth in multiparous women. These analyses were based on planned ‘low-risk’ births in the OU, so women who gave birth in the unit following an intrapartum transfer from an attached AMU or elsewhere did not contribute to the rates.
None of the configuration or unit characteristics studied showed any association with rates of instrumental delivery in planned OU births.
Visual examination of scatter plots for the predictor and outcome variables that were significantly associated (see online supplementary figures) did not suggest that the associations were driven by regression outliers.
Further exploratory analyses of intervention rates
In order to explore potential explanations for the association between the proportion of non-OU births in a trust and higher intervention rates in OUs, we carried out a number of further analyses. First, we explored whether epidural and augmentation rates followed the same pattern of associations as the main outcomes; second, we explored whether a higher proportion of planned non-OU births in a trust tended to increase the proportion of ‘higher risk’ births in the OU; third, we explored whether the proportion of planned births that were ‘higher risk’ in an OU was associated with our main outcomes in ‘low-risk’ women; and finally, we explored whether intervention rates in ‘low-risk’ and ‘higher risk’ women within the same OU were correlated.
None of the configuration or unit characteristic variables were significantly associated with the adjusted epidural rate. For ‘low-risk’ nulliparous women planning birth in an OU, there was a significant negative association between the proportion of planned ‘out of hospital’ births and the augmentation rate, and a non-significant positive association (p=0.05) between the presence of an AMU and the augmentation rate. For multiparous women, there was a significant association between midwifery staffing and the augmentation rate. Lower staffing levels were associated with higher augmentation rates (table 3).
Association between configuration, unit characteristics and secondary outcome measures
We found no significant association between the proportion of planned non-OU births in each trust and the proportion of planned OU births that were classified as ‘higher risk’ according to the National Institute for Health and Care Excellence (NICE) criteria20 (data not shown). Furthermore, there was no consistent relationship between the proportion of women planning OU birth who were ‘higher risk’ and our four main outcome measures in ‘low-risk’ women. Exploration of intervention rates in ‘low-risk’ and ‘higher risk’ women planning birth in the same OU revealed significant positive correlations for most interventions and strong positive correlations for epidural analgesia, instrumental delivery (nulliparous women) and ‘straightforward’ birth (nulliparous women); intrapartum caesarean section rates in ‘low-risk’ and ‘higher risk’ women were less strongly correlated, particularly for nulliparous women (Pearson correlation (r)=0.327, p=0.05 in nulliparous women; r=0.515, p=0.001 in multiparous women).
Discussion
In a cohort of ‘low-risk’ women planning birth in English OUs, we found considerably greater variation in intervention rates than would be expected by chance and this was not explained by known differences in maternal characteristics. The proportion of births in the trust that were planned outside an OU (ie, in an AMU, FMU or at home) was significantly associated with higher intervention rates in planned OU births in ‘low-risk’ women and in particular with higher rates of intrapartum caesarean section in nulliparous and multiparous women. The size of the OU (number of births), midwifery ‘under’ staffing (the proportion of shifts where there were more women than midwives) and the presence of an AMU were also associated with significant variation in rates of some interventions in planned OU births in ‘low-risk’ women, but the lack of a consistent significant effect across multiple outcomes means that we cannot rule out the possibility that these were chance findings.
The study was based on high quality data collected in a representative, stratified random sample of OUs that participated in a national prospective cohort study of planned place of birth. A strength was that we were able to evaluate intervention rates in a homogeneous cohort of ‘low-risk’ women and to adjust for important maternal characteristics. A further strength was that the analysis was based on planned OU births, and thus intervention rates were unaffected by the inclusion of intrapartum transfers. Thus, our finding that the proportion of planned non-OU births in a trust is associated with an increase in interventions in the planned ‘low-risk’ OU births does not simply reflect an increase due to more intrapartum transfers of women with complications transferred into the unit from other settings. A limitation that probably applies to all research in this area is the extremely limited availability of data on the characteristics of maternity units in England. We assembled data on the characteristics of the included OUs from a variety of sources, but were only able to evaluate a limited range of unit characteristics based on data that were sometimes of uncertain quality and validity. For example, we were unable to take account of the dependency levels of women on the delivery ward when calculating our midwifery staffing indicator. The small number of OUs in the sample was also a limitation and many of our findings need to be replicated in a larger sample of units. Because our analysis involved multiple testing, our interpretation focuses on factors which showed consistency of effect across a number of outcomes.
In general, the institutional factors affecting intervention rates are poorly understood. Previous studies have found some association between junior doctor staffing levels and intervention rates,13 and mixed or inconclusive results on the relationship between unit size or the level of neonatal care available and intervention rates.14–16 Studies in France and Australia suggest that smaller units may have lower rates of some interventions, but in these studies, smaller units differed from larger units in other ways including, for example, the level of obstetric and neonatal care available and rurality.14 ,26 Our findings confirm that variations in intervention rates are not fully explained by the sociodemographic or clinical characteristics of women planning to give birth.10–12 While we did observe significant associations between OU size and midwifery staffing and some intervention rates, our results do not suggest that there is a straightforward or clear relationship between these factors13 ,14 and intervention rates, at least within the ranges observed within our sample. Our further exploratory analyses showed strong positive associations between intervention rates in ‘low-risk’ and ‘higher risk’ women planning birth in the same OU, which suggests that intervention rates may be affected by some institutional level factor, an ‘interventionist culture’, for example, or simply that the same influences on intervention rates apply to all births in any given setting.
We did find that some variation in intervention rates may be explained by configuration of care: specifically that intervention rates in planned ‘low-risk’ OU births tend to be higher in OUs situated in trusts where a higher proportion of women planned birth in a non-OU setting (home, FMU or AMU). There are a number of possible explanations for this finding. Unit intervention rates are readily available online,8 and it is possible that in NHS trusts where the OU is known to have a high intervention rate, a higher proportion of ‘low-risk’ women may choose to plan birth in a non-OU setting in order to avoid unwanted interventions, but we lack the evidence to confirm or refute this. Another possibility is that a higher proportion of ‘low-risk’ births being planned in non-OU settings might result in a higher proportion of the women planning birth in the OU being, or perceived to be,27 ‘higher risk’, possibly resulting in a more ‘medicalised’ approach to birth for women in the unit. However, we found no significant association between the proportion of planned non-OU births in the trust and the proportion of planned OU births that were classified as ‘higher risk’. Nor did we find a consistent relationship between the proportion of women planning OU birth who were ‘higher risk’ and intervention rates, suggesting that OUs with more ‘higher risk’ births did not necessarily exhibit an ‘interventionist culture’. Another possible explanation is selection bias, whereby the women opting for a non-OU birth might be those most keen to have a ‘normal birth’ without medical intervention, resulting in the planned OU group being less ‘intervention averse’. Other studies provide some support for this hypothesis. Women who opt for a hospital birth rather than a home birth in the Netherlands have been found to be more receptive towards intervention,28 and one UK study found that willingness to accept intervention was a significant predictor of operative or instrumental birth.29 Finally, there is evidence to suggest that midwives working in units with high intervention rates tend to have a higher perception of risk.30
The vast majority of births take place in OUs,1 ,6 and in our sample only six OUs (19%) were situated in trusts where more than 10% of births were planned in a non-OU setting, with considerably lower levels of non-OU births in most trusts. The Birthplace cohort study6 ,19 and a systematic review of trials of alternative settings for birth7 found a substantially reduced risk of intervention in births planned in non-OU settings. We lacked the data to examine intervention rates at a trust level, but the increase in interventions observed in ‘low-risk’ planned OU births in trusts with more non-OU births was relatively small in comparison, suggesting that any increase would be more than offset by the reduction in interventions in the ‘low-risk’ planned non-OU births. This needs to be verified using data on trust level variations in intervention rates.
Conclusion
This exploratory analysis of ‘low-risk’ planned OU births suggests that the level of provision of midwifery-led intrapartum care within a trust, and possibly the size of an OU and OU midwifery staffing levels, may explain some of the variation in OU intervention rates. Trusts with greater provision of non-OU intrapartum care may be more likely to have higher intervention rates in their planned ‘low-risk’ OU births, but the magnitude of this is likely to be small and, at a trust level, more than offset by the lower levels of intervention in the births planned in AMUs, FMUs and at home. Further research using high-quality data on service configuration, unit characteristics and interventions and other outcomes in ‘low-risk’ women in a larger sample of units and trusts is required to confirm these findings, and some research in this area using national data is ongoing.31 Qualitative research may also be required to explore the mechanisms involved. Further research is also required to explore the possible effects of unit ‘culture’ and women's attitudes and expectations on intervention rates, and to consider the impact of working in different birth settings on midwives’ attitudes, skills and confidence in relation to normal birth.
Acknowledgments
Louise Linsell, senior statistician at the National Perinatal Epidemiology Unit, University of Oxford, is a coinvestigator for the programme of work of which this study forms a part and contributed to the development of the research questions and protocol for that programme of work. Miranda Dodwell from BirthChoiceUK shared data on the number of births per year in maternity units derived from the Office for National Statistics data on deliveries by establishment 2009/2010 (ONS data licensed under the Open Government Licence V.1.0).
References
Supplementary materials
Supplementary Data
This web only file has been produced by the BMJ Publishing Group from an electronic file supplied by the author(s) and has not been edited for content.
Files in this Data Supplement:
- Data supplement 1 - Online supplement
Footnotes
-
Contributors This study is part of a programme of work, the research questions and protocol for which were developed by a coinvestigator group including JH, RER, PB, MK, AM, CM, MN, MR, JS and LS. JH and RER conceived and developed the outline for this study. JH, JT and RER developed the analysis plan. JT conducted the analysis. RER and JH drafted the manuscript with input from all authors. All authors were involved in interpretation of data, review and revision of the draft manuscript and approval of the final version.
-
Funding This project was funded by the National Institute for Health Research (NIHR) Health Services and Delivery Research (HS&DR) Programme (project number 10/1008/43). The views and opinions expressed therein are those of the authors and do not necessarily reflect those of the HS&DR Programme, NIHR, NHS or the Department of Health.
-
Competing interests None.
-
Ethics approval Approval for the Birthplace prospective cohort study was obtained from the Berkshire Research Ethics Committee (MREC ref 07/H0505/151).
-
Provenance and peer review Not commissioned; externally peer reviewed.
-
Data sharing statement No additional data are available.