Article Text

Abstract
Objectives To determine the diabetes screening levels and known glycaemic status of all individuals by age, gender and ethnicity within a defined geographic location in a timely and consistent way to potentially facilitate systematic disease prevention and management.
Design Retrospective observational study.
Setting Auckland region of New Zealand.
Participants 1 475 347 people who had utilised publicly funded health service in New Zealand and domicile in the Auckland region of New Zealand in 2010. The health service utilisation population was individually linked to a comprehensive regional laboratory repository dating back to 2004.
Outcome measures The two outcomes measures were glycaemia-related blood testing coverage (glycated haemoglobin (HbA1c), fasting and random glucose and glucose tolerance tests), and the proportions and number of people with known dysglycaemia in 2010 using modified American Diabetes Association (ADA) and WHO criteria.
Results Within the health service utilisation population, 792 560 people had had at least one glucose or HbA1c blood test in the previous 5.5 years. Overall, 81% of males (n=198 086) and 87% of females (n=128 982) in the recommended age groups for diabetes screening had a blood test to assess their glycaemic status. The estimated age-standardised prevalence of dysglycaemia was highest in people of Pacific Island ethnicity at 11.4% (95% CI 11.2% to 11.5%) for males and 11.6% (11.4% to 11.8%) for females, followed closely by people of Indian ethnicity at 10.8% (10.6% to 11.1%) and 9.3% (9.1% to 9.6%), respectively. Among the indigenous Maori population, the prevalence was 8.2% (7.9% to 8.4%) and 7% (6.8% to 7.2%), while for ‘Others’ (mainly Europeans) it was 3% (3% to 3.1%) and 2.2% (2.1% to 2.2%), respectively.
Conclusions We have demonstrated that the data linkage between a laboratory repository and national administrative datasets has the potential to provide a systematic and consistent individual level clinical information that is relevant to medical auditing for a large geographically defined population.
- Epidemiology
This is an Open Access article distributed in accordance with the Creative Commons Attribution Non Commercial (CC BY-NC 3.0) license, which permits others to distribute, remix, adapt, build upon this work non-commercially, and license their derivative works on different terms, provided the original work is properly cited and the use is non-commercial. See: http://creativecommons.org/licenses/by-nc/3.0/
Statistics from Altmetric.com
Strengths and limitations of the study
-
This study applied a method that aims to address the common systematic biases seen in many population diabetes prevalence studies such as incomplete coverage of the population at risk, inconsistency in the definition of diabetes, selection and patient recall bias, measurement errors and misdiagnosis.
-
The definition of dysglycaemia included people with confirmed diabetes as well as people who required follow-up tests to confirm the formal diagnosis of diabetes.
-
The study did not have information related to patients’ symptoms or the ability to differentiate types 1 and 2 diabetes.
Introduction
The number of people with diabetes increased globally by almost 200 million from 1980 to 2008.1 In the context of a potential ‘diabetes epidemic’, an accurate and timely measure of diabetes prevalence is critical to inform policy making, resource allocation and planning and implementation of interventions to improve the quality of care for people with diabetes. Moreover, a consistent and systematic way to identify individuals for diabetes screening, follow-up and management is necessary to ensure that people with diabetes receive the most appropriate care. Indeed, randomised controlled trials have demonstrated that the use of electronic patient registers, patient reminders or clinician reminders is associated with quality improvement in diabetes management.2 However, the limitations of existing methods to identify populations with diabetes include incomplete coverage of the population at risk, inconsistency in the definition of diabetes, selection and patient recall bias, measurement errors, misdiagnosis, lack of precision by age, gender or ethnicity and inadequate adjustments for migrations or deaths.1 ,3–6
Auckland (New Zealand) has an ethnically diverse population of over 1.4 million people. The aim of this study is to use laboratory results (between 1 January 2004 and 30 June 2010) from a regional laboratory repository to estimate glycaemia test coverage and glycaemic status in a geographical defined population in 2010. This study proposes a set of methods that utilises ‘real-world’ routinely collected data in a practical manner that has the potential to provide critical and succinct information for the responsible clinicians that is robust enough at the individual level for quality improvement as well as estimates at the aggregated population level.
Methods
Date sources
TestSafe is a comprehensive data repository containing all the community and hospital laboratory test results requested in the Auckland metropolitan region in New Zealand since July 2006. Individual patient laboratory tests can be requested by general practitioners, privately or publicly funded specialists, resident medical staff or other allied health workers. Prior to July 2006, only hospital test results and community results that were sent to secondary care clinicians were recorded in the data repository. Fasting glucose, random glucose, 2 h postglucose load values (standard 75 g oral glucose tolerance test) and glycated haemoglobin (HbA1c) results from 1 January 2004 to 30 June 2010 were sourced from the TestSafe repository. The following routine administrative datasets were sourced from the Analytical Services team within the National Health Board of the Ministry of Health (MOH) (formerly known as the New Zealand Health Information service (NZHIS)):
-
National Minimum Dataset (hospital events; NMDS)
-
National Non-admitted Patient Collection (outpatients and community visits; NNPAC)
-
Pharmaceutical Collection (PHARMHOUSE)
-
Laboratory Claims Collection (note: does not include test results)
-
Primary Health Organisation (PHO) Enrolment Collection
-
General Medical Subsidy Data Mart
-
National Mortality Collection
-
National Immunisation Register.
Data linkage
Virtually all health service users in New Zealand are assigned a unique identifier called the National Health Index (NHI). The NHI coverage is estimated to be 98% of the New Zealand population.7 Additional information regarding the purpose and the use of NHI is available on the New Zealand MOH website.8 All NHIs used in this study were encrypted to protect the privacy and confidentiality of health information. Record linkage of various data sources was carried out using encrypted NHIs.
Inclusion criteria of the study
The linkage of the available administrative datasets by unique encrypted NHI was undertaken to derive the ‘health service utilisation (HSU) population.’ This was defined as New Zealand residents who resided within the boundaries of the three District Health Boards located in the Auckland metropolitan region and received any of the publicly-funded health services in New Zealand between 1 July 2009 and 30 June 2010, namely:
-
Currently enrolled in a PHO or people who had a health service contact with a PHO;
-
Publicly funded inpatient and outpatient secondary care events (including mental health and emergency department contact);
-
Any community pharmaceutical dispensing;
-
Any community laboratory test (including outside the Auckland metropolitan region) including the ones requested by privately funded health professionals;
-
Any immunisation received as indicated by the national immunisation register.
Deceased individuals were excluded from the HSU population using the National Mortality Collection. In New Zealand, PHOs supply general practitioner services and are publicly funded, receiving a capitation payment for each enrollee. PHOs are required to provide a defined set of essential services which include appropriate evidence-based screening, risk assessment and the use of recall and reminder systems.9
Numerator 1: glycaemic status test coverage
The glycaemic status test coverage by age and ethnicity was estimated as the proportion of the HSU population who had at least one glucose or HbA1c blood test recorded in TestSafe repository from 1 January 2004 to 30 June 2010. Laboratory tests with missing results or results with <1 mmol/L for glucose test, or <1% (<0 mmol/mol) of HbA1c were excluded.
Definition of dysglycaemia
The definition of diabetes recommended by the American Diabetes Association in 2010 and the WHO consultation in 2011 was modified for this ‘real-world’ study,10 ,11 and termed ‘dysglycaemia’. The operational definition of this study was to identify a cohort of people with abnormalities of glucose metabolism, who are at high risk of cardiovascular complications rather than only the people who had a confirmed diagnosis of diabetes. This defined cohort should be followed up by the healthcare system for ongoing clinical support and management. The dysglycaemic status was derived directly from the laboratory results recorded in a TestSafe laboratory repository for each person in the HSU population. Duplicated test results with identical laboratory numbers for the same person were removed. A person was defined to have dysglycaemia if they had:
-
at least one HbA1c test ≥6.5% (equivalent to 48 mmol/mol) or
-
at least one 2 hour postglucose load ≥ 11.1 mmol/L on a glucose tolerance test (GTT)
-
two or more tests of random glucose ≥11.1 mmol/L and/or fasting glucose ≥7.0 mmol/L on a different day.
For young children less than 10 years of age in 2010, hospital requested glucose tests were not examined because high glucose results in hospitals for young children are more likely to relate to artificial nutritional feeds or parenteral nutrition than to diabetes.
Comparison to hospital diagnosis
People within the HSU population who had a previous hospitalisation with a primary or secondary diagnosis of diabetes from 1 July 1999 to 30 June 2010 in New Zealand were identified by (International Classification of Diseases (ICD) 10 codes Edition 3 E10-E14, and O240-O243). The hospital diagnoses were compared with the laboratory diagnosis of dysglycaemia as defined by this study.
Demographic variables
The dysglycaemic status for each person within the HSU population was determined by the blood test results. The demographic variables including adjustment for migration and deaths were carried out in an identical way for both the numerator (people who had at least one glucose or HbA1c blood test or people with dysglycaemia) and denominator (HSU population which includes people with dysglycaemia or diabetes). Ethnicity was determined as per ethnicity data protocols published by the New Zealand MOH using the prioritised method.12 Age was calculated from date of birth with reference to 1 January 2010.
Age standardisation
The prevalence proportions were separated into 5-year age groups from <15 to ≥85 for direct age standardisation using the WHO World population as the standard13; 95% CIs are presented.
Results
There were 1 475 347 people living in the Auckland metropolitan region as defined by the HSU population in June 2010. The estimated population of the three Auckland metropolitan District Health Boards from Statistics New Zealand in June 2010 was 1 477 600.14 A total of 4 281 599 glucose and HbA1c blood tests were analysed from 792 588 people who had at least one glycaemia-related blood test in the study period. There were 1 458 350 tests performed in laboratories based in hospitals (34% of the total) and 2 823 249 tests performed by community laboratories (66%). There were 38 people who had a glycaemia-related blood test but did not have a gender recorded, and all had age recorded. The proportions of people receiving at least one glucose or HbA1c blood test by age, gender and ethnicity are shown in tables 1 and 2. The age groups highlighted in yellow are the recommended age ranges for diabetes screening as per New Zealand Cardiovascular Guidelines.15
Proportion of males receiving a glycaemia-related blood test in the Auckland metropolitan region in 2010
Proportion of females receiving a glycaemia-related blood test in the Auckland metropolitan region in 2010
The test coverage varies by age, gender and ethnicity. Overall, 81% of males (n=198 086) and 87% of females (n=128 983) in the recommended age groups for diabetes screening had a glycaemia-related blood test recorded at the regional laboratory repository from 1 January 2004 to 30 June 2010. There were a total of 78 828 people with dysglycaemia as defined by this study living in the Auckland metropolitan region in 2010 identified by the laboratory results. Crude prevalence was 5.3% overall (with 5.7% males, 5% females). Pacific and Indian ethnicities had the highest age standardised prevalence in the Auckland metropolitan region. There were 31 282 people in the HSU population who had been discharged from hospital in New Zealand with a discharge diagnosis of diabetes between 1 July 2000 and 30 June 2010. Of these people, 91% (n=28 489) also had laboratory results consistent with dysglycaemia as defined by this study.
Discussion
This study estimated the prevalence of dysglycaemia in a consistent manner within a geographically defined population of over 1.4 million by age, gender and ethnicity based on laboratory results sourced from a comprehensive regional laboratory repository (figures 1 and 2). If the data linkage methodology used in this study were implemented in a live electronic population register, one could potentially identify individuals who were yet to be screened for diabetes and people who would probably benefit from intensive ongoing clinical follow-up and management of the cardiovascular risk factors and complications associated with hyperglycaemia in a consistent, comprehensive and timely way. We have demonstrated that glycaemia-related blood testing coverage is very high in the Auckland metropolitan region, and apparently higher than previously reported in Ontario, Canada in 2005.6 In Auckland, more than 85% of men and 84% of women over 55 in 2010 have had one or more glucose or HbA1c blood tests since 2004. Females of childbearing age (aged 15–49) were also more likely to have glucose or HbA1c blood tests than their male counterparts for comparable age and ethnic groups. Overall, the blood test coverage for females between 15 and 49 years of age was 7.7% higher than that for males.

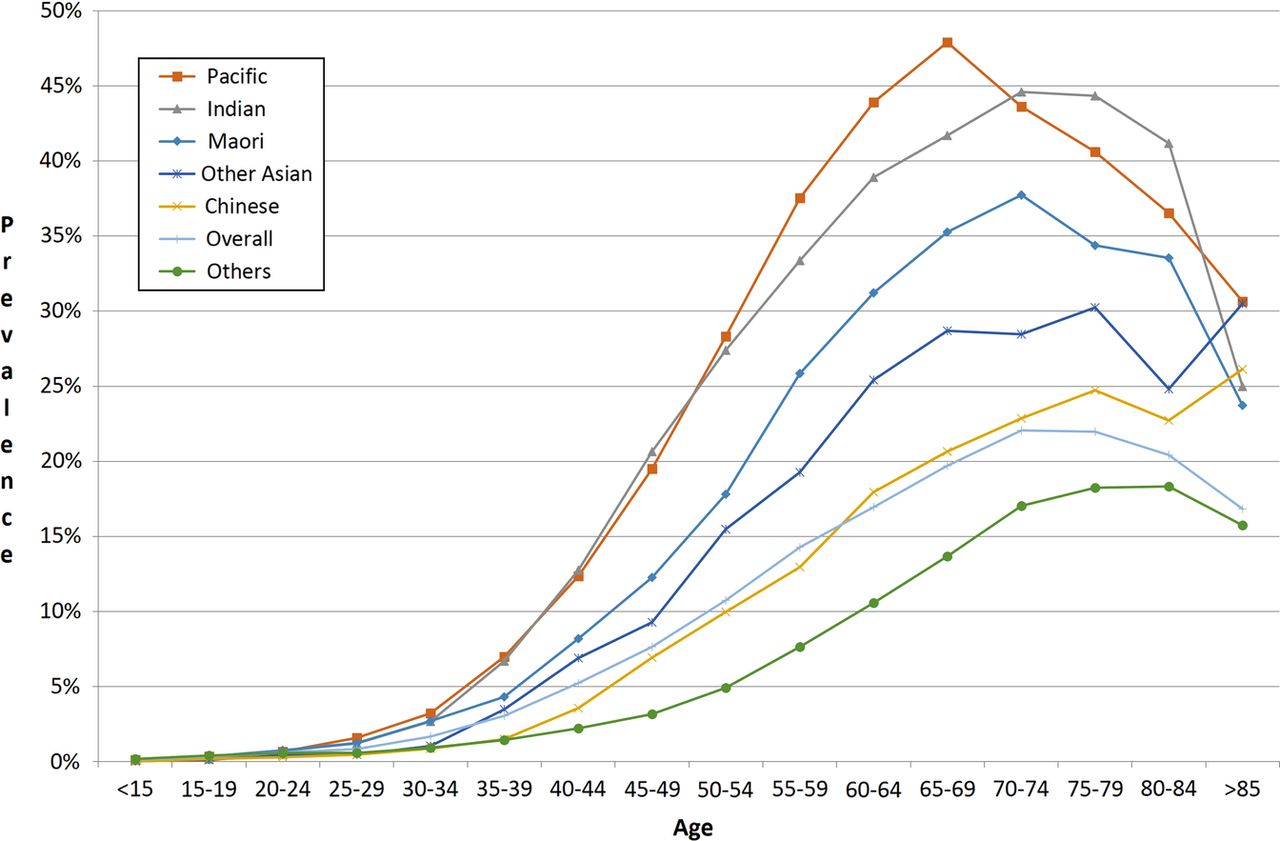
Age specific prevalence of dysglycaemia in the Auckland metropolitan region in 2010 by ethnicity (males).

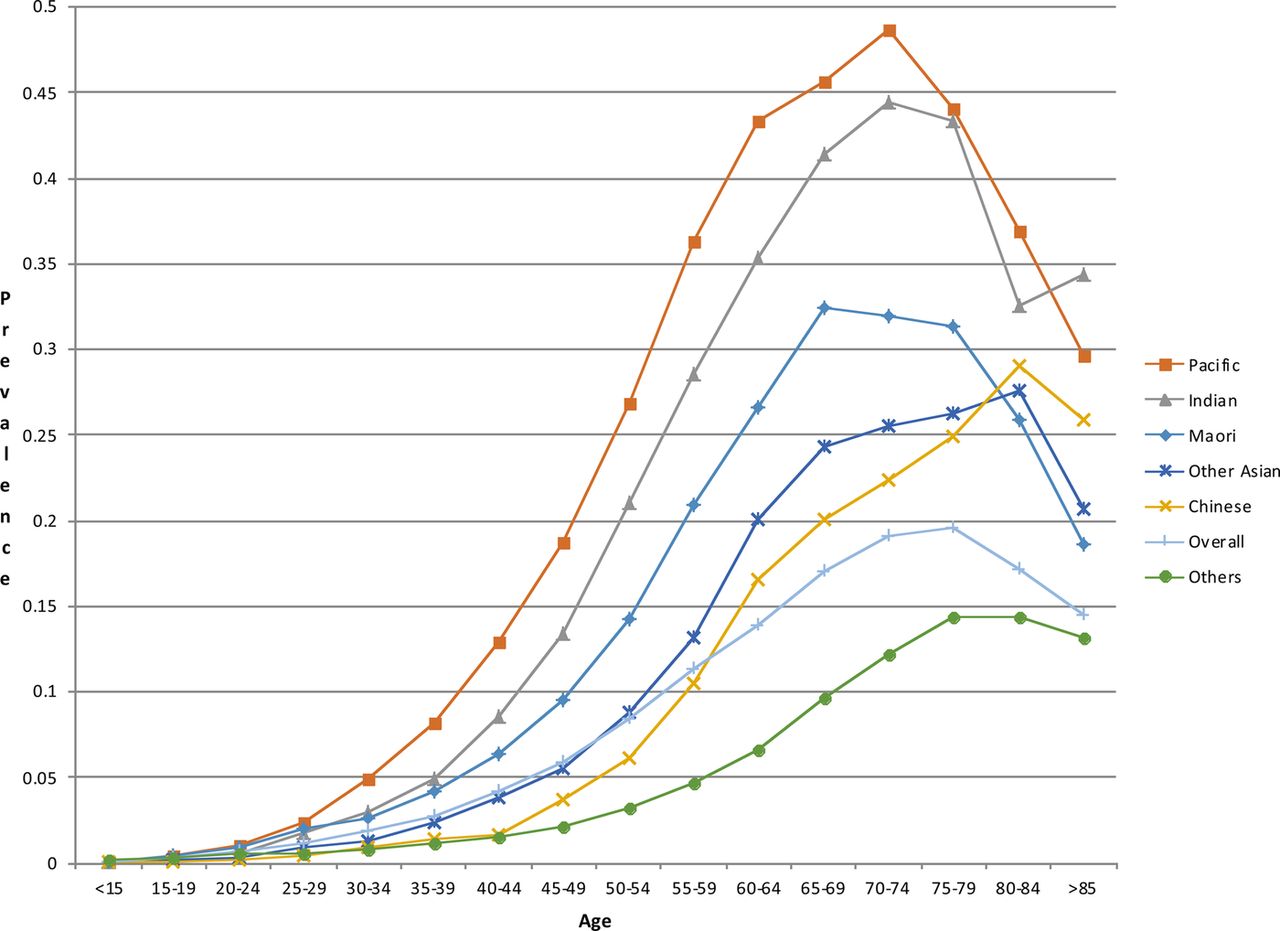
Age specific prevalence of dysglycaemia in the Auckland metropolitan region in 2010 by ethnicity (females).
Consistent with the New Zealand cardiovascular disease risk management guideline recommendation to screen Maori, Pacific and Indian people 10 years earlier than others, the age-specific blood test coverage was higher in these ethnic groups than in other groups in the age groups between 35 and 45 years for men and between 45 and 55 years for women.15 Since 34% of blood tests were carried out in hospital laboratories, it was likely that a small number of tests were undertaken because of symptoms related to diabetes rather than opportunistic screening for diabetes. Since the rate of hospital admissions increases with advancing age, the relatively high coverage of diabetes testing in the older groups may in part be a result of routine glucose testing for most patients admitted to hospitals.
Consistent with previous reports, the ethnic disparities in prevalence of dysglycaemia were alarming.16 This study demonstrated that Pacific and Indian people have the highest age standardised prevalence of dysglycaemia (table 3). Almost one in two Pacific women aged 70–74 had evidence of dysglycaemia (figure 2). These findings highlight the critical need for primary and secondary prevention efforts to reduce ethnic disparities in diabetes-related morbidity and mortality. A previously published estimate of diabetes prevalence for the southern part of the region Counties Manukau District Health Board (CMDHB) in 2006/2007 was about 20% lower in relative terms (a difference of >5000 people) than in the current study.17 The key methodological difference between the studies was the availability of blood test results in the current study, whereas the previous study relied on an algorithm based on hospitalisations, drug treatment and the number of HbA1c tests (without the test results being available) to estimate diabetes prevalence. Demographic changes; improvement in screening; differences in definitions of diabetes and dysglycaemia and a real increase in the underlying diabetes prevalence since 2006/2007 are likely to explain the difference in results between the studies.
Estimated prevalence of dysglycaemia in the Auckland metropolitan region by gender and ethnicity
The HSU population (denominator) was constructed from national routinely collected administrative data; it defined the population at risk and effectively adjusted for migration and deaths. The use of current PHO enrolment and/or evidence of health service contact are pragmatic proxies to indicate that the HSU population was residing in the Auckland metropolitan area within the defined period of the study. The novelty and strength of this study was that the test coverage and the dysglycaemic status of each individual in the HSU population in 2010 were determined by the laboratory results in a consistent manner through individual person record linkage using a unique identifier, the encrypted NHI.
The use of the HSU population as the denominator on which to base future population registers for many long-term conditions has many technical and practical advantages in policy making and quality improvement. The HSU population (n=1 475 347) was very similar to the estimated population of the three Auckland metropolitan District Health Boards from Statistics New Zealand in June 2010 (n=1 477 600).14 In practical terms, virtually everyone with significant disease who resides in the Auckland metropolitan area is likely to be currently enrolled in a primary care practice and/or have had a contact with publicly funded health services during the year. The way the HSU population was defined means that if identifiable data were used as part of a population register, it can potentially identify any potential performance gaps that a healthcare provider can address at the individual level. Eligible patients could be readily recalled based on the latest contact details from primary care enrolment or from the last health service contact. This is particularly important in a context where the actual care that patients received might be suboptimal.18 For example, a systematic recall system can theoretically be set up for those people who are yet to be screened using the identical record linkage carried out by this study. As pharmaceutical dispensing data can be linked by NHI in New Zealand, a similar systematic system could also be implemented to monitor the care provision for people who are at high risk of complications. For example, it would be possible to recall those with diabetes and microalbuminuria who were not dispensed an ACE inhibitor or angiotensin II receptor antagonist, or people with poorly controlled diabetes who may need further clinical review or self-management support. Many chronic care models such as Wagner's emphasised the value of clinical information systems and the role of a population registry to facilitate the provision of systematic proactive care to patients with long-term conditions.19 Indeed, an integrated electronic health record system that contains laboratory results, pharmaceutical use and utilisation of services has recently been highlighted as critical components to measure the quality of care provided.20
Other advantages of the HSU population used in this study include the elimination of numerator-denominator biases highlighted in previous reports, because all the demographic variables between the numerator and denominator were recorded in a consistent way.21 ,22 Furthermore, the participation of all the laboratories serving the area in the study, meaning virtually 100% of the laboratory tests performed in the Auckland metropolitan area, was included. The long-standing use of the data repository, and its incorporation in day-to-day general practice and secondary care, also contributes to the completeness and robustness of the data stored.
This study addressed many of the limitations of common sources of data that are used to estimate known diabetes prevalence—these are summarised in table 4.1 ,3 ,4 ,23–26 Many traditional epidemiological studies are based on surveys that are subject to selection bias and patient-recall biases.1 ,4 Self-reported diabetes prevalence estimates are often lower than estimates based on biochemical results.4 Most epidemiological surveys have relied on one single laboratory measurement; however, glucose tolerance tests have limited repeatability and glucose measurements have considerable intraindividual variations.23 ,27 While some registers have sourced data from primary care, the quality of input data and consistency of coding could be highly variable.3 ,24 ,28 While the UK NHS Quality and Outcomes Framework (QOF) recommends a systematic approach to diagnose diabetes, primary care providers are not required to provide a supporting description on how the diabetes diagnoses are performed, other than a record of a diabetes diagnosis for the purpose of the QOF indicator.29 Indeed, QOF openly acknowledges that there are a substantial number of people who are undiagnosed or misdiagnosed.29 The ability to keep an up-to-date record of people with ‘diagnosed’ diabetes would also be more challenging in places where there is a highly mobile population such as in New Zealand, certain parts of Great Britain and the USA.30–32 Furthermore, a significant number of blood test results may not be requested by the general practices that are currently responsible for the patients’ care. For example, as demonstrated in this study, significant numbers of laboratory tests were carried out in hospitals.
The limitations of common sources of data used to estimate diabetes prevalence
The New Zealand NHI database has identifiable information such as name, address, date of birth and self-reported ethnicity.33 The NHI number has been used in other settings of proactive care such as immunisation in New Zealand.33 ,34 The duplicated NHIs are regularly cleaned and mapped back to the Master NHI. Regular audits are performed and PHOs are required to provide their patient registries to the MOH every quarter. Therefore, applying the methodology used in this study to construct a population register has the potential to enable a systematic approach to medical auditing. The method identifies the population eligible but yet to be screened for diabetes within a defined period or people who might have abnormal diabetes laboratory results who would benefit from proactive follow-up as defined by this study. Data security and appropriate access and use of health data across the whole of the health system are vital components to enable a population register to succeed. The balance between patient confidentiality and the adaptable use of identifiable health data to enable proactive health services should be vigorously debated. While the rationale to develop such a population register is to improve population health and equity through systematic medical audit, appropriate safeguards should be in place to limit any unintended misuse of possible confidential health data.
Ideally, clinicians should have timely access to all the available health information for the group of patients that they are clinically responsible for. However, the capacity and capability required to analyse the health data from the whole of the health system into clinically meaningful and actionable health information to be available at the point of care are not universally available from all the healthcare providers. Therefore, a central system that can apply the methods of this study has a tremendous potential to review some of the possible quality gaps that exist in the current system.
The definition of dysglycaemia used in this study is a pragmatic one which identifies a group of people with abnormalities of glucose metabolism, who are at high risk of cardiovascular complications and need to be followed up by the healthcare system for ongoing clinical support and management.35–38 People with borderline elevated HbA1c (>48 mmol/mol) may be offered dietary advice and the HbA1C test may not necessarily be repeated immediately in the ‘real world’ as it does not change immediate management. Strictly speaking, these people would not yet have met the diagnostic criteria of diabetes. However, they should have follow-up tests to confirm or exclude the diagnosis of diabetes, impaired fasting glucose or impaired glucose tolerance. Moreover, the proposed method of this study can be refined further to apply the different diagnostic threshold of HbA1C according to ethnicity or to local recommendations.39 ,40
Another limitation of this study is the imperfect sensitivity as it was based on ‘real-world’ data of relatively short duration, and the way dysglycaemia is currently defined the study would not have identified people with dysglycaemia or diabetes who were lost to follow-up. However, more than 91% of the HSU population who had a diabetes-related hospitalisation in New Zealand between 1 July 2000 and 30 June 2010 also had laboratory results consistent with the diagnosis. This finding suggests that a regional laboratory repository of such duration (community test results for 4 years and hospital test results for 6.5 years) would already capture a substantial proportion of people with diabetes. Many people who had a single elevated glucose test might not be followed up (to get the second test required for diagnosis). This study would also miss people who had diabetes diagnosed by laboratory tests performed outside the Auckland metropolitan area or diagnosed before 2004 and subsequently had excellent diabetes control. However, these cohorts would be identified in subsequent iterations of the population register if their diabetes control deteriorated in the future. The study did not have information related to patients’ symptoms or the ability to differentiate types 1 and 2 diabetes. Since glycaemia-related blood testing coverage varies by age, gender and ethnicity, as shown in tables 1 and 2, the differential testing coverage could contribute a degree of systematic bias to this study's estimate of dysglycaemia prevalence.
In conclusion, a regional laboratory result repository linked to administrative datasets has the potential to provide highly relevant and consistent information to inform clinical decision making in a comprehensive and timely manner as well as being an excellent epidemiological surveillance tool.
References
Footnotes
-
Contributors WCC designed the study methods, applied approval for access to all the relevant data, undertook the literature search, record linkage, crosschecking and statistical analysis, and drafted up and revised the paper. He is the guarantor. GJ designed the study methods and revised the paper. CW designed the study methods, linked the administrative data to construct the health service utilisation population, and revised the paper. BO-W, DRB and RJ designed the study methods and revised the paper. PLD provided clinical diabetes input and revised the paper. MAWL undertook the record linkage, crosschecking and statistical analysis. DP undertook the record linkage and data extraction for crosschecking.
-
Funding This study was conducted as a result of the work undertaken for Counties Manukau District Health Board (CMDHB), New Zealand.
-
Competing interests BOW had received remuneration from the New Zealand Ministry of Health, as the former National clinical director responsible for sector engagement on population health targets. BOW had received payment for lectures from Novo-Nordisk, AstraZeneca, Sanofi and MSD. WCC, GJ, BOW, DRB, MAWL, and DP were paid employees of CMDHB at the time of the study.
-
Ethics approval Ethical approval was obtained from The New Zealand Northern X Regional Ethics Committee (NTX/10/EXP/153) and access to TestSafe laboratory results was approved by the Auckland Regional Information Systems Group (RISG).
-
Provenance and peer review Not commissioned; externally peer reviewed.
-
Data sharing statement No additional data are available.