Article Text

Abstract
Objectives To evaluate the feasibility of using patient-reported outcome measures (PROMs) for long-term conditions (LTCs) in primary care.
Design A cohort postal survey conducted from September 2010 to April 2012.
Setting Primary care practices (n=33) in London and the North-West of England.
Participants 4484 patients with a diagnosis of asthma, chronic obstructive pulmonary disease, diabetes, epilepsy, heart failure or stroke were sent a survey at baseline.
Main outcome The main outcome was to evaluate the feasibility of and the recruitment strategies for collecting PROMs data in LTCs by assessing the response rates for the baseline and follow-up surveys. Secondary outcomes were the evaluation of change scores of the EQ-5D index and visual analogue scale (VAS) between baseline and follow-up surveys.
Results The baseline survey achieved a response rate of 38.4% (n=1721/4485) and at follow-up 71.5% (n=1136/1589). Response rates varied by LTC. Little change was found in health-related quality of life for the total sample (−0.001 for the EQ-5D index score and 0.12 for the EQ-5D VAS) between patients responding to both the baseline and follow-up surveys.
Conclusions The response rate to the baseline survey was similar to that of other general practice surveys. Current UK policy aims to assess health service performance in LTCs by means of using PROMs. It thus would be desirable to improve response rates by making the invitation to self-reports of health-related quality of life more engaging for patients. Results on the EQ-5D score raise questions about optimal indicators for LTCs and appropriate timelines for assessment.
- Patient-reported outcome measures
- Long-term conditions
- PRIMARY CARE
- Cohort study
This is an Open Access article distributed in accordance with the Creative Commons Attribution Non Commercial (CC BY-NC 3.0) license, which permits others to distribute, remix, adapt, build upon this work non-commercially, and license their derivative works on different terms, provided the original work is properly cited and the use is non-commercial. See: http://creativecommons.org/licenses/by-nc/3.0/
Statistics from Altmetric.com
Strengths and limitations of this study
-
It is the first empirical evidence on the use of patient-reported outcome measures (PROMs) for long-term conditions (LTCs) in primary care focusing on patients with a confirmed diagnosis.
-
This study provides evidence that patients with LTCs who have completed a PROM once, are likely to complete a follow-up.
-
Limitations include the response rate, some logistic problems with identifying eligible patients from the GP databases and the number of patients excluded by the practices.
Introduction
The prevalence of long-term or chronic conditions, including multimorbidity, is increasing world wide.1–5 Long-term conditions (LTCs) usually reduce people's quality of life, particularly in the case of multimorbidity.2 ,3 ,6 People with limiting LTCs are the most intensive users of the most expensive healthcare services2 and the majority of health expenditure is for people with chronic conditions.5
Chronic conditions are increasingly becoming the main concern of healthcare systems5 ,7 and a current challenge is to evaluate models of care and to develop new models that are more cost effective.4 The innovative care for chronic conditions (ICCCs) framework aims to address different levels of healthcare including that at the microlevel focused on patients and families.8 Improving healthcare outcomes for all is the primary purpose of the National Health Service (NHS) in England9 and the NHS Outcomes Framework10 sets out the indicators for measuring health outcomes in NHS services. The Outcomes Framework's second domain for improvement is the enhancement of quality of life for people with LTCs as assessed by patient-reported outcome measures (PROMs).
Patients’ views are complementary to those of clinicians and provide unique information into the humanity and effectiveness of healthcare.11 Routinely collecting data on patients’ views through PROMS provides an opportunity to help drive change in the organisation and delivery of healthcare. Since 2009, PROMs have been used on a routine and mandated basis to assess outcomes in four elective surgical procedures in the NHS in England (http://www.ic.nhs.uk/proms, accessed 21 March 2013). The role of PROMs in LTCs is more challenging than in elective surgery. In elective surgery, the PROMs are used to help assess the effectiveness of a single, discrete procedure. By contrast, LTCs are complex to manage involving diverse service providers and interventions over long timelines. The purpose of this study was to assess the feasibility of using PROMs to monitor aggregated quality of life data for a range of LTCs in primary care.
Methods
A cohort survey was conducted in primary care from September 2010 to April 2012, with baseline and follow-up data being collected 1 year apart. The primary aim of the study was to evaluate the recruitment strategies for and the feasibility of collecting PROMs data in LTCs by assessing response rates at two points of data collection. Secondary outcomes were the change scores of the EQ-5D index and visual analogue scale (VAS) between baseline and follow-up surveys. Two considerations informed the secondary outcomes of the study: on the one hand the NHS Outcomes Framework's12 second domain refers to the possibility of changes over time in the quality of life in LTCs and on the other hand, the trajectory of many LTCs is deterioration in health status. The LTCs included were asthma, chronic obstructive pulmonary disease (COPD), diabetes, epilepsy, heart failure and stroke. The study was registered on the National Institute for Health Research (NIHR) portfolio (UKCRN ID: 8462).
Design
A cohort survey was conducted by post. The baseline survey was provided prepacked to participating practices and was mailed by practice staff, accompanied by a covering letter from the general practitioner (GP). The baseline survey was returned to the Oxford research team and the follow-up survey was sent from Oxford. Consent was implied by returning the baseline survey. If participants were willing to complete a follow-up questionnaire, they were asked to give consent and to provide the Oxford team with their contact details. All surveys were numbered. This served a dual purpose, first to identify the respondents’ practice and second to match baseline and follow-up responses. A ‘thank you/reminder’ letter was sent by the practices 2 weeks after the mailing of the baseline survey to all patients invited into the study. The follow-up reminder, also sent after 2 weeks, was sent by the research team and targeted at non-responders only. A Microsoft Access database was set up to manage the mailing and receipt of the surveys.
Setting
The study was conducted in 33 primary care practices in London (n=18) and the North-West of England (NW) (n=15). Practices were recruited with the support of PCT staff, research nurses, local Primary Care Research Networks and the Diabetes Research Network in London. For less prevalent LTCs a larger number of practices participated. The majority of practices covered three LTCs and one practice covered two LTCs. Power calculations determined that a total of 1050 patients (or 175/LTC) were needed to detect, a two-sided p<0.05 with 80% power, both a 15% difference in response rates between two independent groups and a moderate effect size of 0.3 in PROM score change over time. Ten practices provided patients for asthma (5 in London and 5 in NW), 16 for COPD (8 in London and 8 in NW), 10 for diabetes (5 in London and 5 in NW), 23 for epilepsy (13 in London and 10 in NW), 20 for heart failure (11 in London and 9 in NW) and 19 for stroke (12 in London and 7 in NW). The number of practices per LTC varied due to the prevalence of the LTC and practice size. Practices varied in size: 12 were small (<5800 patients), 13 medium (5800–10 500 patients) and 8 large (>10 500 patients). A slightly larger number of practices were recruited from more deprived areas (table 1).
Number of practices per social deprivation quintile
Participants
Eligible patients were identified through an automatic and remote search of practices’ clinical systems by a subcontracted information and technology (IT) company prior to the baseline survey. The search was specific to every clinical system of which a range is available. The search was developed only for the three most widely used clinical systems. The aim was to identify approximately 50% of the patients for each LTC in every practice by a selection based on odd or even months of patients’ birthdays. The search was based on Read codes in line with the criteria used in the quality and outcomes framework (QOF) with two exceptions: patients with diabetes needed to be 18 years of age and patients with transient ischaemic attack(s) (TIAs) were excluded from the stroke group. The number of patients extracted by the search was compared with QOF estimates to check the expected numbers of patients were being selected. Patients were included in the survey for one LTC only; if they had multiple LTCs they were included for the rarest condition.
A member of staff (usually a GP or a nurse) reviewed the list of eligible patients identified from clinical systems to exclude any patients who were not considered suitable to be invited into the study. The instruction to practices was to exclude patients if participation in the survey might cause serious distress. The practice staff made the judgement of when this criterion applied.
Patient-reported outcome measures
A generic PROM and appropriate disease-specific PROMs were included in the surveys, as well as standard demographics questions and a question on comorbidities. The PROMs were selected on the basis of their psychometric properties evaluated by review work (http://phi.uhce.ox.ac.uk/newpubs.php, accessed 13 December 2012) and licensing agreements. This article presents the findings from the EQ-5D,13 the generic measure used. The EQ-5D is a measure of health status primarily designed to provide a single-index value which represents the utility of specific health states, that is, how given health states are valued by the general population.13 It takes approximately 5 min to complete and comprises five items, one each on mobility, self-care, usual activities, pain/discomfort and anxiety/depression, that are all scored on a three-point scale. A single-index value is calculated from the five items typically with a score range from 1 (perfect health) to 0 (death) although a small number of scores below 0 can be obtained indicating states worse than death. The EQ-5D also includes a VAS, ranging from 0 ‘worst imaginable health state’ to 100 ‘best imaginable health state’.
Analysis
Response rates were calculated overall and for each LTC at baseline and follow-up. Cross-tabulations, with χ2 tests, were used to assess differences in response rates at baseline, consent to be followed up and response rate at follow-up between categorical variables (participant LTC, gender, age, location and ethnicity), and Student t tests were used to compare mean scores for continuous data (time since diagnosis, number of comorbidities). Analysis of variance was used to identify factors (type of LTC, practice-related or patient-related factors or mean baseline EQ-5D scores) that were significantly related to follow-up response rates. All the variables relevant to cohort follow-up response rates were entered into a logistic regression (no consent to follow-up=0 vs consent for follow-up=1, and follow-up not completed=0 vs follow-up completed=1). The level of significance was set at two-sided p<0.05.
Changes in the EQ-5D utility and VAS scores for respondents to both the baseline and follow-up surveys were assessed with paired Student t test. No data imputation was performed so the number of patients in the analysis of the EQ-5D may be lower than the number of respondents to the survey. The level of significance was set at p<0.05.
Results
Recruitment of participants
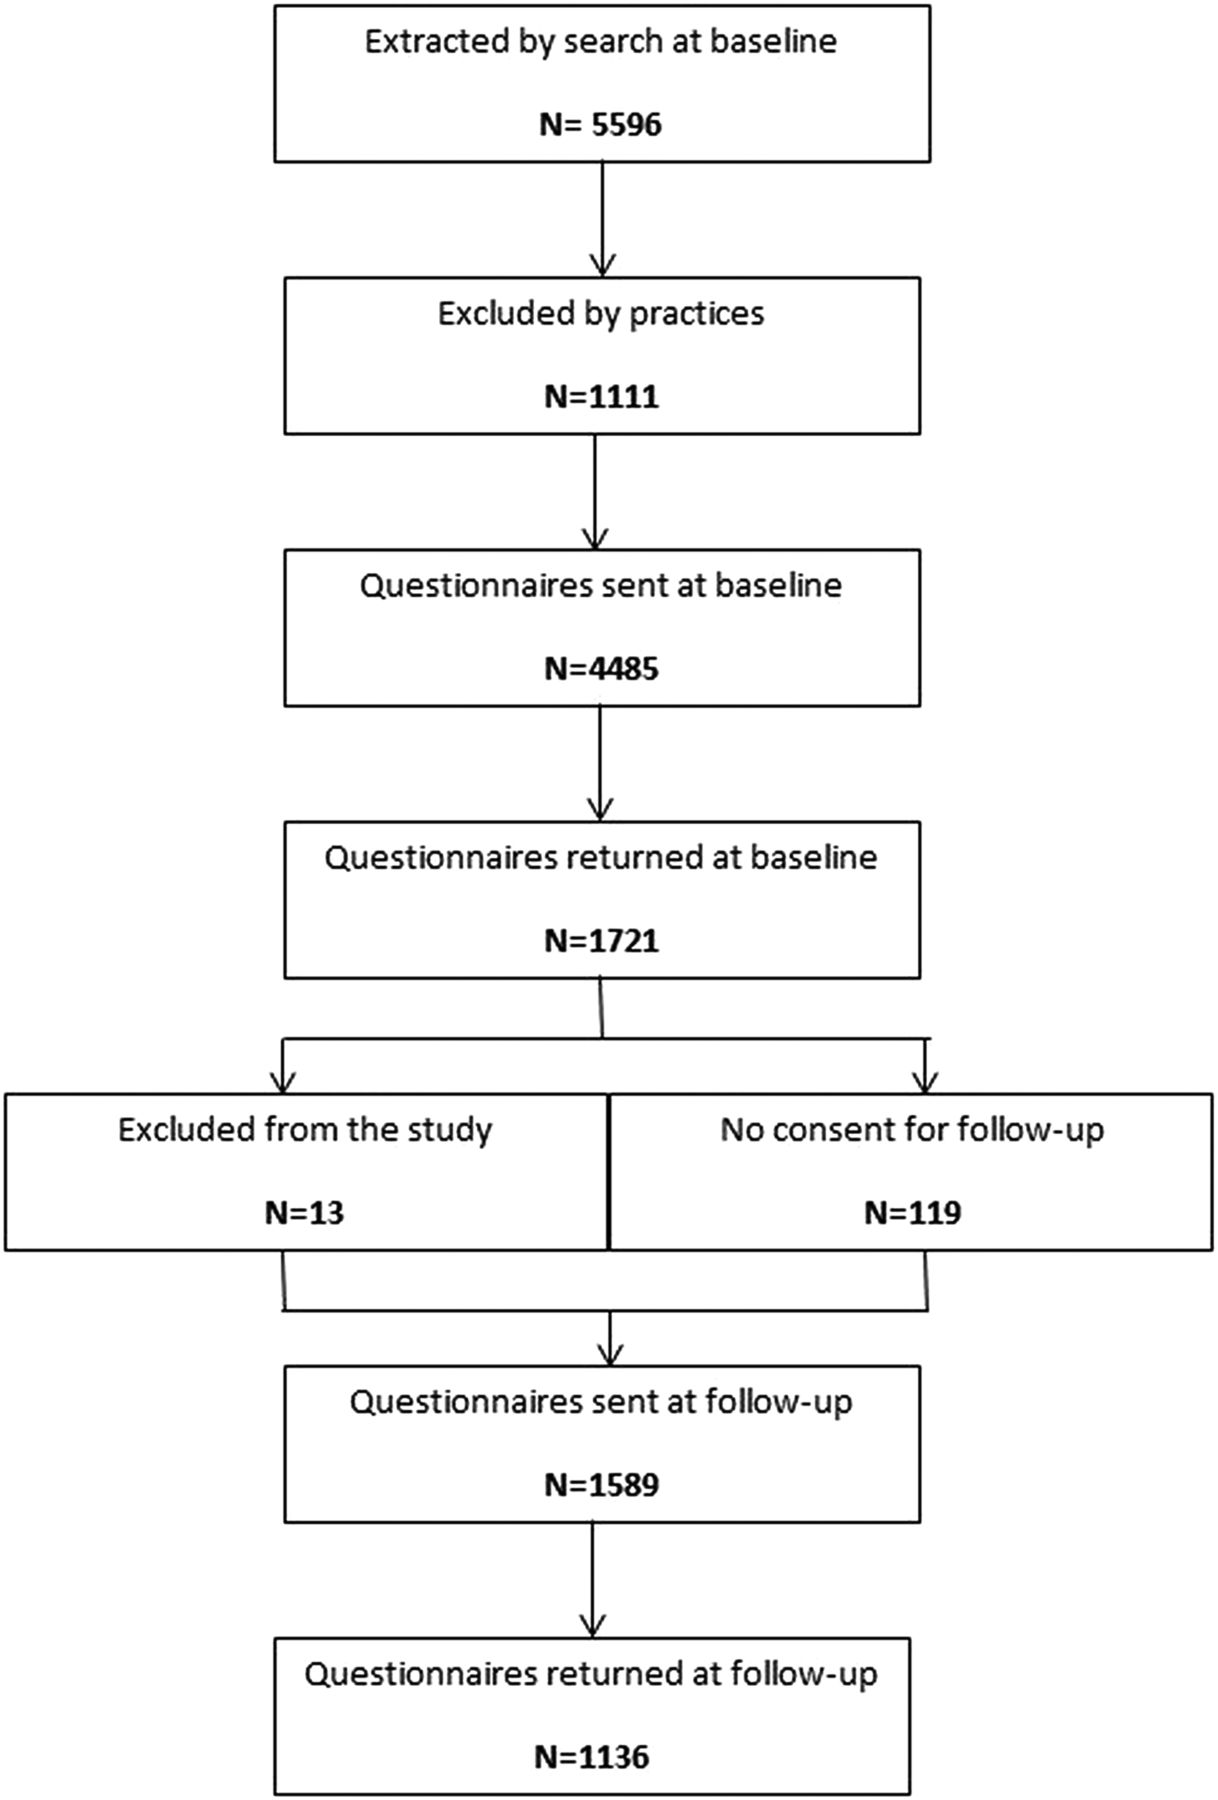
The total number of patients extracted from each search was compared with 50% of the total QOF estimate (by LTC) based on the 2009/2010 QOF prevalence rates (http://www.qof.ic.nhs.uk/search/). The number of patients extracted by the searches is higher (total n=17 455), than those invited into the study (n=5596), as the search data was available for all LTCs for every practice but surveys were sent only to up to three LTCs per practice. The flow of the 5596 patients invited into the study is illustrated in figure 1. The QOF estimates, number of patients extracted from the search, the overall difference and range of difference between the practices are presented in table 2. A positive score on the difference means that a higher number of patients than expected were extracted from the search, whereas a negative number means that a lower than expected number was extracted. Although these results give an indication of how well the searches worked, they need to be interpreted with caution. The number of patients extracted in small practices was low. The extracted numbers for diabetes and stroke were expected to be lower than the number of patients in QOF. Diabetes patients aged 17 and upwards are included in QOF, whereas this study only included diabetes patients aged 18 or above. This difference is expected to be minimal. Stroke presented more of a challenge as QOF includes TIAs which were not included in this study. Therefore, it was unlikely that the numbers extracted from the search would closely match the QOF estimates.
Numbers of eligible patients extracted in PROMs pilot search compared with QOF estimates
Recruitment and participation (n) of people with long-term conditions (LTCs).
Exclusions by practices
The rates of patients excluded from being sent a questionnaire varied between LTCs and practices (table 3). The rate of exclusions tended to be higher in the NW than in London, although this difference was small for asthma, COPD and diabetes. However, the difference was substantial for epilepsy (56.6% in NW vs 10.0% in London), heart failure (28.5% NW vs 12.9% London) and stroke (24.2% NW vs 16.8% London). The reasons for excluding patients were death, blindness, comorbidities (such as dementia or cerebral palsy) or learning difficulties, patients having moved or being on an extended holiday, not having a clear diagnosis, recently having a traumatic life event or being in a care home. Comorbidities and learning difficulties were particularly common reasons for excluding patients with epilepsy.
Exclusions of patients by practices (cohort baseline data)
Response rates
Cohort baseline
A total of 4485 questionnaires were sent and 1721 were returned achieving an overall response rate of 38.4%. Thirteen patients were excluded from analysis and follow-up as they reported not to have been diagnosed with the specified LTC. The response rate varied between LTCs, with the response rate being the highest in heart failure (50.4%, n=262) and the lowest in asthma (30.0%, n=400; table 4). There was significant variation in response rates between LTCs (p<0.001), by practice (p=0.018) and by region (p=0.002). Additionally, across all LTCs there were significant non-linear relationships between response rates and the practices’ deprivation score (p=0.024, table 5), and the practices’ EQ-5D mean score adjusted for patient age, gender, time since diagnosis and number of comorbidities (p=0.004). Practices with a QOF score of 100 (maximum score) had significantly (p=0.013) higher response rates (mean response rate=42.9%, SD 11.9) than those who did not (mean=35.5%, SD 14.3).
Cohort baseline survey numbers sent and returned, and response rates (%) for each LTC (overall, by region and practice range)
Mean response rate by deprivation score (N refers to the number of practices for each long-term condition covered ie, 98 cases)
Cohort follow-up
At baseline, 92.3% of responding patients (1589 of 1721) had agreed and were eligible to be sent a follow-up questionnaire. The lowest rate of consent was achieved for heart failure (90.5%) and the highest for COPD (95.3%). For the total sample, there was no significant difference in whether consent to follow-up was given by LTC, age, region, ethnicity, number of comorbidities or time since diagnosis. There was, however, a difference between practices (p=0.008) with the proportion of baseline respondents giving consent ranging from 78.6% to 100%. There were some differences in consent for individual LTCs, including gender (96.1% of men consented vs 90.1% of women, p=0.029) and practice (consent in asthma ranged from 79.1% to 100% in 10 practices, p=0.010) in asthma, and number of comorbidities for epilepsy (mean 1.17, SD 1.30 for those who consented vs mean 2.14, SD 2.00 for those who did not consent, p=0.017) and heart failure (mean 1.92, SD 1.62 for those who consented vs mean 2.60, SD 1.71 for those who did not consent, p=0.049).
The overall response rate of baseline respondents who consented to the follow-up was 71.5% (n=1136/1589). Numbers of questionnaires sent and response rates by LTC are given in table 6. Differences in response rates to the follow-up survey were examined by means of baseline characteristics of respondents who had consented to the follow-up. For the overall sample, there were significant differences in response rate at follow-up by LTC (p=0.015), age (p<0.001), ethnicity (p=0.008) and region (p=0.007), with patients with epilepsy and heart failure being less likely to respond than patients with one of the other LTCs, as were younger patients, those based in London and those from ethnic minority backgrounds (table 7). The baseline mean EQ-5D score was significantly lower (p<0.001) in non-responders to follow-up (mean 0.66, SD 0.33) than in follow-up responders (mean 0.73, SD 0.29). There were no significant differences in the response rate at follow-up for gender, time since diagnosis, number of comorbidities or practice.
Cohort follow-up survey numbers sent and returned, and response rates (%) for each LTC (overall, by region and practice range)
Factors significantly related to the number of questionnaires returned at cohort follow-up
When analyses were performed of prediction of return of the follow-up questionnaire for each of the six LTCs, significant differences were observed for some factors, including age (p<0.001) and ethnicity (p=0.009) in asthma; age (p=0.012) in COPD, gender (p=0.032) and region (p=0.003) in diabetes; age (p=0.011) in epilepsy; and ethnicity (p=0.003) in stroke. The direction of these differences was the same as for the overall sample (ie, lower completion rate in younger patients and ethnic minorities), with the additional finding that in diabetes, women were less likely to complete the follow-up than men. When entered into a logistic regression (follow-up not completed=0 vs follow-up completed=1), only some age groups and EQ-5D remained significant (table 8). Asthma and age 18–24 served as reference categories.
Factors related to completion of the follow-up questionnaire
EQ-5D scores
EQ-5D scores could be calculated for 93.1% (n=1058) of the respondents to both the baseline and follow-up surveys. The EQ-5D scores and VAS were found to be significantly different between LTCs both at baseline and follow-up (all p<0.001). However, no significant differences were found for the mean EQ-5D scores for the total sample between baseline and follow-up. For the VAS, a significant difference was found for heart failure only, with scores deteriorating at follow-up (mean difference −3.53, 95% CI −6.67 to −0.38). The data are presented in table 9.
EQ-5D and VAS mean, and change, scores at baseline and follow-up
Discussion
This study provides the first empirical evidence on the use of PROMs for LTCs in primary care focusing on patients with a confirmed diagnosis. The evidence on participation of individuals with LTCs is essential for making decisions about the feasibility of expanding the current PROMs programme to LTCs. The aim of the study was to evaluate the feasibility of collecting PROMs data in LTCs through primary care focusing on response rates to a baseline and follow-up survey conducted 1 year apart. Overall, a 38.4% response rate was achieved at baseline and 71.5% for the cohort (those responding at baseline and agreeing to be sent a follow-up questionnaire) at follow-up. Response rates varied between LTCs at both assessments. Other factors significantly related to response rates were practice factors (including deprivation score, QOF score and mean EQ-5D score) at baseline, and respondent factors (including age, ethnicity, region and mean baseline EQ-5D score) at follow-up. Other methods to assess feasibility included testing the remote and automatic search of GP databases for eligible patients and to monitor patient exclusions. Problems were encountered with the search. It was possible to overcome these to some extent by the IT company amending the searches. However, discrepancies remained in the number of patients extracted from the search when compared with QOF estimates. The PROMs programme aims to be as inclusive as possible and therefore the number of patients excluded by practices at baseline was monitored. The exclusion rates varied by LTC and by region. The variation by LTC may be related to the nature of the specific LTC or the comorbidities associated with a particular LTC. The highest exclusion rate was for epilepsy, which practices reported to be expected as many people with epilepsy have learning difficulties or other comorbidities which would make it inappropriate for them to be included in the study. There were no significant changes in EQ-5D scores between baseline and follow-up. The VAS was significantly different between baseline and follow-up for heart failure only.
The main strength of this study is the potential for greater reliability of the diagnosis obtained from GP clinical systems over the self-reported diagnoses in the GP Patient Survey.14 ,15 While the study was able to detect patients with LTC using remote and automatic search of GP databases, weaknesses of the methods tested in this study were the lack of information about non-responders of the baseline survey, high-exclusion rates by practices in some LTCs and the logistics of remotely identifying eligible patients from GP databases. No information about non-responders had been collected as there were concerns that collecting these data was too burdensome for participating practices. However, such data would have been valuable to assess non-response bias beyond the non-response bias from the follow-up. Exclusion rates varied between practices. This was partly due to problems with identifying eligible patients in the practices where the search by the IT company was first conducted. For example, in the case of epilepsy the initial search did not include the code in relation to medication (as by QOF) and some practices chose for a member of staff to exclude ineligible patients rather than the search being re-run. Some differences in exclusions occurred due to practices’ different interpretations of the instruction to exclude patients in whom invitation into the study would cause serious distress, although this is believed to only have had a minor impact. Reasons for exclusions were not recorded systematically (again to minimise the burden on practices). Practices informally reported that the most common reasons for exclusion were comorbidities such as learning difficulties or mental health problems. This suggests that it may be not be feasible to collect PROMs data from all patients with some diagnoses; other methods, such as collecting data by proxy, may have to be considered. Remotely identifying eligible patients was challenging due to mistakes made in the initial searches (search criteria for asthma and epilepsy did not meet QOF criteria) and the search working less well in some of the clinical systems used by the participating practices. These problems mean that further development work and testing would be necessary to ensure that such a system was feasible and able to be used across all clinical systems.
Response rates were the main variable of interest of this study, and it would be desirable for response rates, particularly those at baseline, to be higher. However, other general practice-based surveys such as the GP Patient Survey have achieved a similar response rate,14 ,15 suggesting that such a low response rate would be typical. The advantage of this study is that the potential for greater reliability of the diagnosis obtained from GP clinical systems over the self-reported diagnoses in the GP Patient Survey. The response rates for the data collection of the four elective PROMs were higher (60.3%) than the baseline response rates reported here, as were the response rates postsurgery (87.5%).16 Nevertheless, non-response bias has been observed in relation to outcomes in elective surgery.17 Overall response rates to health surveys are decreasing,18 but the magnitude of response rates are not always thought to be a problem. Roland et al14 found little evidence that low response rates and non-response bias in health surveys led to unfairness in payments for performance in general practices. It is not known whether there is any non-response bias in this study, and efforts to enhance response rates should not be dismissed. Traditional methods to increase response rates include a good cover letter and sending a reminder. More modern methods, however, such as using electronic surveys may help increase response rates, especially in younger age groups. In this respect, it is worth noting that the response rate at follow-up of 71.5% suggests that once patients are ‘on-board’ the study they are likely to continue to respond, even 1 year later.
The other variables of interest in this study were the EQ-5D mean and VAS scores reported by the survey respondents, with very little change occurring in health-related quality of life. Change in the EQ-5D in LTCs has been considered in the Health Survey for England with little change shown,19 however the cross-sectional design of the Health Survey does not allow for assessment of changes within the same cohort. In view of the goal of the current policy in England to assess performance of the health service by means of the EQ-5D, these results raise broader questions about optimal indicators of care for LTCs and appropriate timelines for assessment. Currently there are a number of major uncertainties regarding trends and timelines for the progression of LTCs. Moreover, given evidence from this study that better baseline EQ-5D scores resulted in higher response rates at follow-up, it is unclear how helpful self-reported health-related quality of life is in monitoring such trends.
To improve response rates, the invitation to contribute self-reports of health needs to be more engaging in the sense of patients perceiving that their reports will actually serve a purpose. This greater sense of point or purpose could be achieved in three distinct, but not mutually exclusive ways. First, patients could find the information valuable and informative, for example by providing feedback of their progress over time or in comparison with other patients. Second, patients could find the information in PROMs helpful in preparing for consultations with healthcare providers or as a part of regular review or assessment. Third, it is conceivable that patients would value providing information if it were truly the case that PROMs data were used to provide evidence of quality or performance of services. The NHS and indeed all other healthcare systems are a long way from being able to support any of these possible uses of PROMs for LTCs that might enhance patient engagement. Further research needs to address whether PROMs can better inform patients about their progress, support communication of need or facilitate contributions to quality assessment.
Acknowledgments
All the authors wish to thank the Primary Care Research Networks in London and the North-West; the Diabetes Research Network in London; all the practice staff who helped with the recruitment of practices and patients, and all the patients who participated in the surveys. Furthermore, they would also like to thank Ms Sarah Dummett for her support in collecting the data.
References
Footnotes
-
Contributors RF, CJ and HD conceived and designed the study. MP and HC collected the data. All authors contributed to the data analysis. MP wrote the article, with contributions from HC, HD, CJ and RF. All authors edited and approved the final version of the manuscript.
-
Funding This research was initially funded as an individual project under the Department of Health's Policy Research Programme. From 2011, it was incorporated within the research programme of the Department of Health funded Policy Research Unit on Quality and Outcomes of Person-centred care (QORU), a collaboration between the London School of Economics and Political Science (LSE) and the Universities of Kent and Oxford. The University of Oxford Clinical Trials and Research Governance (CTRG) acted as sponsor.
-
Competing interests None.
-
Ethics approval Ethics approval was given by the National Research Ethics (NRES) Committee of the Isle of Wight, Portsmouth and South East Hampshire (now the NRES South-Central Committee) in March 2010 (reference number 10/H0501/10), and research and development approval was obtained from 20 participating primary care trusts (PCTs). A change of the diabetes PROM was approved in September 2010.
-
Provenance and peer review Not commissioned; externally peer reviewed.
-
Data sharing statement No additional patient-level data are available. The full report of the study is available on the website of the Policy Research Unit on Quality and Outcomes of Person-centred care (http://www.qoru.ac.uk/).