Article Text

Abstract
Objective The measurement of disability in low-income countries is recognised as a major deficiency in health information systems, especially in Africa. The Iganga and Mayuge Demographic Surveillance System (IM-DSS) in Uganda provides a special opportunity to develop population-based data to inform national health policies and evaluate innovations in assessing the burden of disability in Uganda. In this study, we apply a new instrument to screen for physical disabilities at the IM-DSS. The study utilised a modified version of the short set of questions proposed by the Washington Group on Disability Statistics. The instrument was applied at the household level and information was collected on all individuals over the age of 5, who were residents of the IM-DSS.
Setting The study was based at the IM-DSS, which covers the parts of Iganga and Mayuge districts in Eastern Uganda.
Participants 57 247 individuals were included in the survey, with 51% of the study population being women.
Primary outcomes Activity limitations
Results The overall prevalence of physical disability at the IM-DSS was 9.4%, with vision being the most common type of difficulty reported in this population, and communication being least prevalent. Disability was less likely to be observed among males than their female counterparts (OR 0.75; 95% CI 0.71 to 0.81; p<0.001). Statistically significant associations were found between disability and increasing age, as well as disability and decreasing household wealth status.
Conclusions This study shows that the modified short set of questions can be readily applied in a DSS setting to obtain estimates on the prevalence and types of disability at the population level. This instrument could be adapted for use to screen for disability in other LMIC settings, providing estimates that are comparable across different global regions and populations.
- Disability
- Screening
- Surveillance
- Morbidity measure
- Self-rated health
This is an Open Access article distributed in accordance with the Creative Commons Attribution Non Commercial (CC BY-NC 4.0) license, which permits others to distribute, remix, adapt, build upon this work non-commercially, and license their derivative works on different terms, provided the original work is properly cited and the use is non-commercial. See: http://creativecommons.org/licenses/by-nc/4.0/
Statistics from Altmetric.com
Strengths and limitations of this study
-
We show that this tool can be readily applied in a Demographic Surveillance Sites (DSS) setting to obtain estimates on the prevalence and types of disability at the population level.
-
It could be adapted for use to screen for disability in other low-income and middle-income settings, providing key information that could be used to address and alleviate this burden.
-
This study focused only on physical disability, and due to the nature of the questions, children under the age of five were excluded. As such, assessment of the prevalence of disability obtained using this instrument is likely to underestimate the true prevalence of disability in the society.
Introduction
The WHO estimates that there are currently more than one billion people, approximately 15% of the global population, living with some degree of disability.1 Almost 80% of these individuals live in low and middle-income countries (LMICs), where they have little or no access to appropriate services.1 However, for most LMICs, information about disabilities is either unavailable or limited by measurement methodology.2–4 In Uganda, for example, several attempts have been made to estimate the prevalence of disabilities. In 2002, census data yielded a prevalence of approximately 4% for all types of disabilities based on one question asking about impairments and disease conditions.5 However, due to the limited scope of the question, this is thought to substantially underestimate the true prevalence of disabilities in the population.2 ,3 Subsequent efforts have revealed differing estimates of the prevalence of disabilities, mainly due to the variation in the questions asked and survey methodology.5–8 In light of measurement limitations, careful attention must be given to defining disability and to the approaches used to identify those who experience it.2 ,4 ,9–11
In developing countries, where there is a scarcity of reliable health data, sentinel surveillance systems can be invaluable to fill data gaps and guide programme planning and implementation.12–15 Demographic Surveillance Sites (DSS) represent a novel kind of a sentinel surveillance system that provides a rare opportunity to collect data from all individuals living in a defined geographical location over time.12 ,13 ,16–20 There are currently 48 such sites spread across 20 countries, which have joined to form the International Network of Field Sites with Continuous Demographic Evaluation of Populations and Their Health (INDEPTH) network. This international network (1) allows for the sharing of information between LMICs, (2) provides a mechanism for improving core methods for longer term population-based surveys and (3) facilitates development of innovative health outcome measurement approaches.17
In an effort to generate population-based data using minimal resources, two DSSs have been set up in Uganda: one in the Rakai district that focuses on HIV/AIDS, sexually transmitted infections and reproductive health; and one in the districts of Iganga and Mayuge that conducts research on non-communicable diseases and health systems. There has been no DSS-based study, in Uganda or elsewhere, exploring the types of disabilities, their causes, or impacts at the individual, family and societal levels. The aim of this study was to address the disability measurement gap in LMICs as described above by applying a new instrument to screen for physical disabilities at the Iganga and Mayuge Demographic Surveillance Site (IM-DSS) in Uganda. The specific objectives of the study were to obtain the overall prevalence of physical disabilities at the IM-DSS; to understand what types of disabilities are present at the IM-DSS; and to look into the risk factors associated with physical disability at the IM-DSS.
Methods
Design and population
The study was conducted at the IM-DSS in Uganda. The study population in the defined area is comprised approximately 12 000 households with a population of 66 372 at the time of the present study. Though predominantly rural, 20% of the IM-DSS population lives in the urban/periurban area around the city of Iganga.
The IM-DSS collects data on all individuals in the defined area four times a year. In addition to demographic data, the IM-DSS collects data on access to health services, causes of death and relevant socioeconomic and education data (G Pariyo, personal communication, 2007). No disability data were collected at the IM-DSS prior to this study.
This study was designed to carry out a disability assessment module through one round of data collection at the IM-DSS. The study instrument was administered at the household level during a regular round of data collection from February 2009 to April 2009 at the IM-DSS. Since the questions being asked required an assessment of specific activity limitations such as vision, hearing, and communication, those under the age of 5 years were excluded from the study.
Instrument
The Washington Group (WG) on Disability Statistics was established in 2001 under the auspices of the United Nations, and has put forth a short set of questions covering six functional domains—Vision, Hearing, Mobility, Self-Care, Cognition and Communication.21 While this set of questions has been developed for use in country censuses, the very properties that make them appropriate for that use—their brevity, clarity, and adaptability to different settings, makes it an appropriate candidate for use as a screening tool to identify individuals with disabilities within the DSS setting.
On the basis of International Classification of Functioning, Disability, and Health (ICF) framework,10 this instrument focuses on activity limitations as a means of identification of individuals with disabilities in the general population. This approach has been shown to be useful in previous studies aimed at identifying individuals with disabilities3 ,11 ,21 ,22 in defined populations, and is also consistent with a review of disabilities in communities in Uganda, including the district of Iganga, as seen from a recent qualitative study.23
The reliability and validity of the short set of questions, developed by the WG, have been tested in a variety of settings in several developing countries.8 ,24 ,25 The instrument has been found to be a valid and reliable way to assess functional limitations in individuals, regardless of the underlying disorder or cause of limitation.24
This study focused on physical disabilities. Thus, the final instrument used excluded the WG question on cognition and added one on upper-body mobility distinct from that of lower-body (legs). Each question had four response options: No difficulty, some difficulty, a lot of difficulty and cannot do at all. The reference time frame used for all questions was 4 months, consistent with IM-DSS data collection intervals.
The survey instrument was translated into local language (Lusoga) using a standard translation-back-translation protocol.26 Additionally, the translated instrument was pretested with local field workers to ensure accuracy of the translation process as well as clarity of the questions.
Scoring
The scores on each question range from a minimum of 0 (no difficulty), to a maximum of 3 (cannot do at all). In addition, individuals’ scores on each of the questions were summed up to get a total disability score. The range of possible total disability scores went from a minimum of zero (‘no difficulty’ on any of the domains), to a maximum of 18 (‘cannot do at all’ on all six questions).
The WG defines an individual to have a disability if she/he has a ‘significant limitation’ on at least one of the six domains, while other studies using the WG short set of questions characterise anyone answering ‘some difficulty’ on any one question or on at least two questions as being disabled.8 ,22 ,24 The WG has published recommendations for identifying an individual as disabled when using the short set in country censuses.27 Consistent with these recommendations, the following five cut-offs were examined in the current study:
-
A. Individuals answering at least ‘some difficulty’ on at least one domain
-
B. Individuals answering at least ‘some difficulty’ on at least two domains
-
C. Individuals answering at least ‘some difficulty’ on at least three domains
-
D. Individuals answering at least ‘a lot of difficulty’ on at least one domain.
-
E. Individuals answering at ‘cannot do at all’ on at least one domain.
For the purposes of this study, in order to get an accurate picture of the continuum of disabilities, disability was defined as at least ‘some difficulty’ on at least one domain (cut-off criteria A).
Data collection
The instrument was administered at the household level, to the head of the household or to the senior-most member of the household present at the time of the interview. Respondents provided information on all individuals in the household. Analysis was thus done at the individual level. Given the sensitivities and different interpretations of language used to describe disabilities, the following steps were taken during the first week of data collection to maintain the integrity of the data collection process and to assess the utility of the instrument
-
Field staff members were asked for input on the clarity and interpretation of each of the questions.
-
De-briefing sessions were held at the end of each day of data collection to share experiences and to assess how community members are interpreting the questions.
-
A member of the study team and the field supervisor observed randomly-selected interviews to ensure that they were being conducted appropriately.
-
A study team member and the field supervisor had an informal discussion with the respondent in the absence of the field assistant following the interview. This was done to get a sense of how the respondent perceived the questions being asked.
Statistical analysis
Analysis was done using MS Excel and Stata statistical software, V.11.28 The analysis of the burden of disability and associated risk factors involved using newly collected data as well as data on demographic and economic factors that the IM-DSS collects on a regular basis. Demographic data that the IM-DSS collects includes gender, age, marital status, household size and level of education. Analysis was first done separately for each question and all demographic characteristics.
Following cross-tabulations of the responses by the demographic variables, single and multivariable logistic regressions were used to examine the associations between disability and age, gender and SES.
Data on household possessions, occupation and income levels regularly collected by the IM-DSS were used to estimate socioeconomic status (SES). The IM-DSS used principal component analysis to develop an asset index as a proxy for SES. The first principal component was rank ordered and SES quintiles were created for each household.
Results
Demographic characteristics
Table 1 contains demographic data for the survey population. A total of 57 247 individuals 5 years of age and older were included in the survey. The sample was almost evenly split with regard to sex. Individuals under the age of 45 accounted for almost 90% of the surveyed population, whereas 72% were under the age of 30.
Description of the study population in IM-DSS, Uganda—individuals
For individuals 6–29 years old, data on their current education and working status was also obtained (table 1). This data were available for 12 280 individuals, most of whom (76%) were enrolled in some educational institution, with a majority of them (62%) in primary schools. Additionally, 8% of this population was engaged in some form of gainful employment, 74% of them being men.
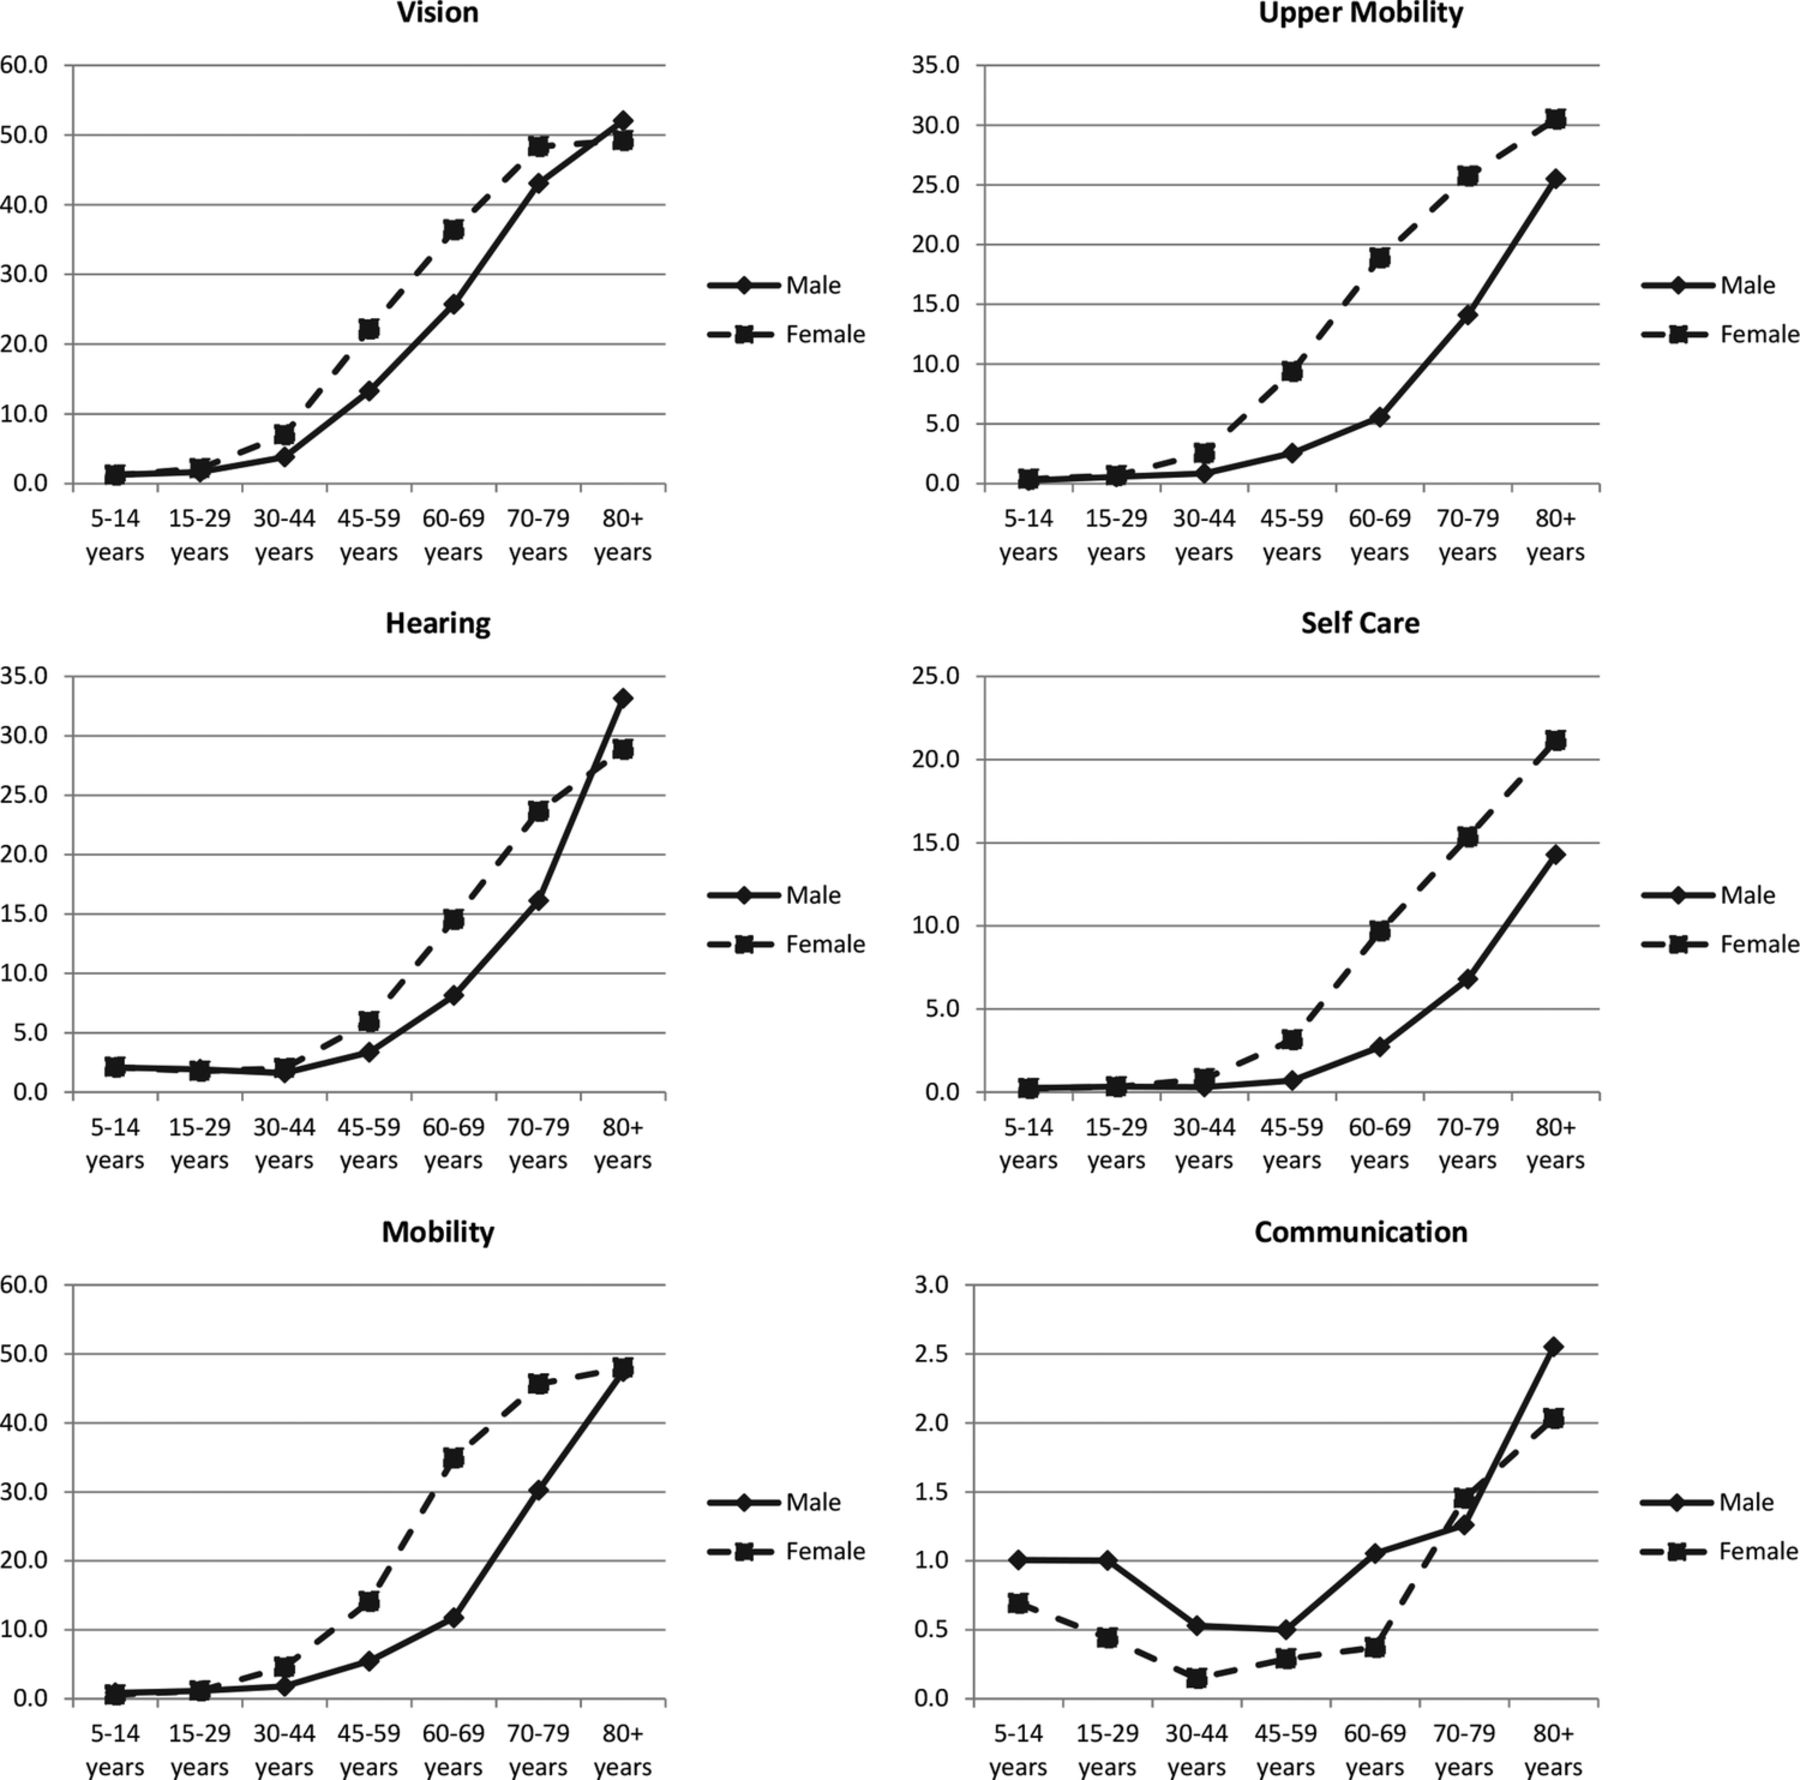
A comparison of the trends between the sexes by age for each domain is presented in figure 1. We plotted the proportion of individuals who reported some difficulty or more by age group and sex for each of the six domains. In general, women reported more limitations than did their male counterparts. The most common type of limitation reported among the study population was vision, with 4.2% of males and 6.1% of females reporting some difficulty or more. The least prevalent was communication with 0.9% of males and 0.5% of females reporting some difficulty or more on that domain. Problems with hearing were seen in 2.6% of males and 3.2% of females, whereas problems with mobility were reported in 2.4% of males and 4.5% of females. The difference in prevalence of limitations between men and women is generally greater in the middle-age groups (45–79 years) as compared to those in earlier or later on in life.

Proportion of individuals, by age group, who reported ‘some difficulty’ or more on each of the six domains.
The proportion of men reporting difficulty increases as the age increases, with vision, mobility and hearing being among the most prevalent limitations; the proportion of men reporting problems on these domains increases to 52%, 47.4% and 33.2%, respectively. A similar analysis for women reveals that as is the case with men, limitations increase as age increases, except that the most prevalent limitations in women are vision, mobility and hearing. The proportion of women reporting difficulty on these domains increases to 49.2% (vision), 48% (mobility) and 30.5% (upper body).
Generally, the proportion of individuals reporting some difficulty or more was higher in the lowest-wealth quintile as compared to the highest-wealth quintile on all the domains, except communication. For men, the difference across quintiles was more apparent on the vision, mobility, hearing and upper body domains. This was true for the women as well.
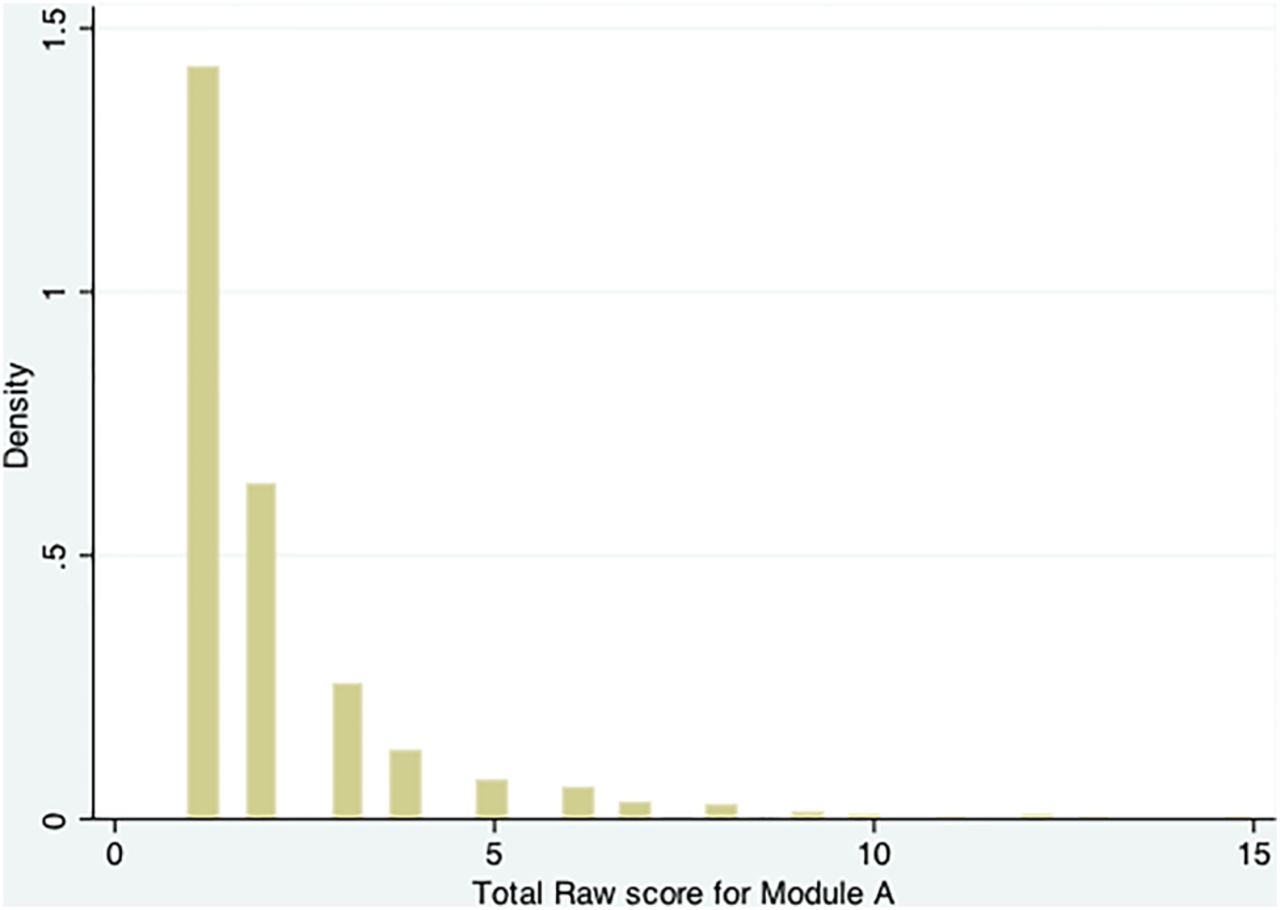
On the basis of scoring of each question, the minimum possible total score for the six domains was zero (no difficulty), with a maximum score of 18 (greatest amount of difficulty ‘cannot do at all’ on all six domains). In this study, the scores ranged from a minimum of 0 to a maximum of 15, with 9.43% of the study population having a total score of 1 or more (figure 2).
Histogram of total non-zero scores for all individuals.
Individuals were then classified, disabled or not, based on the five cut-offs for disability status outlined above. Table 2 shows the distribution of individuals based on the five disability categories. A 9.4% of the study population reported some difficulty or more on at least one domain, and 4.3% reported some difficulty or more on at least two domains. The proportion of individuals reporting at least some difficulty on three or more domains was 2.1%, with 2.5% of the study population reporting at least a lot of difficulty on one or more domains. A 0.3% of the study population reported ‘cannot do at all’ on at least one domain. With the exception of cut-off criteria E, women had a higher prevalence of disability as compared to men in all the categories of disability explored.
Disability status based on five different cut-off criteria
For the rest of the analysis, cut-off criteria ‘A’ was used as the definition of disability. On the basis of this definition, the prevalence of disability at the IM-DSS was 9.4%, with the prevalence among males being 8.2%, and 10.6% among females. Analysis by age revealed that the prevalence of disability increased with an increase in age for males and females ranging from a low of 4.2% among females aged 5–14 years to a high of 65.3% among males, 80 years and older.
There was an inverse relationship between disability and household wealth, where the prevalence of disability decreases with increases in household wealth. The prevalence of disability ranged from a low of 7% among males in the highest-wealth quintile to a high of 19.3% among females in the lowest-wealth quintile.
Single and multivariable logistic regression analysis was done to assess the association between disability and sex, age and wealth status. Results from this analysis are presented in table 3. Sex had a statistically significant association with disability, with men having 25% fewer odds of being disabled as compared to women (OR 0.75; 95% CI 0.71 to 0.79; p<0.001). This effect remained unchanged even after adjustment for age and wealth status (OR 0.75; 95% CI 0.71 to 0.81; p<0.001).
Unadjusted and adjusted analysis of disability by sex, age and wealth status
Analysis by age revealed a statistically significant association of age with disability. Older individuals were more likely to be disabled as compared to younger individuals (table 3). The OR of being disabled was 37.4 (95% CI 30.5 to 45.86; p<0.001) for individuals over the age of 80 as compared to those between 5 and 14 years old. The effect of age remained unchanged after adjustment for sex and SES.
A statistically significant association was also found between SES and disability, where the likelihood of being disabled decreased as household wealth status increased (table 3). Those in the highest-wealth quintile had 53% fewer odds of being disabled as compared to individuals in the lowest-wealth quintile (OR 0.47; 95% CI 0.43 to 0.52; p<0.001). While the association between SES and wealth remained statistically significant even after adjustment for sex and age, the effect of wealth status after this adjustment appeared to be smaller. The adjusted OR of being disabled for individuals in the highest wealth quintile was 0.74 (95% CI 0.66 to 0.83; p<0.001) as compared to those in the lowest quintile.
When the same analysis was repeated for more severe disabilities, a greater association of sex, age and wealth status was observed. This was especially true for age and wealth status, where the adjusted analysis revealed that the OR of being disabled was 69.66 (95% CI 55.11 to 88.06; p<0.001) for individuals over 80 years of age as compared to those between the ages of 5 and 14. The adjusted OR of being disabled for those in the highest SES quintile as compared to those in the lowest quintile was 0.52 (95% CI 0.45 to 0.61; p<0.001).
Following this analysis, we examined the contribution of the different domains to disability in this study population. Overall, among the disabled individuals, vision, mobility and hearing were top three limitations reported, with communication and self-care being among the least common. An analysis by age revealed a changing pattern of limitations reported as individuals’ age. In the youngest age group (5–14 years) hearing, vision and communication were the most common types of limitations reported, with 47% of disabled individuals reported problems with hearing. Hearing remained among the top three contributors, until the age of 44. For individuals with disabilities between the ages of 45 and 79, vision, mobility and upper body were the top three problems reported.
Discussion
This study assessed the prevalence and types of disability present at the Iganga-Mayuge Demographic Surveillance System in Eastern Uganda. Results show that the modified short set of questions can be readily applied in a DSS setting and may be used to screen for disability, providing estimates that are comparable across different regions and populations. The instrument is short, easy to use and takes between 5 and 10 min to administer per household. A number of DSS now exist in LMICs, and serve as a valuable source of population level data within resource constraints.17 ,29 These sites collect longitudinal data on the populations they cover, which in the case of disability would be invaluable to understanding the life course of different types of disabilities as well as the association of disability with other variables such as health seeking and SES among others.
On the basis of criteria used to define disability for this study, 9.4% of the population in the IM-DSS was disabled. Compared to previous estimates of the prevalence of disability in Uganda, this estimate is much higher. The Uganda national census conducted in 2001 reported a prevalence of 4%, whereas the Uganda National Household Survey of 2005 found a prevalence of disability of 7%.5 ,7 The prevalence of disability found in this study is comparable to the 11% prevalence found in a study done in Zambia that used a similar instrument and cut-off to assess disability.22 However, it is important to note that the instrument used in this study focused on physical disability and did not capture cognition or mental health.
Generally, the overall prevalence of disability was greater among women than men. Given the traditional role of women in this setting, this is bound to have multiple potential consequences on the status of women in the society.30 This age range represents women whose primary duties may be to take care of the home, work on the family plot growing food to feed the family, and care for their children as well as other family members. Being unable to fulfil these duties, and the stigma associated with disability, may render them vulnerable and have a significant impact on their well-being and status in the family.
Age, as expected, was significantly associated with disability. Older individuals were more likely to report limitations as compared to younger individuals in the society. Given that the study population was largely composed of younger individuals, this may explain the lower than expected overall prevalence of disability seen in this study. Uganda and other countries in the developing world have a similar population structure with their population pyramids having a very wide base and a narrow tip. With advances in health, and as health systems in these countries become more efficient and health services are available to more individuals, mortality is likely to decline. This is likely to result in an increase in the life expectancy and ultimately an increase in the older population, potentially leading to a higher prevalence of disability in the population.31–34 Information on the types of disabilities affecting the older population, and for that matter, the population in general, is thus valuable for policymakers and programme planners for guiding resources to either prevent these disabilities or mitigate their effects on individuals, families and the society.
Our study also confirms findings from previous studies that link poverty and disability.2 ,23 ,33 ,35 ,36 We found a strong association between disability and SES, especially in the case of more severe disabilities. However, it remains unclear whether disability leads to decreased wealth due to decreased economic productivity of the disabled individual or other members, or whether poverty leads to increased disability due to the lack of access to healthcare services.
Use of this set of questions as a screening tool should, however, be done with caution.27 First, aforementioned, the instrument does not cover mental health; and second, due to the nature of the questions, they are not suitable for children under the age of 5. As such, assessment of the prevalence of disability obtained using this instrument is likely to underestimate the true prevalence of disability in the society.
Another limitation of this study lies in the focus on households to collect data on disabilities. This study involved interviewing the senior-most member of the household present at the time of the visit, and sought information on activity limitations for all members of the household. This has the potential of introducing reporting bias, where the respondent, who is more aware of his/her own limitations, tends to report those more than for the other members of the household. Furthermore, the interviews took place on weekdays, where most men would likely be out at work, and the respondent would either be the senior-most woman present, or a male head of household, who is not at work for any reason.
Further research on the disabled population identified in this study is necessary in order to characterise their conditions, understand the underlying causes of their limitations as well as design programmes and interventions that will alleviate the burden of disability in the population. Data collected as part of this study could be used to inform decisions on programme design and implementation at the district level in the Iganga and Mayuge districts of Uganda.
Acknowledgments
The authors would like to acknowledge the contributions of the Late Dr Richard H. Morrow MD MPH, who provided invaluable insights, support and guidance throughout the design and implementation of this study.
Footnotes
-
Contributors AMB conceived and designed the study; led the analysis and interpretation of the data; drafted the manuscript and made subsequent revisions. EG, DK made substantial contributions to the acquisition of data; revising the article critically for important intellectual content; gave approval of the version to be submitted. JAB made substantial contributions to editing and revising the article critically for important intellectual content; gave approval of the version to be submitted. DB made substantial contributions to conception and design; substantial contributions to the analysis and interpretation of the data; revising the article critically for important intellectual content; gave final approval of the version to be submitted. SW made substantial contributions to conception and design; revising the article critically for important intellectual content; gave final approval of the version to be submitted. AAH conceived and designed the study; made substantial contributions to the analysis and interpretation of the data; revising the article critically for important intellectual content; gave final approval of the version to be submitted.
-
Funding Support for this study was provided by the Center for Global Health, Johns Hopkins University.
-
Competing interests None.
-
Ethics approval This study was reviewed and approved by the Institutional Review Boards at Johns Hopkins Bloomberg School of Public Health, Makerere University School of Public Health, and Uganda National Council for Science and Technology.
-
Provenance and peer review Not commissioned; externally peer reviewed.
-
Data sharing statement No additional data are available.