Article Text

Abstract
Objective To clarify and quantify the potential dose–response association between the intake of fruit and vegetables and risk of type 2 diabetes.
Design Meta-analysis and systematic review of prospective cohort studies.
Data source Studies published before February 2014 identified through electronic searches using PubMed and Embase.
Eligibility criteria for selecting studies Prospective cohort studies with relative risks and 95% CIs for type 2 diabetes according to the intake of fruit, vegetables, or fruit and vegetables.
Results A total of 10 articles including 13 comparisons with 24 013 cases of type 2 diabetes and 434 342 participants were included in the meta-analysis. Evidence of curve linear associations was seen between fruit and green leafy vegetables consumption and risk of type 2 diabetes (p=0.059 and p=0.036 for non-linearity, respectively). The summary relative risk of type 2 diabetes for an increase of 1 serving fruit consumed/day was 0.93 (95% CI 0.88 to 0.99) without heterogeneity among studies (p=0.477, I2=0%). For vegetables, the combined relative risk of type 2 diabetes for an increase of 1 serving consumed/day was 0.90 (95% CI 0.80 to 1.01) with moderate heterogeneity among studies (p=0.002, I2=66.5%). For green leafy vegetables, the summary relative risk of type 2 diabetes for an increase of 0.2 serving consumed/day was 0.87 (95% CI 0.81 to 0.93) without heterogeneity among studies (p=0.496, I2=0%). The combined estimates showed no significant benefits of increasing the consumption of fruit and vegetables combined.
Conclusions Higher fruit or green leafy vegetables intake is associated with a significantly reduced risk of type 2 diabetes.
This is an Open Access article distributed in accordance with the Creative Commons Attribution Non Commercial (CC BY-NC 4.0) license, which permits others to distribute, remix, adapt, build upon this work non-commercially, and license their derivative works on different terms, provided the original work is properly cited and the use is non-commercial. See: http://creativecommons.org/licenses/by-nc/4.0/
Statistics from Altmetric.com
Strengths and limitations of this study
-
To the best of our knowledge, this is the largest systematic review and meta-analysis on the intake of fruit and vegetables and risk of type 2 diabetes. We also investigated a dose–response relation between fruit, vegetables, or fruit and vegetables combined consumption and risk of type 2 diabetes.
-
The possibility of residual confounding or confounding by unmeasured factors, which cannot be ruled out in any observational study, must be acknowledged. We cannot exclude the possibility of recall bias in the assessments of diet based on the food frequency questionnaires.
-
Health expenditure on type 2 diabetes is increasing worldwide.
-
Epidemiological studies suggest that the intake of fruit and vegetables is beneficial in delaying or preventing the development of type 2 diabetes, though results from cohort studies are controversial.
-
Higher fruit or vegetables, particularly green leafy vegetables intake, is associated with a significantly reduced risk of type 2 diabetes.
-
Dose–response analyses indicated a 6% lower risk of type 2 diabetes per 1 serving/day increment of fruit intake and a 13% lower risk of type 2 diabetes per 0.2 serving/day increment of green leafy vegetables intake.
-
Further evidence from preferably randomised controlled studies should explore what kind of fruit or green leafy vegetables can reduce the risk of type 2 diabetes.
-
Introduction
Type 2 diabetes (T2D) is one of the most common non-communicable diseases which is expected to affect in excess of 439 million adults worldwide by 2030,1 with serious consequences for healthcare expenditure.2 It has been estimated that the global health expenditure on diabetes is at least $376 billion in 2010 and will be $490 billion in 2030,3 which creates a major public health burden. The prevention of T2D is thus clearly an important public health priority. In recent decades, concern has mounted regarding the premature mortality and morbidity associated with T2D, with growing interest in altering risk factors and reversing this global epidemic. Among the known risk factors for T2D, dietary factors have aroused particular attention. Lifestyle intervention trials that include dietary modification have been shown to be effective in delaying or preventing the development of T2D.4 Although the effect of individual components or interactions between nutrients is still largely unknown, fruit and vegetables intake may explain some of this beneficial effect.5
To minimise the risk of dietary factors and reduce the incidence of T2D, the WHO has recommended the public for consuming more than 400 g or five portions of combined fruit and vegetables per day to prevent T2D.6 Nevertheless, in the Japan Public Health Center-based Prospective (JPHC) Study,7 after a mean follow-up over 5 years, participants with the intake of fruit and vegetables may not be appreciably associated with the risk of T2D. Vegetables, especially green leafy vegetables (GLV), have been suggested to explain an apparent beneficial effect on T2D. In addition, several meta-analyses of observational studies have found that an increase in the daily intake of GLV could significantly reduce the risk of T2D.5 ,8 ,9 These studies were restricted by heterogeneity with respect to sample size. Additionally, recent studies involving a relationship between the intake of fruit and vegetables and the risk of T2D have been published from then on.5 ,7 ,10 ,11 Furthermore, whether any dose–response relation exists between the intake of fruit and vegetables and the risk of T2D is unknown. Therefore, we systematically reviewed and meta-analysed available studies to quantify the associations between dietary intake of fruit and vegetables and incidence of T2D based on identified prospective cohort studies. We pooled risk estimates for the highest versus lowest category of intake to examine the overall association. We also conducted a dose–response analysis for the trend estimation.
Methods
Search strategy
We carried out a systematic search of PubMed (MEDLINE) and Embase through February 2014 for prospective cohort studies examining the association between the intake of fruit and vegetables and risk of T2D. The following key words were used in our search strategies: (‘fruits’ OR ‘vegetables’ OR ‘citrus’) AND (‘Type 2 diabetes’ OR ‘non-insulin-dependent diabetes mellitus’ OR ‘Diabetes Mellitus, Type 2’ OR ‘NIDDM’ OR ‘prediabetes’ OR ‘impaired glucose tolerance’ OR ‘impaired fasting glucose’ OR ‘glucose’ OR ‘hyperglycaemia’ OR ‘insulin’) AND (‘Follow-up studies’ OR ‘prospective studies’ OR ‘cohort studies’ OR ‘longitudinal studies’). We restricted the search to human studies. No language restrictions were imposed. In addition, we scrutinised possible eligible references from relevant original papers and review articles to identify potential publications. We followed standard criteria for the performing and reporting of the meta-analyses of observational studies.12
Study selection
Citations selected from the initial search were subsequently screened for eligibility. Studies were included in this meta-analysis if they satisfied the following criteria: (1) original studies (eg, not review articles, meeting abstracts, editorials or commentaries); (2) prospective design (eg, not cross-sectional design, case-control design); (3) the exposure of interest was the intake of fruits, vegetables, or fruit and vegetables combined; (4) the outcome was T2D and (5) reported multivariate-adjusted risk estimates for the association between the fruit, vegetables, or fruit and vegetables combined, assessed as dietary intake, and T2D. Additionally, we excluded animal studies and letters without sufficient data. If data were reported more than once, we included the study with the longest follow-up time.
Validity assessment
Two authors (ML and YF) independently assessed all studies for quality using a modified scoring system, which allowed a total score from 0 to 6 points (6 reflecting the highest quality) on the basis of MOOSE (Meta-analysis Of Observational Studies in Epidemiology),12 QUATSO (quality assessment tool for systematic reviews of observational studies),13 and STROBE (Strengthening the Reporting of Observational Studies in Epidemiology).14 The system was created to account for study eligibility (1 point for appropriate inclusion and exclusion criteria), outcome (1 point if diagnosis of T2D was based on accepted clinical criteria, and not solely based on self-report), exposure (1 point if fruit and vegetables consumption was assessed with a validated tool, and 1 point if fruit and vegetables consumption was appropriately categorised), statistical analysis (1 point was given if adjustment included a few variables such as age, sex, body mass index and family history of T2D, these being proven risk factors for T2D). Another point was given if any other factors were adjusted (such as alcohol, education and physical activity).9
Data extraction
Data extractions were carried out independently by two other authors (XZ and WH) using standard electronic sheets and cross-checks to reach a consensus. For each study, the following information was abstracted: name of the first author, publication year, study population, geographical location, sex, age range, sample size (number of T2D cases, number of non-T2D cases and number of participants), duration of follow-up, methods used to assess fruit and vegetables intake and ascertain T2D cases, highest and lowest intake of fruit and vegetables, and covariates adjusted for in the multivariable model. Study quality was evaluated by using the modified scoring system. All data were extracted from the published papers. If necessary, the primary authors were contacted to retrieve further information. For two studies that expressed data separately for men and women,7 ,15 including one study that included data from multiple cohorts,11 we considered the analysis for each sex or cohort as an independent comparison and extracted data separately.
Statistical analysis
Within each study, we used multivariate-adjusted outcome data (expressed as relative risks and 95% CIs) for risk estimates. For the present analyses, we assumed HRs to be a valid approximation of relative risks and converted these values in every study by taking their natural logarithms and calculating SEs and corresponding 95% CIs. Relative risks and their SEs were pooled with the DerSimonian and Laird random effects model, which takes into account both within-study and between-study variabilities.16 When some studies included in our meta-analysis used different measurement units (eg, grams per day or portions per day or servings per day),5 ,10 ,15 we standardised fruit and vegetables intake into servings per day using a standard portion size of 106 g.17 As different studies might use different exposure categories (thirds, quarters or fifths),7 ,11 ,15 we used the study-specific relative risk for the highest versus lowest category of fruit, vegetables, or fruit and vegetables intake for the meta-analysis. For the dose–response analysis, the generalised least square for trend estimation method described by Greenland and Longnecker18 and Orsini et al19 ,20 was used to calculate study-specific slopes (linear trends) and 95% CIs. The method requires the distributions of cases and person years for exposure categories, and median/mean of fruit, vegetables, or fruit and vegetables intake levels for each comparison group. We assigned the midpoint of the upper and lower boundaries of each comparison group to determine mean fruit, vegetables, or fruit and vegetables intake levels if the median or mean intake was not provided. When the highest category was open ended, we assumed that the average of the category was set at 1.5 times the lower boundary. Additionally, we first created restricted cubic splines with 4 knots at 5th, 35th, 65th and 95th centiles of the distribution.21 A p value for non-linearity was calculated by testing the null hypothesis that the coefficient of the fractional polynomials component is equal to zero. Heterogeneity among studies was evaluated using the χ2 test based on Cochran's Q test and I2 statistic at the p<0.10 level of significance,16 and quantification of heterogeneity was made by the I2 metric, which describes the percentage of total variation in point estimates that is due to heterogeneity rather than chance.22 We considered low, moderate and high degrees of heterogeneity to be I2 values of 25%, 50% and 75%, respectively. To explore possible explanations for heterogeneity and to test the robustness of the association, we conducted subgroup analyses based on the location (Asia vs Non-Asia), the quality of the study (high quality (≥4) vs lower quality (<4)), length of follow-up (≥10 years vs <10 years), sex (male and female included vs female only vs male only), fractions of intake (thirds, quarters or fifths), number of participants (≥50 000 vs <50 000), and number of cases (≥1000 vs <1000). We also performed the Begg rank correlation test and Egger's regression test to visualise a possible asymmetry.23–25 All the statistical analyses were performed in Stata V.12 (StataCorp, College Station, Texas, USA). A threshold of p<0.1 was used to decide whether heterogeneity or publication bias was present.24 In other ways, p values were two-sided and p<0.05 was considered statistically significant.
Results
Literature search
Figure 1 shows the results of literature research and selection. We identified 308 articles from PubMed and 365 articles from Embase. After exclusion of duplicate records and studies that did not fulfil our inclusion criteria, 27 articles remained, and we further evaluated the full texts of these 27 publications. Of these, we excluded 17 studies as follows. Five articles were excluded owing to lack of sufficient data for estimation of relative risks.26–30 Five articles were excluded because no original data could be extracted (review, type 1 diabetes or cross-sectional studies).31–35 Another four articles were excluded because we deemed them to be irrelevant.36–39 We also excluded three articles because they did not give enough details on fruit, vegetables, or fruit and vegetables intake to warrant inclusion within the meta-analysis.40–42 Finally, 10 articles met the inclusion criteria and were included in the meta-analysis.5 ,7 ,10 ,11 ,15 ,43–47 Among these articles, two studies provided information on males and females separately;7 ,11 the article by Cooper et al was divided into two studies (study a:2012 and study b:2012); and another paper reported data from two independent cohorts.15 Thus, our meta-analysis included 13 comparisons.
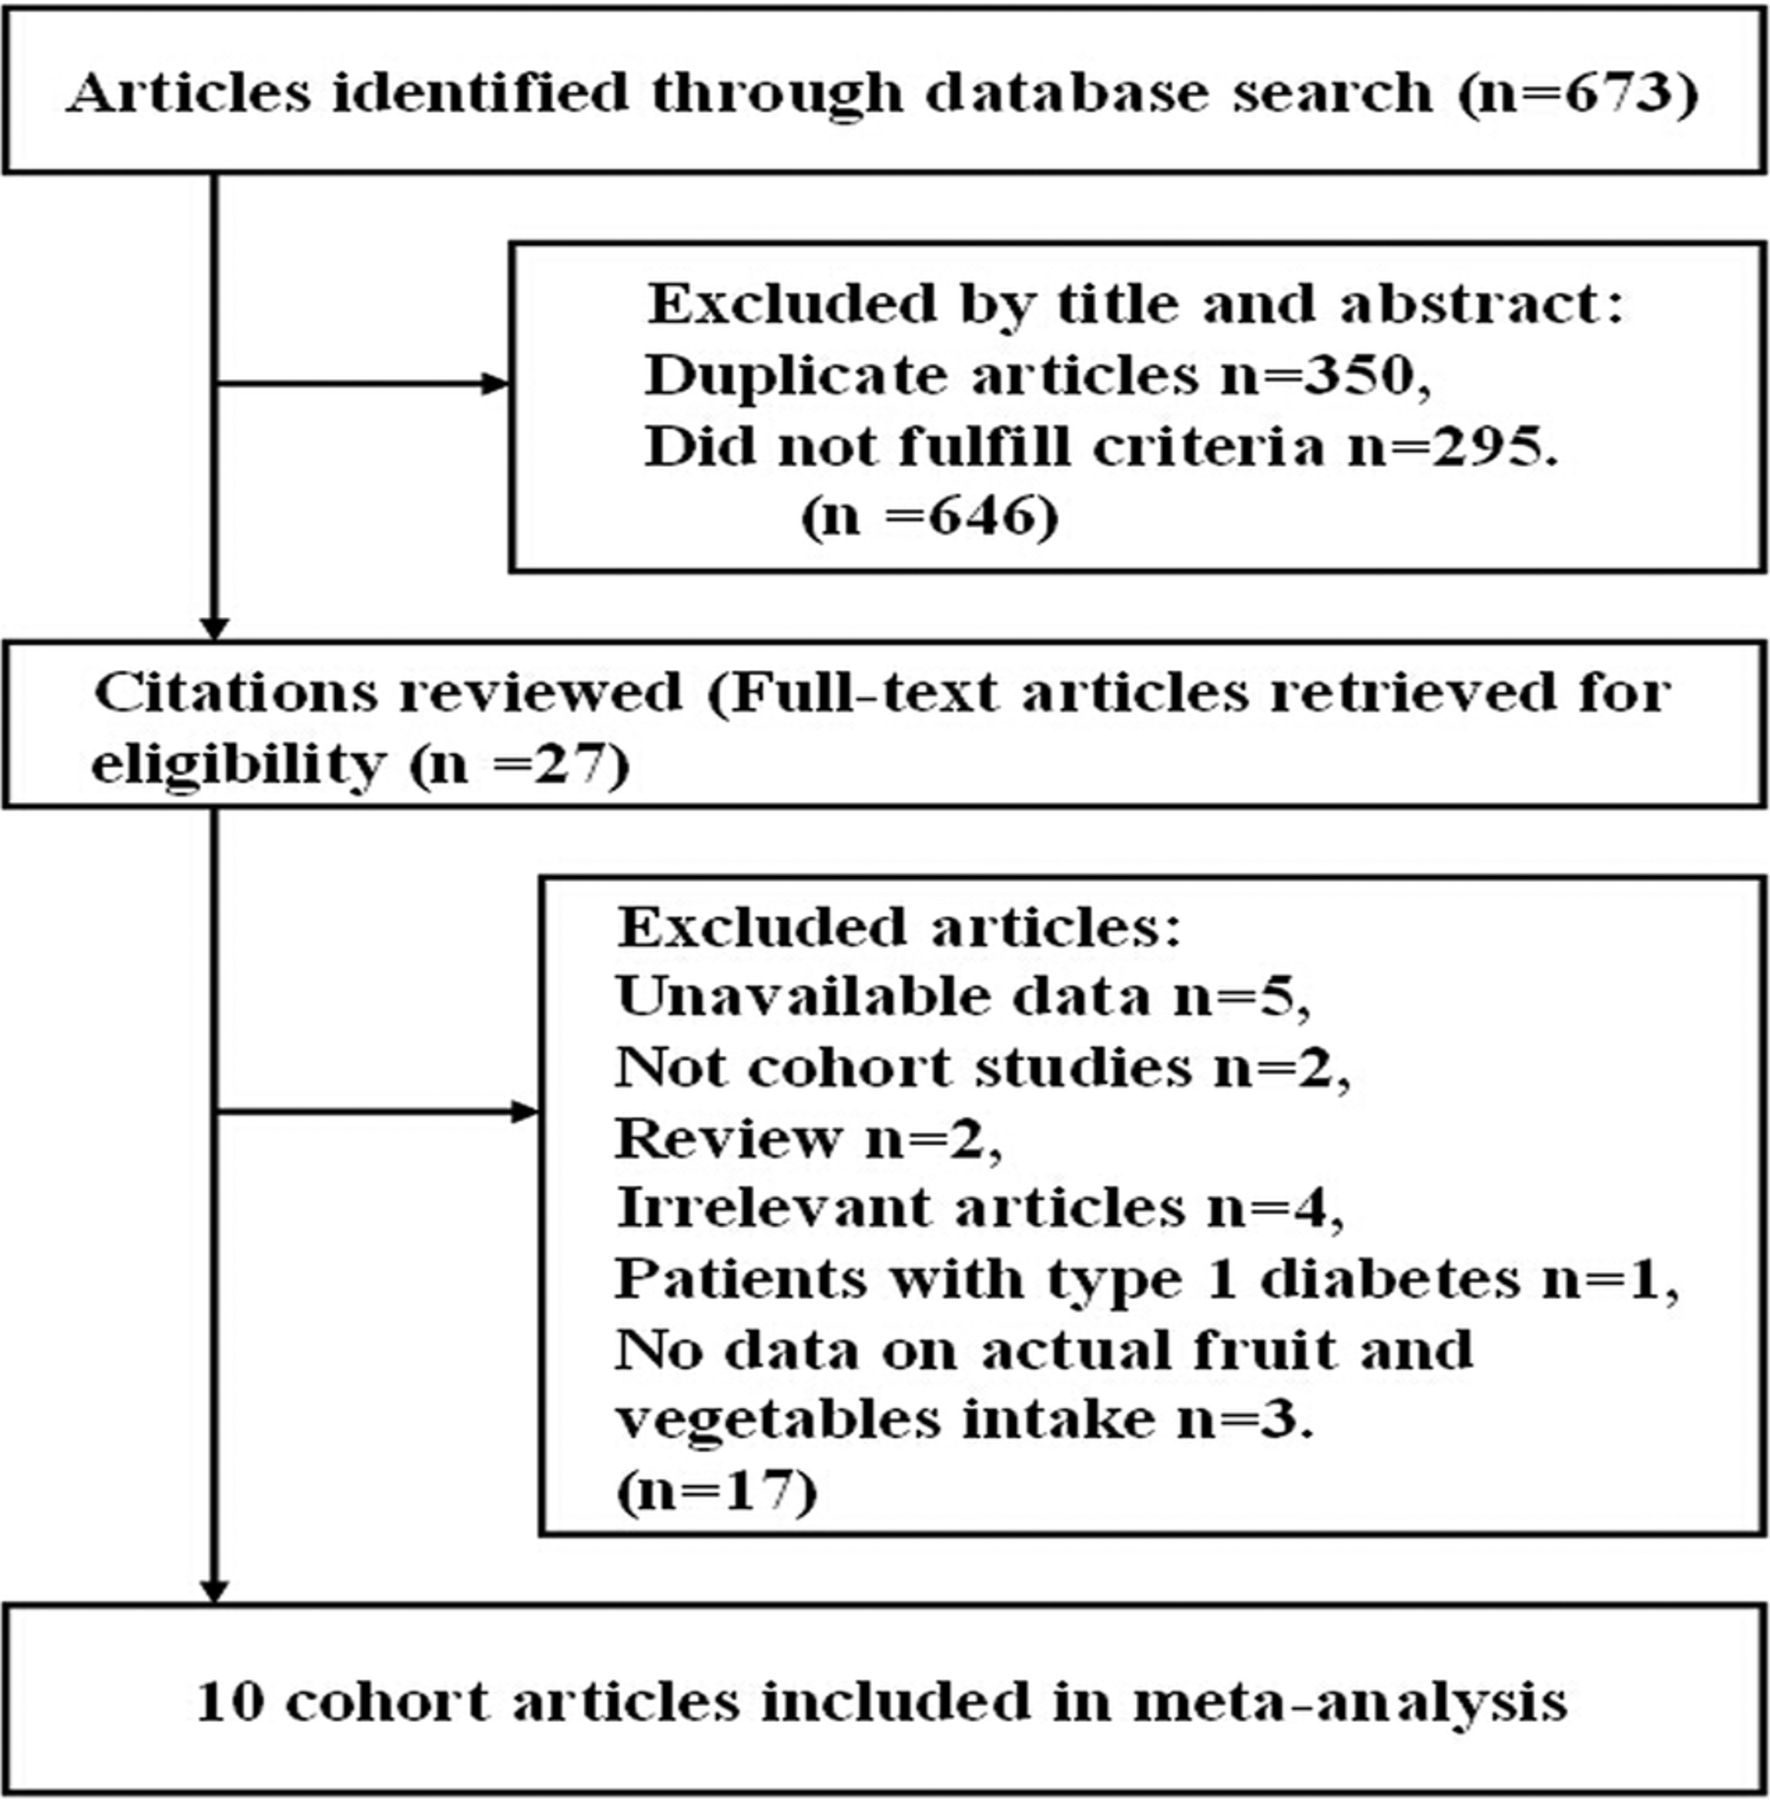
Process of literature search and study selection.
Study characteristics
Online supplementary tables A and B (appendix 1) show the characteristics extracted from the included studies; all 10 articles were prospective cohort designs and participants who were free of self-reported diabetes at baseline.5 ,7 ,10 ,11 ,15 ,43–47 In aggregate, the included studies consisted of 434 342 participants. Among the participants, we documented 24 013 cases of T2D which occurred during follow-up periods ranging from 4.6 to 23 years (median of 11 years). Five cohorts were conducted primarily in the USA,11 ,15 ,43 ,44 ,47 two in Asian countries (China and Japan)7 ,46 and three in European countries.5 ,10 ,45 The number of participants ranged from 3704 in the European Prospective Investigation into Cancer and Nutrition (EPIC) Norfolk study by Cooper et al10 to 91 246 in the Nurses’ Health Study II by Muraki et al.11 Five studies included both male and females,5 ,7 ,10 ,15 ,45 four studies included only females.43 ,44 ,46 ,47 One article by Muraki et al11 reported two independent cohorts; one cohort included only females, and another included only males. The age of participants ranged from 24 to 79 years. Six papers provided information on fruit and vegetables intake separately and combined,5 ,7 ,10 ,43 ,44 ,47 two papers provided information on fruit and vegetables intake separately,45 ,46 one paper provided only the combined data,15 and another paper provided separate data on fruit.11 Five papers also included separate data on the intake of GLV.5 ,7 ,44–46 In most papers, the intake of fruit and vegetables was divided into fifths.11 ,43–47 All studies provided adjusted risk estimates; results of study quality assessment (score 0–6) showed that most studies yielded a score of 3 or below (low quality).
Fruit intake and risk of T2D
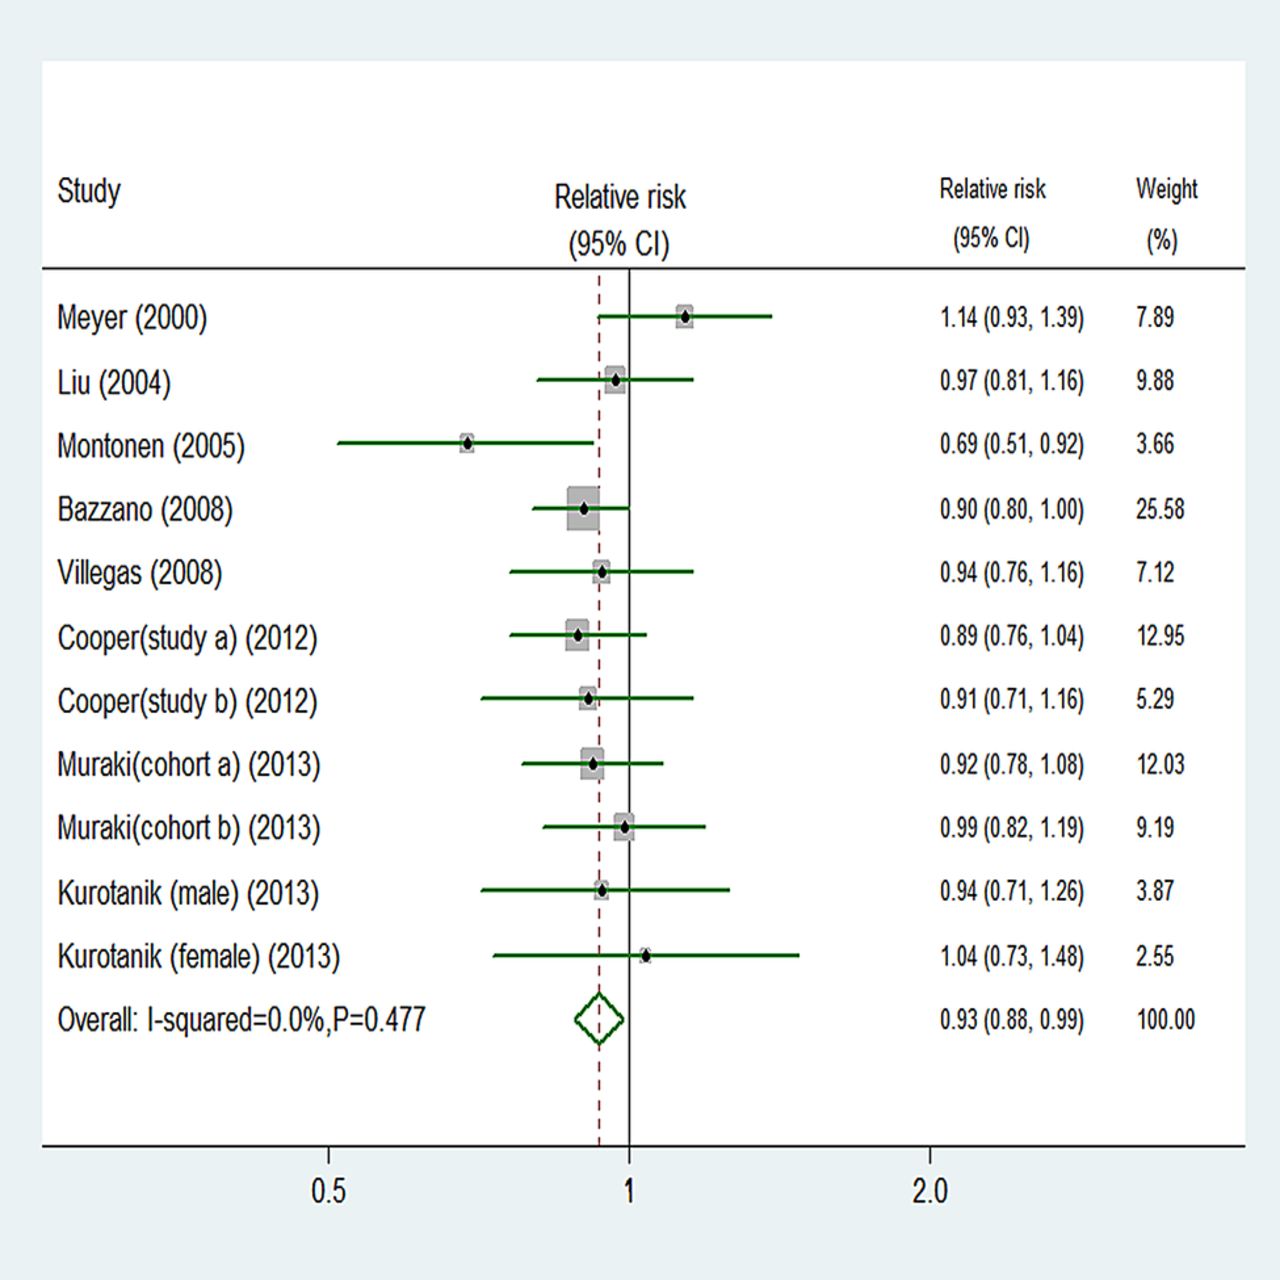
Eleven comparisons from nine studies reported an association between fruit intake and risk of T2D, with 22 995 T2D outcomes and 424 677 participants. Overall, fruit intake was inversely associated with risk (relative risk 0.93, 95% CI 0.88 to 0.99; figure 2). We saw no heterogeneity among studies (p=0.477, I2=0%). Additionally, no evidence of substantial publication bias was observed from the Begg (p=0.533) and Egger regression tests (p=0.849; see online supplementary table B in appendix 1). Among 11 comparisons, 7 were eligible for the dose–response analysis of fruit intake and risk of T2D. Using a restricted cubic splines model, we found a mild curvilinear association (p=0.059 for non-linearity, figure 3). Dose–response analysis indicated that a 1 serving/day increment of fruit intake was associated with a 6% lower risk of T2D (relative risk 0.94, 95% CI 0.89 to 1.00, I2=0%; see online supplementary figure A in appendix 2).

Random effects analysis of fully adjusted studies for highest versus lowest intake of fruit and risk of type 2 diabetes.

Dose–response analyses of fruit intake and risk of type 2 diabetes.
Vegetables intake and risk of T2D
Eight studies exported an association between vegetables intake and risk of T2D, with 20 933 T2D outcomes and 290 927 participants. Using a random effects model summarising all nine comparisons, we found no association between vegetables intake and risk (relative risk 0.90, 95% CI 0.80 to 1.01; figure 4). There was moderate study heterogeneity (p=0.002, I2=66.5%). However, no evidence of substantial publication bias was observed from the Begg (p=0.602) and Egger regression tests (p=0.176; see online supplementary table B in appendix 1). Among nine comparisons, five were eligible for the trend estimation. Dose–response analysis found no association with risk of T2D per 1 serving/day increment of vegetables intake (relative risk 0.98, 95% CI 0.89 to 1.08, I2=45.8%; see online supplementary figure B in appendix 2). No publication bias was observed (p=0.117). We found no evidence of a curve linear association between vegetables intake and risk (p=0.671 for non-linearity, see online supplementary figure C in appendix 2).

Random effects analysis of fully adjusted studies for highest versus lowest intake of vegetables and risk of type 2 diabetes.
Fruit and vegetables intake and risk of T2D
Information on fruit and vegetables intake and T2D were available in nine comparisons from seven prospective studies, totalling 20 672 T2D outcomes and 232 097 participants. Overall, fruit and vegetables intake was not associated with risk (relative risk 0.94, 95% CI 0.86 to 1.03; see online supplementary figure D in appendix 2). We saw no heterogeneity among studies (p=0.141, I2=34.6%). Additionally, no evidence of substantial publication bias was observed from the Begg (p=0.348) and Egger regression tests (p=0.609; see online supplementary table B in appendix 1). Among nine comparisons, six were eligible for the dose–response analysis of fruit and vegetables intake and risk of T2D. We did not find a significant curvilinear association (p=0.456 for non-linearity, see online supplementary figure E in appendix 2). Dose–response analysis showed no association between risk of T2D and a 1 serving/day increment of fruit and vegetable intake (relative risk 0.96, 95% CI 0.86 to 1.07, I2=47.6%; see online supplementary figure F (appendix 2)).
GLV intake and risk of T2D
Seven comparisons from six studies reported an association between GLV intake and risk of T2D, with 19 139 T2D outcomes and 251 235 participants. Overall, GLV intake was inversely associated with risk (relative risk 0.87, 95% CI 0.81 to 0.93; figure 5). No significant heterogeneity was detected among studies (p=0.496, I2=0%). Additionally, we did not observe evidence of substantial publication bias (Begg and Egger regression tests, p=0.133 and p=0.101, respectively; see online supplementary table B in appendix 1). Among seven comparisons, only three comparisons were eligible for the trend estimation. Using a restricted cubic splines model, we found a significant curvilinear association (p=0.036 for non-linearity, figure 6). Dose–response analysis indicated that a 0.2 serving/day increment of GLV intake was associated with a 13% lower risk of T2D (relative risk 0.87, 95% CI 0.76 to 0.99, I2=20.9%; see online supplementary figure G in appendix 2). No publication bias was observed (p=0.282).

Random effects analysis of fully adjusted studies for highest versus lowest intake of green leafy vegetables and risk of type 2 diabetes.

Dose–response analyses of green leafy vegetables intake and risk of type 2 diabetes.
Subgroup analyses
To examine the stability of the primary results, we carried out subgroup analyses (table 1). The association between fruit, vegetables, or fruit and vegetables intake and risk of T2D was similar in subgroup analyses, which were separately defined; study quality, length of follow-up, sex, location, number of cases or participants, and whether the different ways in which authors had grouped intake (thirds, quarters or fifths) affected the results. The summary estimates of relative risks from each category were pooled (see online supplementary table B in appendix 1). We paid close attention to the highest versus lowest category. Almost all subgroups that analysed intake of GLV showed a benefit of consuming greater quantities (figure 5). Online supplementary table B in appendix 1 also showed significant reductions in risk of T2D events for consumption of fruit, vegetables, or fruit and vegetables combined.
Subgroup analyses to investigate differences between studies included in meta-analysis (highest vs lowest category)
Discussion
In this meta-analysis, dietary intake of fruit, vegetables, and GLV, but not fruit and vegetables combined, were associated with a lower risk of T2D. Dose–response analyses indicated a 6% lower risk of T2D per 1 serving/day increment of fruit intake and a 13% lower risk of T2D per 0.2 serving/day increment of GLV intake, but no significant trend for vegetables or fruit and vegetables combined.
Results in relation to other studies
Over the past decades, extensive prospective studies have reported the association of fruit, vegetables, or fruit and vegetables combined with T2D risk.5 ,7 ,10 ,11 ,15 ,43–47 However, the role of dietary factors in T2D is still controversial. Some of the studies failed to find an association between fruit intake or fruit and vegetables combined and risk of T2D.8 ,43 Bazzano et al47 analysed data from 11 different US states with 18 years of follow-up. They found that consumption of fruit was associated with a lower risk of diabetes, but no significant association for total fruit and vegetable consumption. Similar to previous analysis in the Nurses’ Health Study, the results from three prospective longitudinal cohort studies also supported an inverse association between fruit intake and risk of T2D.11 However, these studies have a potential for bias due to measurement error. In addition, two cohort studies have suggested an inverse association between total fruit and vegetables consumption and risk of T2D.10 ,15
A few large cohort studies have found an inverse association between vegetables consumption, especially GLV, and risk of T2D.10 ,44–46 These findings all agreed with two meta-analyses.5 ,9 However, another systematic review based on five cohort studies suggested that there was no protective association between vegetables intake and T2D.8
Several plausible biological mechanisms have been proposed to explain the aforementioned association. Fruit and vegetables are rich in fibre,48 which has been shown to improve insulin sensitivity and insulin secretion to overcome insulin resistance.49 However, meta-analyses showed that fruit and vegetable fibre is inconsistently associated with the risk of T2D.50 On the other hand, it may contribute to a decreased incidence of T2D through their low-energy density and glycaemic load, and high micronutrient content.51 In particular, GLV are rich in bioactive phytochemicals (such as vitamin C and carotenoids), which are known for their antioxidant properties.52–54 Antioxidants in fruit and vegetables have been hypothesised to improve insulin sensitivity and protect against diabetes in several supplementation trials.55 ,56 In addition, it might also reduce the risk of T2D due to the supply of magnesium (Mg); a recent meta-analysis detected Mg intake to be inversely associated with the risk of T2D.57 Taking this evidence into consideration, it appears that the beneficial effects of vegetables, particularly GLV consumption on the risk of T2D, can be mainly explained by antioxidant vitamins and magnesium. The inverse association may be also mediated through weight gain or obesity, which is an established risk factor for T2D. Fruits are low in energy, which would promote the feeling of fullness and prevent overconsumption of energy-dense foods, and result in weight loss.54 Further investigation is warranted to understand the mechanisms involved in the proposed relation between fruit, vegetables or GLV and risk of T2D.
Exploration of heterogeneity
Heterogeneity between studies was found, which did not alter much in the subgroup analyses. There are differences in the types of vegetable consumed between Asian (such as China) and Non-Asian populations. Therefore, within the subgroup analysis, we examined location as a possible source of heterogeneity. As traditional Chinese diets are high in vegetables (such as GLV and cruciferous vegetables), unsurprisingly, vegetables (including GLV) intake was greater in China than in the USA or Europe. We also examined study quality, length of follow-up, sex, number of cases or participants, and whether the different ways in which authors had grouped intake (thirds, quarters or fifths) as possible sources of heterogeneity; these did not show any significant heterogeneity between studies. Although the subgroup analysis could not explain the level of heterogeneity in interpreting the results, several differences between the studies are worth discussing.
Assessment methods of fruit, vegetables, or fruit and vegetables combined consumption differed between the studies. Most epidemiological studies used the food frequency questionnaires (FFQs) to assess the quantity of fruit, vegetables, or fruit and vegetables combined intake.7 ,10 ,11 ,43 ,44 ,46 ,47 FFQs are less suitable for the assessment of absolute intake, which they tended to overestimate.58 ,59 However, two studies collected data via a single 24 h recall and dietary history interviews, respectively.15 ,45 These measurements may underestimate true associations between fruit, vegetables, or fruit and vegetables combined consumption and risk of T2D. In addition, calculations of daily consumption differed (such as servings per week, servings per day or grams per day). Although we standardised primary data using a standard portion size of 106 g, conclusions should be interpreted with caution. Another possible explanation for the differences between the studies might be the classification of food groups. Among the studies, GLVs’ criteria was inconsistent: three studies included spinach and lettuce; one included spinach and greens; others did not provide any specific description. If they were included with a uniform definition for each group, the associations might differ.
Strengths and limitations
Compared with previous meta-analyses,5 ,8 ,9 our study has several strengths. To the best of our knowledge, this is the largest systematic review and meta-analysis on the intake of fruit and vegetables and risk of T2D. In addition, to examine the shape of these possible associations, we investigated a dose–response relation between fruit, vegetables, or fruit and vegetables combined consumption and risk of T2D. Therefore, the results should be more reliable.
In interpreting the results, several limitations of this meta-analysis should also be acknowledged. First, although in the multivariable analysis we considered a multitude of lifestyle and dietary factors, the possibility of residual confounding or confounding by unmeasured factors, which cannot be ruled out in any observational study, must be acknowledged. Second, we cannot exclude the possibility of recall bias in the assessments of diet based on the FFQs. However, the prospective study design and exclusion of participants with chronic diseases at baseline should minimise such bias. Third, the noticeable limitation of our study was the potential for bias due to the inevitable measurement error, especially for an individual with lower consumption levels. We attempted to reduce measurement error by adjusting for energy intake and using cumulatively averaged intake levels. Fourth, since we had no source of information other than the questionnaire for the identification of T2D, we might have underestimated the incidence of T2D. In addition, subclinical diseases at baseline might have distorted our risk estimate to some extent. Finally, the possible limitation is due to language bias. We attempted to minimise this bias by searching major electronic databases with no language restriction. However, several articles published in non-English languages might not appear in international journal databases, and could be omitted by our searches.60
Conclusions
In summary, our meta-analysis suggests that higher fruit or GLV intake is associated with a significantly reduced risk of T2D. In addition, the dose–response relations also indicate that relatively high fruit or GLV may still decrease the risk of T2D. Further evidence from preferably randomised controlled studies should explore what kind of fruit or GLV can reduce the risk of T2D.
References
Supplementary materials
Supplementary Data
This web only file has been produced by the BMJ Publishing Group from an electronic file supplied by the author(s) and has not been edited for content.
Files in this Data Supplement:
- Data supplement 1 - Online figures
- Data supplement 2 - Online table A
- Data supplement 3 - Online table B
Footnotes
-
Contributors ML and ZT conceived and designed the study. ML and YF searched the databases and checked them according to the eligible inclusion and exclusion criteria. ZT helped develop search strategies. XZ and WH extracted quantitative data. YF, XZ and WH analysed the data. ML wrote the draft of the paper. All authors contributed to the writing, review or revision of the paper. ZT is the guarantor.
-
Funding This research received no specific grant from any funding agency in the public, commercial or not-for-profit sectors.
-
Competing interests None.
-
Provenance and peer review Not commissioned; externally peer reviewed.
-
Data sharing statement No additional data are available.