Article Text

Abstract
Objective To explore why patients with cancer treated by London hospitals report worse experiences of care compared with those treated in other English regions.
Design Secondary analysis of the 2011/2012 National Cancer Patient Experience Survey (n=69 086).
Setting and participants Patients with cancer treated by the English National Health Service (NHS) hospitals.
Main outcome measures 64 patient experience measures covering all aspects of cancer care (pre-diagnosis to discharge).
Methods Using mixed effects logistic regression, we explored whether poorer scores in London hospitals could be explained by patient case-mix (age, gender, ethnicity and cancer type). Because patients referred to tertiary centres and/or with complex medical problems may report more critical experiences, we also explored whether the experiences reported in London may reflect higher concentration of teaching hospitals in the capital. Finally, using the data from the (general) Adult Inpatients Survey, we explored whether the extent of poorer experience reported by London patients was similar for respondents to either survey.
Results For 52/64 questions, there was evidence of poorer experience in London, with the percentage of patients reporting a positive experience being lower compared with the rest of England by a median of 3.7% (IQR 2.5–5.4%). After case-mix adjustment there was still evidence for worse experience in London for 44/64 questions. In addition, adjusting for teaching hospital status made trivial difference to the case-mix-adjusted findings. There was evidence that London versus rest-of-England differences were greater for patients with cancer compared with (general) hospital inpatients for 10 of 16 questions in both the Cancer Patient Experience and the Adult Inpatients Surveys.
Conclusions Patients with cancer treated by London hospitals report worse care experiences and by and large these differences are not explained by patient case-mix or teaching hospital status. Efforts to improve care in London should aim to meet patient expectations and improve care quality.
This is an Open Access article distributed in accordance with the Creative Commons Attribution Non Commercial (CC BY-NC 3.0) license, which permits others to distribute, remix, adapt, build upon this work non-commercially, and license their derivative works on different terms, provided the original work is properly cited and the use is non-commercial. See: http://creativecommons.org/licenses/by-nc/3.0/
Statistics from Altmetric.com
Strengths and limitations of this study
-
Data comes from a large nationwide survey of patients with any cancer.
-
The survey has a high (68%) response rate.
-
We have not been able to directly examine the potential influence of differences in expectations of care quality between patients treated by London hospitals and hospitals elsewhere in England.
Introduction/background
Understanding the variation in patient experience can help to inform priorities for improvement actions and policies. In the UK, the advent of large national surveys of patients with cancer has enabled a better appreciation of variation in cancer patient experience between different patient groups or hospitals.1–4 A salient finding of recent cancer patient surveys is that patients treated by London hospitals reported poorer experiences compared with those treated by hospitals in other English regions.1 ,5–7
Several hypotheses can be considered to explain this type of geographical variation in crude hospital experience scores. First, London hospitals may be treating a higher proportion of patient groups known to report worse experiences of care, such as younger and ethnic minority patients or patients with certain types of cancer.2 ,3 ,8 ,9 Second, patient experience may vary by type of hospital, and if so, the experiences reported in London could simply reflect a higher concentration of teaching (tertiary) hospitals in the capital region.7 This hypothesis assumes that patients who are referred to tertiary centres and/or have complex medical problems and/or have more complex care pathways are likely to be more critical of their experiences. Third, it is possible that London patients receive the same care as that received by patients elsewhere but have higher expectations of care quality, perhaps because of different cultural expectations, leading to a more critical evaluation of their experience (the ‘same care worse experience’ hypothesis).8 Fourth, care provided by London hospitals may indeed be different (worse) compared with the rest of the country, leading to worse experience.
Understanding the potential mechanisms responsible for poorer reported experience of cancer patients treated by London hospitals is important to inform efforts to address this disparity. In this paper we set out to directly explore whether London/rest-of-England inequalities in cancer patient experience may reflect confounding by sociodemographic or cancer diagnosis case-mix and/or hospital type. In addition, we consider indirect evidence to provide insights about other potential sources of variation, beyond case-mix and hospital type.
Methods
Data
Sources
For the main analysis we used publicly available anonymous data from the 2011/2012 National Cancer Patient Experience Survey—a postal survey of patients with cancer treated by 160 English NHS hospitals during January–March 2012 (71 793 respondents, response rate 68%) carried out by Quality Health for the Department of Health.10 Of all respondents, 3.8% had missing self-reported ethnic group and were excluded, with the final analysis sample of 69 086. For each question, we included in analysis all patients with an informative response to the question of interest.
In further analysis we used data from the Adult Inpatients Survey, a postal survey of patients with any pathology and at least one night stay in an NHS hospital between June and August 2011 (70 863 respondents, response rate 53%) carried out by the Picker Institute for the Care Quality Commission.11 Of all respondents, three had missing age and were excluded with a final analysis sample of 70 860.
Outcome and exposure variables
Of all 160 English hospitals treating patients with cancer, 27 are London hospitals and 26 are teaching hospitals (ie, university hospitals with a tertiary referral centre function; see online supplementary appendix table 1). Eight teaching hospitals are also London hospitals.
The Cancer Patient Experience Survey comprises 65 questions that measure patient experience across the patients with cancer journey. Most questions have a four-point or five-point Likert scale response options, evaluating experience from very good to very poor. As public reporting of hospital scores for the survey is based on binary forms of these outcomes (ie, good or poor patient experience),1 we used the same binary categorisations in the analysis. There are 16 Cancer Patient Experience Survey questions that are also included in the Adult Inpatients Survey. Information on cancer diagnosis International Classification of Diseases (ICD)-10 code, patient age and gender were available for all respondents based on hospital record information. Thirty-six different cancer diagnoses groups were considered (see online supplementary appendix table 2). Age was categorised into eight groups (16–24, six 10-year groups from 25–34 to 75–84 and 85+). We used patients’ self-reported ethnicity (based on their responses to survey question 77) in this study rather than relying on information recorded in hospital records as the former is considered to be a gold standard and the latter has been shown to contain some inaccuracies.12 A six-group classification (White, Mixed, Asian or Asian British, Black or Black British, Chinese and Other) was used in the analysis.
Analysis
Exploratory analysis showed that variation among the English regions other than London was trivial (see online supplementary appendix table 3). Therefore, hereafter all analysis relates to London/rest-of-England comparisons, with patients treated by ‘rest-of-England’ hospitals considered together as a group.
We first described London/rest-of-England variation in the sociodemographic and clinical characteristics of respondents.
We then used mixed effects logistic regression (including a random effect for hospital) to estimate the OR for patients with cancer treated by London hospitals reporting poorer experience compared with those treated by hospitals elsewhere in England. We considered three models separately for each of the survey questions. To explore crude (unadjusted) differences, the first model included only a fixed effect variable denoting London/rest-of-England hospital location (in addition to a random effect for hospital, as above). To explore the potential influence of patient case-mix, the second model additionally included case-mix variables (patient age, gender, ethnic group and cancer diagnosis). Finally, to explore the potential influence of teaching hospital status, the third model, in addition to sociodemographic characteristics and cancer diagnosis also adjusted for whether or not the hospital of treatment was a teaching hospital. We plotted the p values from these fully adjusted models to evaluate the role of chance in these findings. For one question (question 28, whether a patient was pleased to have been asked to take part in cancer research), the adjusted model did not converge, as patient experience was almost uniformly positive across all hospitals in England. This question was therefore excluded from all analyses, and the results hereafter relate to 64 evaluative questions. We also explored interactions between London hospital and sociodemographic characteristics which allow us to explore whether any particular groups of patients report particularly different experiences in London; for ethnic groups specifically, because interaction models include a large number of degrees of freedom, we considered a broad two-group classification of ethnicity (white/non-white).
Finally, we combined data from the two hospital surveys (Cancer Patient Experience Survey and Adult Inpatients Survey) to test whether differences in experience reported by patients treated by London hospitals were consistent across the two surveys. After adjusting for age and gender, using this model, we tested whether the association between London hospital location and patient experience was consistent between surveys for the 16 questions that they both share. All analyses were carried out using Stata V.11.2.
Results
Patient characteristics
On an average, compared with cancer patients treated elsewhere in England, those treated by London hospitals were younger (median age of 65 vs 66 years), more likely to belong to ethnic minorities (16% vs 2%), more likely to be treated by teaching hospitals (46% vs 24%) and more likely to suffer from rarer types of cancers (eg,6.5% vs 4.4% had multiple myeloma, table 1).
Comparison of patients with cancer treated by London hospitals with those treated elsewhere in England
Unadjusted differences in positive experience
There was evidence (p<0.05) that patients with cancer treated by London hospitals reported worse experiences compared with those treated by hospitals in the rest-of-England for 52 of 64 survey questions (figure 1, full results in online supplementary appendix table 4b). For a single question (whether the patient was asked to take part in cancer research) experience was more positive in London while for nine other questions there was no evidence of difference (see online supplementary appendix table 4b). Depending on item non-response and the frequency of positive responses observed (unadjusted and adjusted), effect sizes of OR∼1.1 are significant at p<0.05.

London/rest-of-England differences in patient experience across the Cancer Patient Experience Survey questions. OR values >1.0 indicate that cancer patients treated by London hospitals report comparatively worse experience of care than patients treated elsewhere, and vice versa.
For the 52 questions with worse experience in London, the proportion of patients reporting a positive experience was lower in London compared with the rest-of-England by a median of 3.7% (IQR 2.5–5.4%, for full details by question, see online supplementary appendix table 4a). For these questions the unadjusted ORs (for London patients reporting worse experience) ranged from 1.13 to 2.05. The most pronounced difference was for the question on whether staff asked patients about the name by which they would like to be called (unadjusted OR for worse experience in London=2.05 (1.75–2.41)).
Variation in experience adjusted for patient case-mix
After accounting for differences in case-mix, the size of London/rest-of-England differences in patient experience was attenuated, but there was still evidence (p<0.05) that patient experience was worse in London hospitals for 45 of 64 questions (figure 1 and see online supplementary appendix table 4b).
Adjustment for teaching hospital status
Adjusting for teaching hospital status (additional to adjustment for case-mix) made minimal difference to the size of London/rest-of-England differences: there remained evidence that patient experience was worse in London (p<0.05) for 44 of 64 survey questions, with effect sizes that were nearly identical to those observed after case-mix adjustment (figure 1 and see online supplementary appendix table 4b). Specific aspects of variation are further highlighted in box 1. The observed and expected distribution of p values under the null hypothesis was plotted from these models (figure 2). The significant associations observed are unlikely to be due to chance alone.
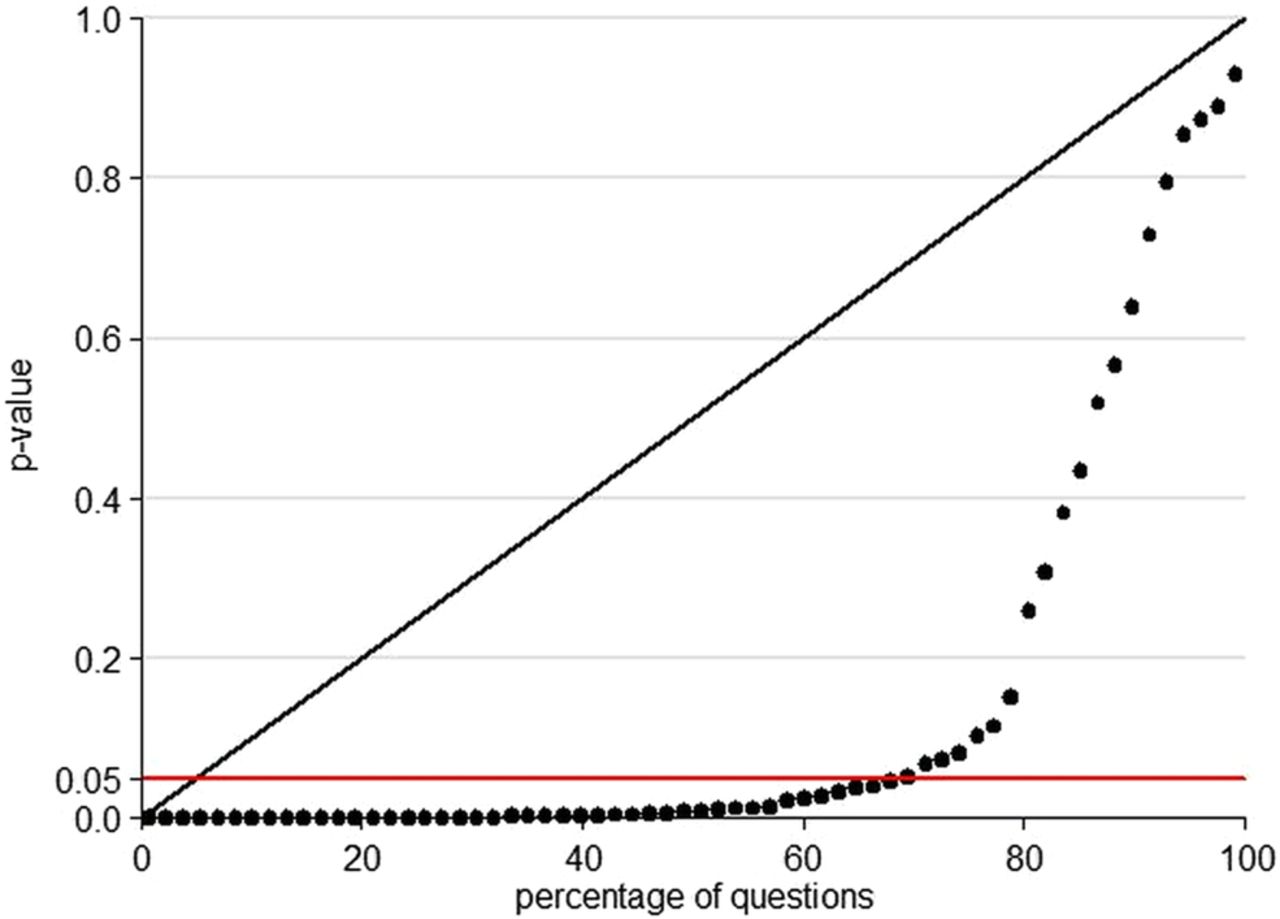
Variation in observed p values for the association between being treated at a London hospital and reported patient experience after adjustment for case-mix and teaching hospital status. The observed variation is compared with that which we might expect under the null hypothesis of no association (line). If there were no true associations, then three or four (ie, ∼5%) of the 64 questions would be expected to have a p value of less than 0.05 (red line) by chance alone and the observed distribution would follow the expected straight line. Multiple testing is unlikely to be the explanation for the distribution observed in these analyses.
Aspects of London/rest-of-England variation in cancer patient experience
Considering different questions across the patient journey, patients treated by London hospitals generally report worse experiences throughout (diagnosis, treatment, discharge and postdiagnosis). Furthermore, worse experience in London is apparent for questions relating to the experience of hospital care and for the (fewer) questions that relate to the experience of primary or social care. For example, patients treated by London hospitals reported worse experience for questions 1–4 (relating to pre-diagnosis experience, including aspects of care provided by general practitioners) and for question 55 (care from health and social services after discharge from hospital).
Few questions without evidence for worse experience in London hospitals include questions about treatment choice (question 15, whether the patient was given a choice of treatment options) and information provision (eg, question 68, on having been offered a written care plan).
London/rest-of-England differences with respect to nursing care were inconsistent. For two items (question 20, whether the patient was given the name of a Cancer Nurse Specialist; and question 43, whether there were enough ward nurses on duty), there was no evidence of differences. However, for items relevant to nursing care (eg, questions 21–23 regarding ease of contacting a Cancer Nurse Specialist and interpersonal aspects of specialist nurse care; or questions 40–41 regarding the experience of ward nursing) patients treated by London hospitals reported worse experience.
The strength of the association between poorer experience of patients in London/rest-of-England was attenuated for most questions after adjusting for case-mix and hospital type (figure 1). Improvement efforts should be focused on questions where the associations are strongest (see online supplementary appendix table 4b), rather than on individual changes in p values.
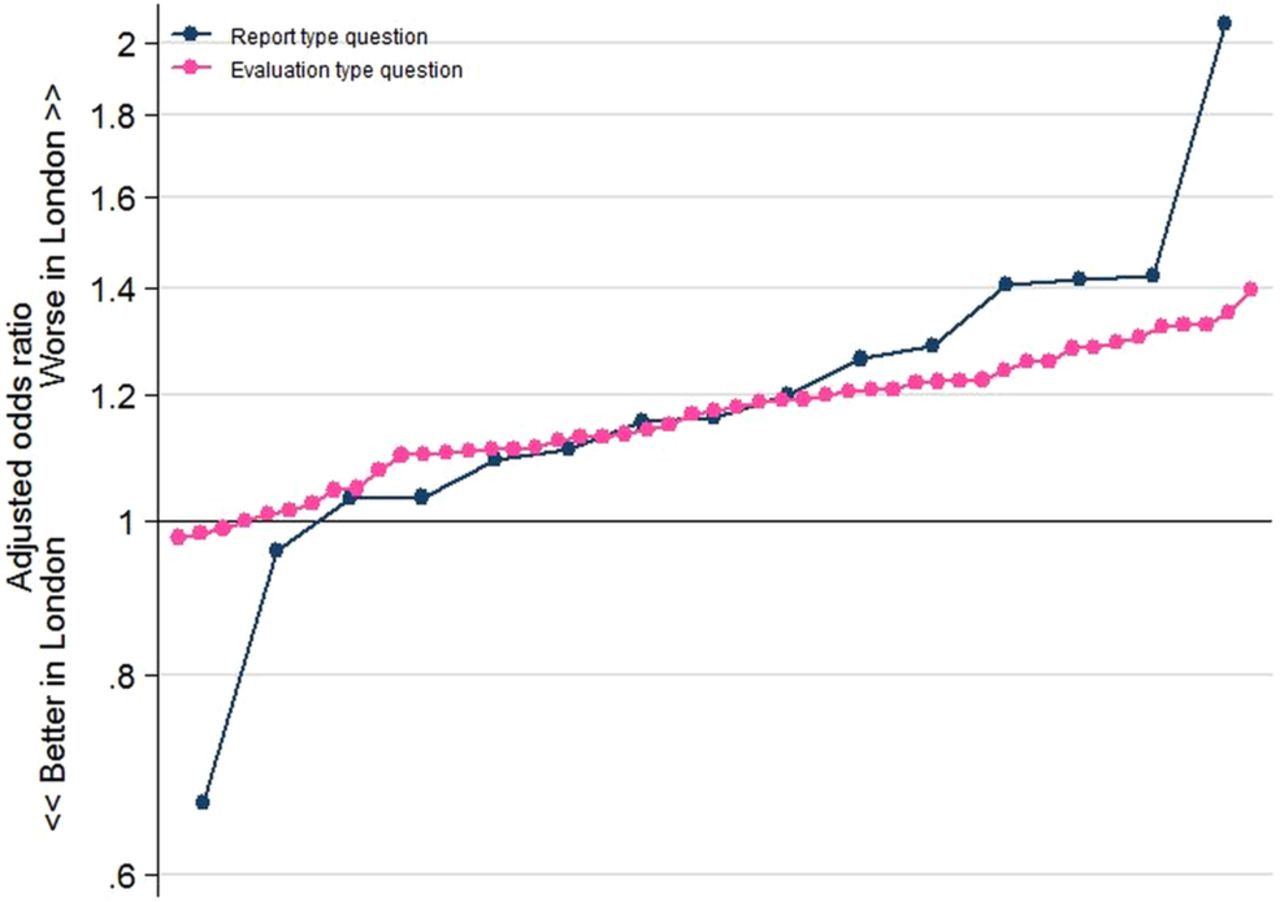
Considering report or evaluation types of questions separate the patients treated by London hospitals tended to report worse experience for both evaluation and report items (figure 3).
Interaction analysis
There was little evidence for interactions between treatment by a London hospital and sociodemographic characteristics. Full results for ethnicity are presented in online supplementary appendix 5. Briefly, the results suggest that the impact of being treated by a London hospital is the same irrespective of the ethnic background of the patient. Another way to consider this would be that although ethnic minority patients generally report worse care than White patients there is no evidence that this disparity is any larger or smaller in London hospitals.
London variation for patients with cancer and general in patients
For 16 questions that are consistent across both surveys, reported experience was generally more positive for patients with cancer (Cancer Patient Experience Survey respondents) compared with patients with a general mix of diagnoses (Adult Inpatients Survey respondents). Being treated in London appears to have a more negative impact on patient experience among patients with cancer than among general hospital inpatients, with statistical evidence for such an interaction for 10 of the 16 questions that are common across the two surveys (table 2).
Comparison of London/rest-of-England differences in patient experience for general inpatients (any pathology) and patients with cancer*
Discussion
We explored the potential sources of variation in the experience of patients with cancer treated by London hospitals compared with those treated by hospitals elsewhere in England. Considering unadjusted percentages, cancer patient experience in London is rated worse than any other English region for the great majority of questions, although the absolute percentage difference is typically small. Confounding by patient case-mix (sociodemographic characteristics or cancer diagnosis) explains some of the London/rest-of-England disparities but its overall impact is small. Additional adjustment for teaching hospital status has only a marginal influence. The observed distribution of p values across questions would indicate that these findings are unlikely to be explained by chance alone (figure 2). There is some evidence that London/rest-of-England differences in patient experience are larger for patients with cancer than patients with a general mix of diagnoses. These findings indicate that the hypotheses that London/rest-of-England differences in patient experience reflect either patient case-mix or teaching hospital status are unlikely to be true.
Previous work has documented that London patients have worse experience of primary and hospital care.13–15 By and large regional differences in the UK are confined to London/rest-of-England variation, which is a matter of ongoing policy concern and improvement initiatives.16 Research from Canada has demonstrated rural–urban differences in patient experience, with patients in urban areas reporting worse experience.17 Our study is reminiscent of a study exploring geographical variation in patient experience within the context of the Medicare's Consumer Assessment of Healthcare Providers and Systems (CAHPS) survey in the USA, specifically exploring sources of variation between California and the rest of the USA in patient experience scores.18 This study, however, does not provide direct insights about the important question of whether differences relate to patient expectations or differences in care. The plurality of ‘for profit’ care providers and the fact that that survey is not focused on patients with cancer make informative comparisons even more difficult.
Particular strengths of our study are its large sample size and the ability to explore potential confounding by cancer diagnosis, in addition to ‘universal’ sociodemographic confounders such as age, gender and ethnicity. Certain limitations should also be considered. We were not able to adjust for disease severity, but we believe that the potential for residual confounding by disease severity is likely to be small, as the inclusion of cancer diagnosis in the model made little difference to the findings. We were also not able to explore potential confounding by a range of other patient factors or hospital factors (such as the quality of patient transport links, the availability of parking and hospital environment and facilities in general). Importantly, we were also not able to adjust for the patients’ socioeconomic status. However, a previous work indicates only small and inconsistent differences in cancer patient experience between patients of different deprivation groups.1–3 Furthermore, in supplementary analysis that used data from the 2010 Cancer Patient Experience Survey, adjustment for the deprivation group of patients (which was available for that survey) in addition to age, gender, ethnicity and cancer diagnosis produced trivial differences in hospital ranks (data not shown).
Having been able to directly examine and eliminate case-mix or teaching hospital status as major sources of variation in the experience of patients treated by London hospitals, it is worth considering whether the findings may reflect differential expectations of care quality among Londoners, or worse care quality leading to worse experience. Disentangling this research question is fraught with substantive methodological difficulties. Evaluating standardised (eg, videoed) encounters between patients and healthcare professionals to be rated by patients from different regions of England could be useful, as has been shown for studies of ethnic variation in experience.19 In the absence of other evidence, it is worth considering three observations that may be insightful. First, with a few exceptions, patients treated by London hospitals evaluated their experience more negatively both for evaluation and report questions (figure 3), and this would seem to suggest that care provided by London hospitals may be worse than in other parts of the country. This is because if the sole explanation for the London/rest-of-England were that patients treated by London hospitals had higher expectations of quality then this factor could have been expected to chiefly have influenced their responses to evaluation (eg, ‘overall, how would you rate your care’?) as opposed to report items (eg, ‘outpatient waiting times longer than 30 minutes’). Similarly, the fact that London/rest-of-England differences appear to be larger for patients with cancer compared with patients with other pathologies treated by the same hospitals would also support the hypothesis that an exogenous factor (such as worse quality of cancer care) may be responsible, as opposed to an intrinsic tendency for Londoners to evaluate their care differently to patients treated elsewhere in the country. Third, we also note that some London hospitals (including one central London teaching hospital) have cancer patient experience scores that are above the national average.1 This observation does not support the hypothesis that patients treated by London hospitals have different higher expectations of care quality. It also indicates a potential for improvement for the majority of London hospitals where patient experience is poorer overall.

ORs for London/rest-of-England differences for ‘report’ and ‘evaluation’ survey items. Cancer patients treated by London hospitals appear to be reporting worse experiences compared with those treated elsewhere in England for both evaluation and report items. Questions are ordered on this graph from those with the smallest to the largest ORs for ‘report’ and `evaluation’ questions.
In brief, some indirect evidence indicates that, at least in some part, London/rest-of-England disparities may reflect worse care provided by London hospitals.
The possible consequences of increasing fragmentation and care pathway complexity for the experience of patients with cancer are an ongoing concern, particularly in London. In the future, it would be helpful if, subject to cognitive validation and development, specific questions to explore pathway complexity were included in the survey; for example, asking participants to indicate whether their current hospital of treatment was also the hospital of diagnosis (or related questions). An alternative would be for such information to be produced at the point of generating the sampling frame of the survey, using hospital episodes statistics data.
In conclusion, the findings suggest that patient case-mix and hospital type are unlikely to be important sources of geographical variations in the experience of patients with cancer. These realisations can help to further motivate the clinical and managerial engagement with improvement efforts, and appropriate investment and improvement actions to address disparities in patient experience reported by patients with cancer treated by London hospitals. In the absence of direct evidence about whether these disparities reflect different expectations or worse care, future improvement efforts and research should aim to understand how to meet patient expectations at the same time as delivering actual improvements in care quality.
Acknowledgments
The authors thank the UK Data Archive for access to the anonymous survey data (UKDA study numbers: 7134 and 6742 for the Cancer Patient Experience Survey 2011/12 and 2010 respectively, and study number 7034 for the Adult Inpatients Survey 2011), the Department of Health as the depositor and principal investigator of the Cancer Patient Experience Survey, Quality Health as the data collector; and all NHS Acute Trusts in England for provision of data samples. We are also grateful to all patients who participated to any of the surveys.
Supplementary materials
Supplementary Data
This web only file has been produced by the BMJ Publishing Group from an electronic file supplied by the author(s) and has not been edited for content.
Files in this Data Supplement:
- Data supplement 1 - Online supplement
Footnotes
-
Contributors All authors contributed to all stages of the study. CS is the guarantor for this study and affirms that the manuscript is an honest, accurate and transparent account of the study being reported; that no important aspects of the study have been omitted and discrepancies from the study as planned (and, if relevant, registered) have been explained.
-
Funding The study was funded by Macmillan Cancer Support. GL is funded by a Post-Doctoral Fellowship award supported by the National Institute for Health research (PDF-2011-04-047).
-
Competing interests None.
-
Provenance and peer review Not commissioned; externally peer reviewed.
-
Data sharing statement All data used in this study are already publicly available through the UK Data Archive.
Linked Articles
- Correction