Article Text

Abstract
Objectives To examine 10-year mortality and hospital use among individuals categorised as resilient and vulnerable to the impact of chronic pain.
Design A cohort record linkage study.
Setting Grampian, Scotland.
Participants 5858 individuals from the Grampian Pain Cohort, established in 1996, were linked, by probability matching, with national routinely collected datasets.
Main outcome measures HRs for subsequent 10-year mortality and ORs/incidence rate ratios for subsequent 10-year hospital use, each with adjustment for potential confounding variables.
Results 36.5% of those with high pain intensity reported a low pain-related disability (categorised resilient) and 7.1% of those reporting low pain intensity reported a high pain-related disability (categorised vulnerable). Sex, age, housing, employment and long-term limiting illness were independently associated with being vulnerable or resilient. After adjustment for these variables, individuals in the resilient group were 25% less likely to die within 10 years of the survey compared with non-resilient individuals: HR 0.75, 95% CI 0.62 to 0.91 and vulnerable individuals were 45% more likely to die than non-vulnerable individuals: HR 1.45, 95% CI 1.01 to 2.11. Resilient individuals were less likely to have had an outpatient or day-case visit for anaesthetics: OR 0.46, 95% CI 0.27 to 0.79, but no other clinical specialities. Vulnerable individuals were significantly less likely to have had any outpatient or day-case visit (OR 0.43, 0.25 to 0.75); but more likely to have had a psychiatric visit (OR 1.96, 1.06 to 3.61). No significant differences in likelihood of any inpatient visits were found.
Conclusions Resilient individuals have a better 10-year survival than non-resilient individuals indicating that resilience is a phenomenon worth researching. Further research is needed to explore who is likely to become resilient, why and how, as well as to tease out the internal and external factors that influence resilience.
- EPIDEMIOLOGY
- PAIN MANAGEMENT
- PRIMARY CARE
This is an Open Access article distributed in accordance with the Creative Commons Attribution Non Commercial (CC BY-NC 3.0) license, which permits others to distribute, remix, adapt, build upon this work non-commercially, and license their derivative works on different terms, provided the original work is properly cited and the use is non-commercial. See: http://creativecommons.org/licenses/by-nc/3.0/
Statistics from Altmetric.com
Strengths and limitations of this study
-
This is the first study to examine the long-term effects of resilience or vulnerability to chronic pain in terms of survival and hospital use.
-
A major strength of our study was its community base, meaning results from this study are more likely to be representative of people living in the community than those from studies using samples from healthcare settings, such as pain clinics.
-
The prospective nature of the study meant that pain status was ascertained before outcome was measured, avoiding a recall bias.
-
We did not use a formal resilience measurement scale. Instead, we categorised individuals on the basis of their scores on the intensity and disability subscales of a chronic pain measure.
-
Although we were able to adjust for several sociodemographic variables in the analysis, some other potentially important factors were not fully available in the dataset (eg, smoking).
Introduction
Chronic pain is common.1–3 It has wide-reaching physical, psychological and social consequences3–7 and places a heavy burden on individuals, society and healthcare services.8 ,9 While much clinical practice and research focuses on those who perform badly with a condition (‘vulnerable’ individuals), interest is growing in understanding the characteristics and experiences of those who appear to perform well (‘resilient’ individuals).10 ,11 Recent studies have examined resilience to physical illness,12 menopausal symptoms13 and specific conditions such as diabetes,14 epilepsy,15 asthma16 and chronic pain.17–22 These studies have provided useful insights into the short-term importance of resilience. They have also indicated some of the factors accounting for why certain people appear to cope better with their condition than others, such as socioeconomic factors, individual personality traits, psychological factors, spirituality, social support and general health. Little is known, however, about the long-term outcomes of resilient and vulnerable individuals. Such information is needed to understand the clinical and research relevance of trying to identify both sets of individuals.
In this article, we linked information about respondents to a large community-based survey with routinely collected health service data to examine long-term (10 years) hospital use and mortality among those categorised as resilient and vulnerable to the impact of chronic pain. Our hypothesis was that those categorised as resilient would fare better than a comparison group with a similar level of chronic pain, and those categorised as vulnerable would perform worse.
Methods
Grampian cohort
The Grampian cohort, established in July 1996,2 comprised 6940 adults (aged 25+ years) recruited from 29 practices across Grampian, North East Scotland. These included 3605 individuals recruited through random selection from everyone registered with the practice (essentially a general population sample) and 3335 individuals recruited through random selection based on those receiving repeat prescriptions for analgesic use. Full details of the survey have been reported previously.23 Briefly, participants were sent a postal questionnaire in 1996 which included questions about the presence and severity of chronic pain and a range of items regarding health and sociodemographic details. The corrected response rate was 84.3% after two reminders. The study respondents were broadly representative of the Grampian population.7
Chronic pain status
Individuals with chronic pain were identified by affirmative answers to two questions based on the International Study for the Association of Pain (IASP) definition24: (1) Are you currently troubled by pain or discomfort, either all the time or on and off? (2) Have you had this pain or discomfort for more than 3 months?
Pain severity
Chronic pain severity was assessed using the Chronic Pain Grade (CPG) questionnaire.25 This is a seven-item instrument that measures severity in two dimensions: intensity subscale (three visual analogue scale items: current, worst and average pain intensity in the last 6 months) and disability subscale (three visual analogue scale items: interference with daily activities, social activities and daily work in the last 6 months and one item on number of days off work). A score is generated from the three visual analogue scale items for each subscale, from 0 (best possible pain state) to 100 (worst possible pain state). These scores and the item on number of days off work are then used to classify chronic pain into four hierarchical grades, from grade I (low-disability, low-intensity pain) to grade IV (high-disability, severely limiting pain). The CPG has been shown to be valid and reliable for use in a self-completion postal questionnaire in the UK general population.26 Only those who gave affirmative answers to both of the chronic pain questions were asked to complete the CPG questionnaire.
General health and socioeconomic details
The questionnaire included several questions about general health. For this paper, we used the results from a question on the presence or absence of a long-term limiting illness drawn from the National Census (http://www.gro-scotland.gov.uk/files/hseform.pdf). The questionnaire also included items regarding sex, age, marital status, education, housing, social support and employment status.
National routinely collected datasets
In Scotland, routinely collected health information and statistics are collated and stored in a national database by the Information Services Division (ISD), National Health Service (NHS) Scotland (http://www.isdscotland.org/isd/1.html). These routinely collected national datasets can be linked with existing cohorts where adequate personal details are available. An advantage of using national datasets is the ability to follow-up the members of a cohort who remain in Scotland but who move away from their recruitment location. Data (from 1996 to 2006 inclusive) about respondents to the Grampian survey were requested from four of the national datasets: the General Register Office death records; SMR00—first attendances at outpatient clinics; SMR01—inpatient and day-case episodes in general and acute wards of hospitals and SMR04—inpatient and day cases in psychiatric units and hospitals.
Record linkage
A copy of the Grampian cohort dataset was forwarded to the Medical Records Linkage Team at ISD who undertook the linkage. ISD-held data were linked using standard probability matching procedures based on common patient identifiable fields. The new linked dataset was stripped of patient identifiers by ISD and returned to the research team in an anonymised format. This approach enabled detailed analysis of the linked data, while maintaining the patient's confidentiality.
Identification of resilient and vulnerable individuals
Individuals were categorised into one of four groups based on their scores on the intensity and disability subscales of the CPG. Individuals with a low pain-related disability (<50/100) despite a high-intensity pain (≥50/100) were categorised as ‘resilient’; these individuals were compared with ‘non-resilient’ individuals who reported a high pain-related disability (≥50/100) and high-intensity pain (≥50/100). Individuals with a high pain-related disability (≥50/100) in spite of a low-intensity pain (<50/100) were categorised as ‘vulnerable’; these individuals were compared with ‘non-vulnerable’ individuals who reported a low-intensity pain (<50/100) and low pain-related disability (<50/100).
Grouping of hospital-related data
Routine data were available for 42 different clinical specialities and included the number of visits (as outpatient or day-case) and the total number of days spent as an inpatient, for each speciality. In order to maximise our statistical power, we pooled the different visit types and collapsed the data into six categories: (1) medicine (general medicine, geriatric medicine, all major medical specialities except rheumatology), (2) surgery (general surgery, all surgical specialities, eg, ear, nose and throat, gynaecology, but excluding orthopaedic surgery); (3) musculoskeletal (rheumatology and orthopaedic surgery); (4) anaesthetics (as pain clinics are coded by this speciality); (5) oncology (including palliative care and haematology) and (6) psychiatry. Full details of the categorisation are in online supplementary appendix 1. Information about use of accident and emergency services, which are largely accessed in an unscheduled way, was not available since the datasets requested relate to scheduled care.
Statistical analysis
The data were analysed using SPSS for Windows (V.19) and R 2.15.2. Descriptive statistics examined the proportion of people categorised as resilient or vulnerable. Binary logistic regression was then used to examine the demographic, socioeconomic and health factors associated with being in each group. In each case, resilient individuals were compared with those in the non-resilient comparison group and those in the vulnerable group were compared with those in the non-vulnerable comparison group.
Cox regression survival analysis was conducted to obtain unadjusted and adjusted HR with 95% CI for all-cause mortality and cause of death. Adjustments were made for factors independently associated with being vulnerable or resilient on multivariate analysis. The assumption of constant time-dependent covariates was checked for each model and found to hold.
Hospital use was analysed using a two-stage procedure to test for differences in binary (any visits or none) and continuous (number of visits in those having at least one visit) components. In view of overdispersion in the data, we used negative binomial regression for the continuous component with logistic regression for the binary component. The results were expressed as OR for the binary component and incidence rate ratios for the continuous component.
Sensitivity analyses were conducted to explore how our findings changed if: (1) pain-related disability was measured in a different way; and (2) we adjusted for additional factors with incomplete data.
Results
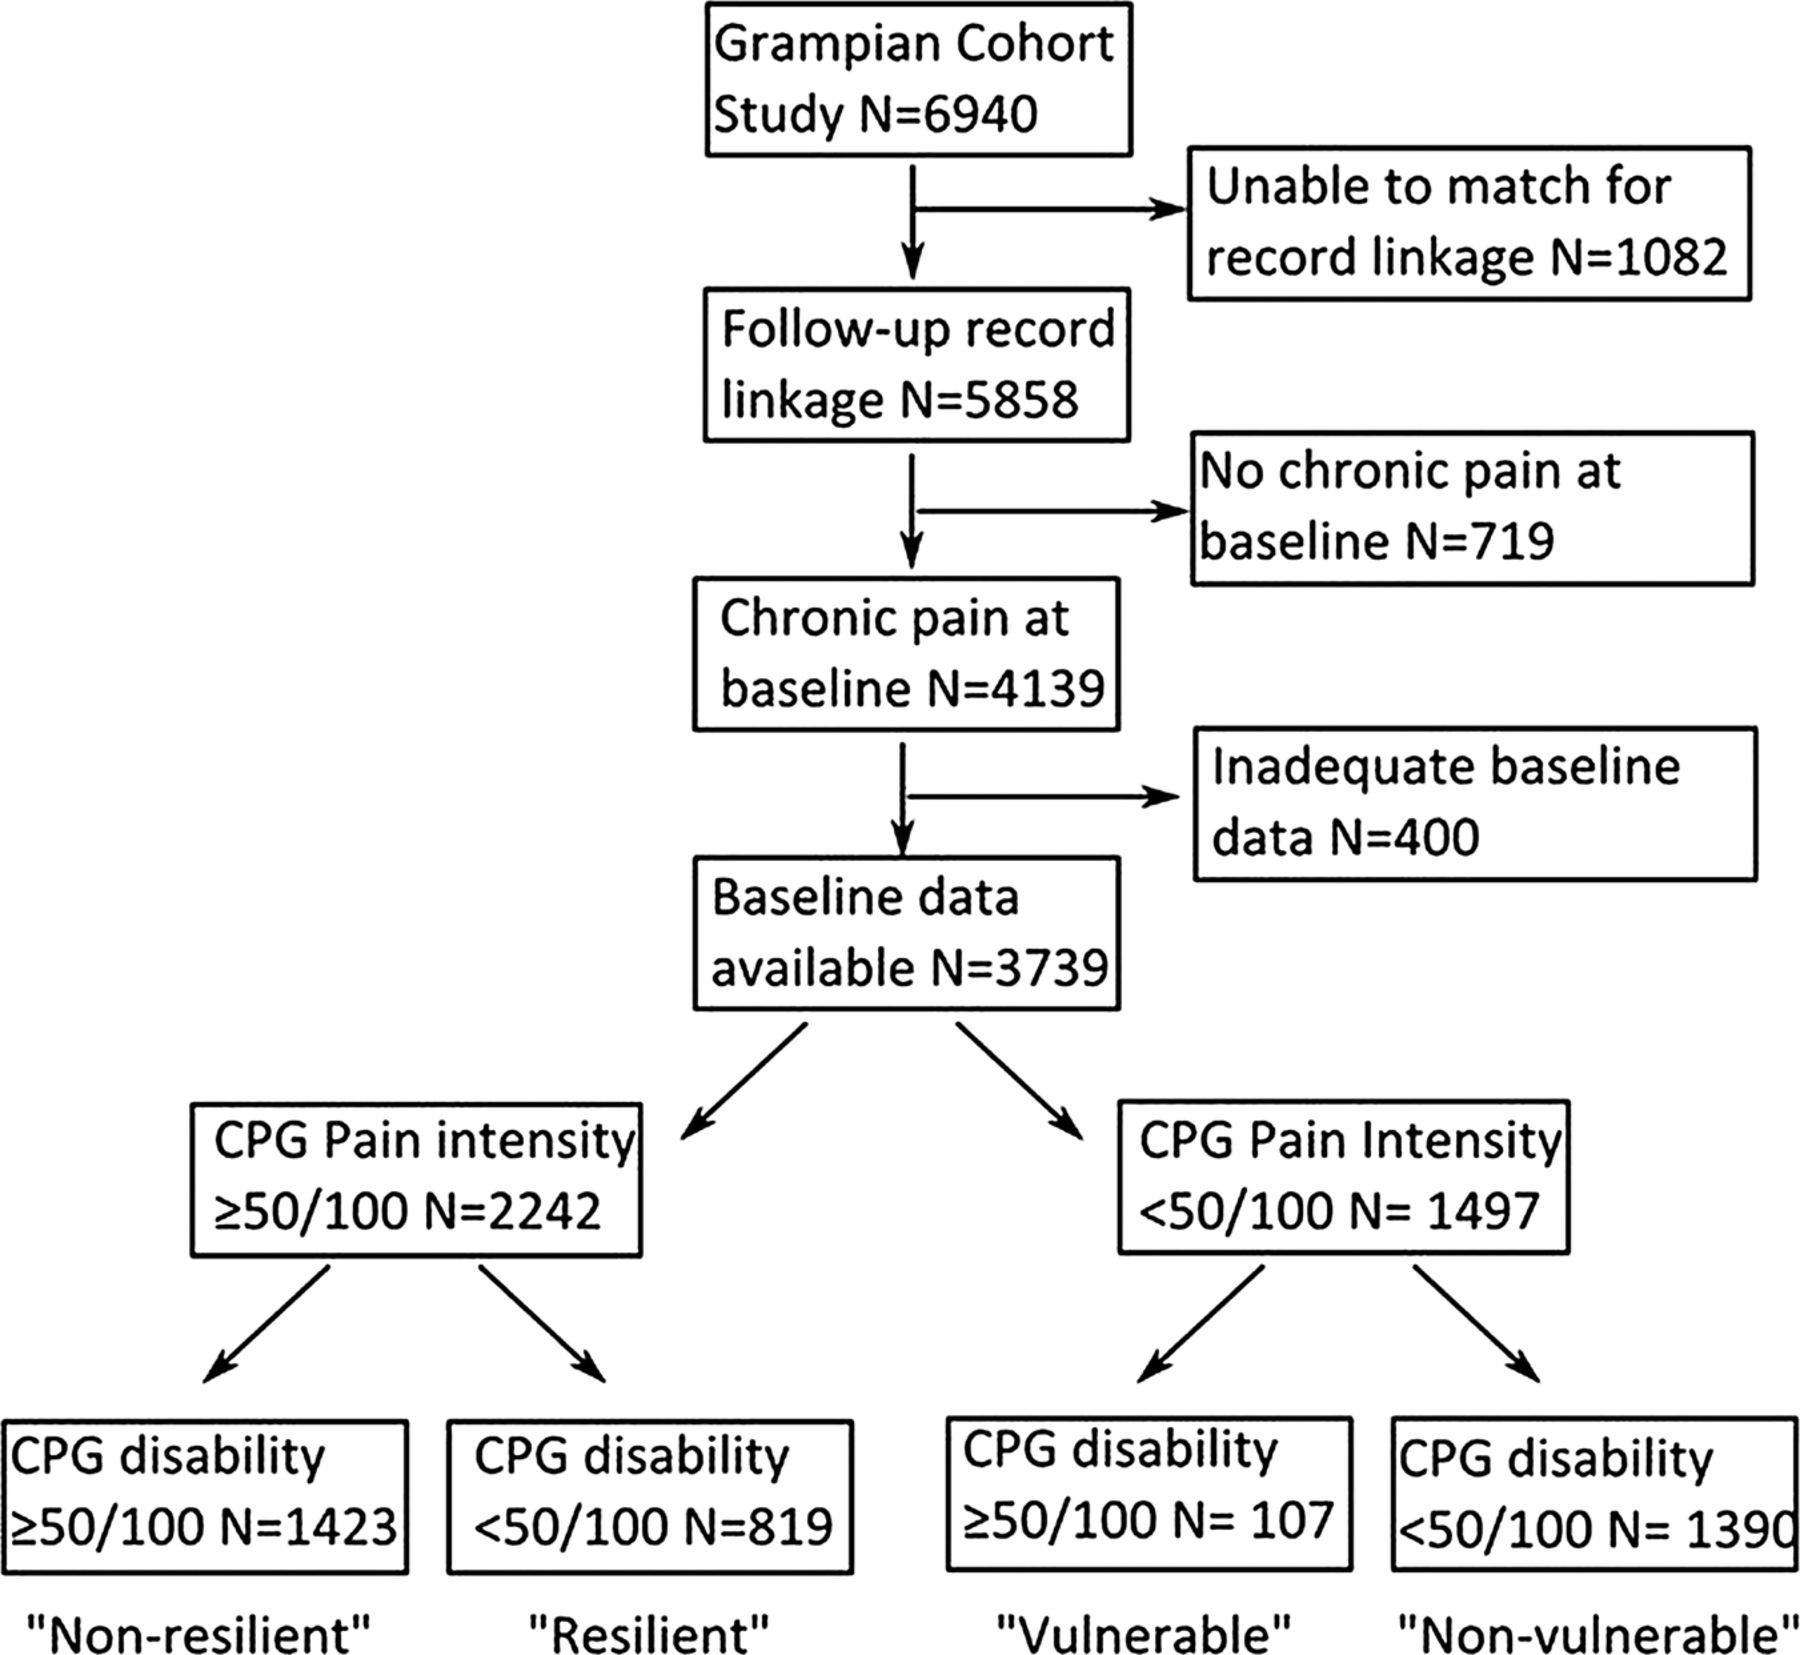
ISD managed to link 5858 (84.4%) of the 6940 individuals in the original Grampian cohort. The characteristics of the linked cohort were very similar to the original complete cohort with no significant differences in demographic, socioeconomic or pain factors. A total of 4139 (70.7%) of those in the linked cohort had chronic pain at baseline of which 3739 (90.3%) had detailed information on pain intensity and disability and were included in subsequent analyses (see figure 1).

Flow chart depicting study process.
Resilience and vulnerability
Of the 2242 individuals reporting high-intensity pain, 819 (36.5%) reported low pain-related disability and were categorised as resilient, while 1423 (63.5%) reported high pain-related disability and were categorised as non-resilient. Among the 1497 individuals reporting low intensity pain, 107 (7.1%) had high pain-related disability and so were categorised as vulnerable, compared with 1390 (92.9%) who reported low pain-related disability and were categorised as non-vulnerable.
Factors associated with being resilient and vulnerable
Table 1 presents the measured demographic, socioeconomic and health factors associated with being in the resilient and vulnerable groups. On univariate analysis, individuals were less likely to be classified as resilient to their chronic pain if they were women, older, no longer married, had less than an university education, lived in rented accommodation, lived with no other adults, were not working and had a long-term limiting illness. Conversely, individuals were more likely to be classified as vulnerable to their chronic pain if they lived in council-rented accommodation, lived with no other adults, were unable to work and had a long-term limiting illness. On multivariate analysis sex, age, housing, employment and long-term limiting illness were identified as the factors independently associated with being vulnerable or resilient and were adjusted for in subsequent analyses.
Factors associated with being in the resilient or vulnerable groups
Mortality
During the 10-year follow-up period, 21.1% of the resilient group and 31.9% of the non-resilient group died (table 2). In comparison, 32.7% of the vulnerable group and 20.9% of the non-vulnerable group died. The main causes of death were broadly similar in each group (table 2).
HR and 95% CI for 10-year mortality among vulnerable and resilient groups
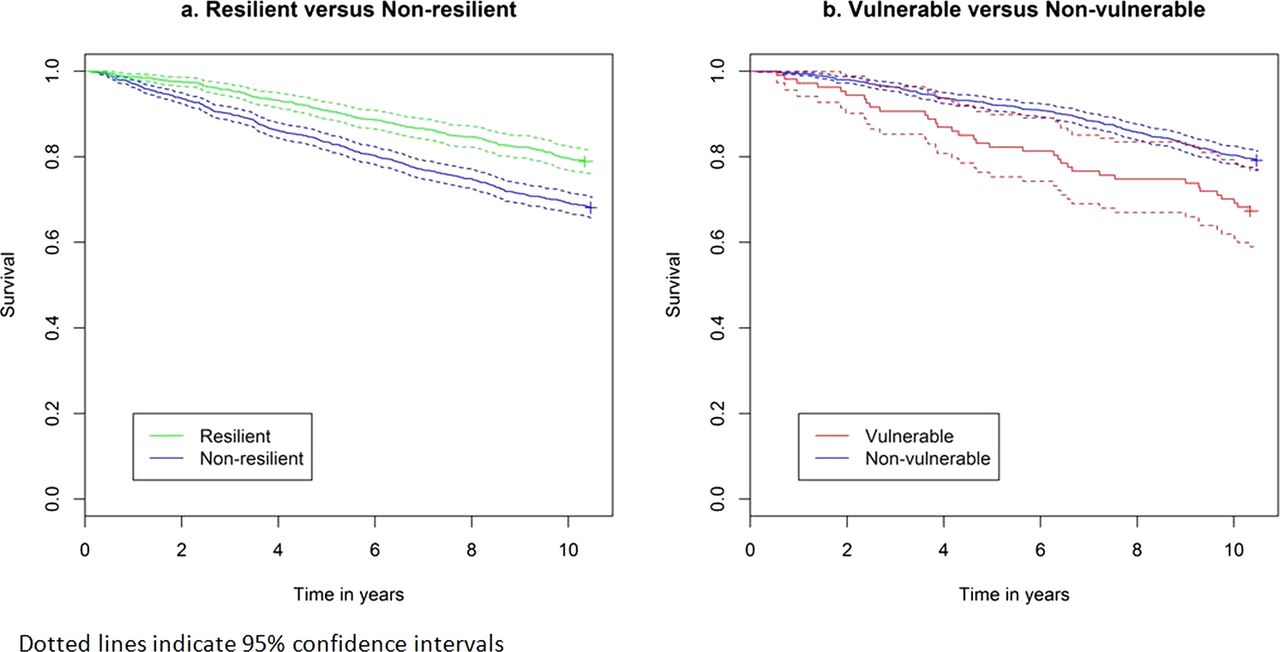
Kaplan-Meier survival plots (figure 2) show a progressive divergence over time between resilient and non-resilient groups, and between vulnerable and non-vulnerable groups, with no discontinuity. Table 2 details the results of the Cox proportional hazards regression (expressed as HRs). After adjusting for sex, age, housing, employment (independently associated sociodemographic factors) and long-term limiting illness, individuals in the resilient group were 25% less likely to die within 10 years of the survey compared with non-resilient individuals: HR 0.75, 95% CI 0.62 to 0.91. A statistically significant reduction in death from cancer among the resilient group also remained (HR 0.64, 0.44 to 0.93) after adjustment. After adjustment, vulnerable individuals were more likely to die over the 10-year period than non-vulnerable individuals (HR 1.45, 1.01 to 2.11) and vulnerable individuals were significantly more likely to die from circulatory diseases than those in the non-vulnerable group (HR 1.91, 1.08 to 3.38).
Kaplan-Meier survival plots comparing: (A) resilient versus non-resilient; (B) vulnerable versus non-vulnerable groups.
Hospital use
Most of the individuals in each group used a hospital service at least once during the 10-year follow-up period. Outpatient or day-case attendance occurred in 720 (87.9%) resilient individuals, 1211 (85.1%) non-resilient individuals, 86 (80.4%) vulnerable individuals and 1238 (89.1%) non-vulnerable individuals. At least one inpatient admission occurred in 514 (62.8%) resilient individuals, 1017 (71.5%) non-resilient individuals, 82 (76.6%) vulnerable individuals and 865 (62.2%) non-vulnerable individuals.
Details of hospital use over the 10-year follow-up period are presented in table 3 (comparing resilient and non-resilient groups) and table 4 (comparing vulnerable and non-vulnerable groups). Table 3 shows that compared with non-resilient individuals, resilient individuals with chronic pain were less likely to have had an outpatient or day-case visit for anaesthetics, the speciality which hosts pain clinics: adjusted OR 0.46, 0.27 to 0.79. There were no other statistically significant differences in visits for other clinical specialities. There were no statistically significant differences in the number of outpatient or day-case visits, nor were there any statistically significant differences in inpatient days between resilient and non-resilient groups. Compared with non-vulnerable individuals, those in the vulnerable group were significantly less likely to have any outpatient or day-case visits (table 4: adjusted OR 0.43, 0.25 to 0.75); and more likely to have an outpatient or day-case psychiatric visit (OR 1.96, 1.06 to 3.61). There were no statistically significant differences in the number of outpatient or day-case visits. No differences were observed between vulnerable and non-vulnerable groups for likelihood of any inpatient visits, or total number of inpatient days (except for anaesthetics). However, the very small number of inpatient admissions in the vulnerable group indicates that any inference from these should be viewed with caution.
Specialist (hospital) care use over 10-year follow-up: comparison of resilient and non-resilient groups
Specialist (hospital) care use over a 10-year follow-up: comparison of vulnerable and non-vulnerable groups
Discussion
This is the first study to examine the long-term effects of resilience or vulnerability to chronic pain in terms of survival and hospital use. We found that resilience to chronic pain (as defined by low disability in spite of high-intensity pain) was associated with a significantly reduced risk of death over the subsequent 10 years. With the exception of pain services, resilient individuals made the same use of specialist services as the non-resilient comparator group. We also found that individuals classified as vulnerable to their chronic pain had poorer survival than those in the non-vulnerable comparison group. The few differences between vulnerable and non-vulnerable individuals in their use of hospital services were related mainly to psychiatric and anaesthetic services.
A major strength of our study was its community base. Results from this study are more likely to be representative of people living in the community than those from studies using samples from healthcare settings, such as pain clinics. The prospective nature of the study meant that pain status was ascertained before outcome was measured, avoiding a recall bias. Furthermore, long-term outcomes were available for analysis. We did not collect data using a formal resilience scale,27 unlike some previous studies of chronic pain.17 ,18 ,28 The lack of standardised definitions of vulnerability and resilience and the lack of use of a formal resilience scale are limitations of our study. Instead, our analyses assume that self-reported pain intensity and disability due to pain correctly differentiated respondents into those resilient or vulnerable to the effects of chronic pain. Individuals were categorised based on their scores on the intensity and disability subscales of the CPG. Use of the two subscales allowed us to use a measure of disability that was directly related to pain, rather than use of a generic measure of health that could have been influenced by other conditions. This approach meant that the two subscales were directly comparable. Since we did not use the ‘days off work’ question in the CPG questionnaire normally used to grade people, a sensitivity analysis was undertaken to examine the effect of including this additional question. Analysis showed that the findings did not materially change, with the same overall pattern of results seen (data not shown). A strength of our approach is that it moves away from groupings based on help-seeking behaviour which is known to be a poor marker of actual functioning.29 ,30 Consulting a healthcare professional may not always identify individuals who are ‘resilient’ or ‘vulnerable’ to their symptoms.
Resilience and vulnerability were associated with several sociodemographic variables and we were able to adjust for these in the analysis. Some other potentially important factors were not fully available in the dataset, but were examined in an additional set of sensitivity analyses to examine the effects of smoking and mental health in relation to survival. Data on cigarette smoking were available from a follow-up survey (conducted 4 years after baseline) for 1572 of the 3739 individuals. There were no specific measures of mental health in the original survey although it did include the SF-36 measure of health-related quality of life which includes a mental health component. Adding both of these variables in turn into the survival models did not change the HRs substantially, although incomplete data led to wider CIs. While we found a few differences in specialist care use between groups, our analyses did not allow for different survival between groups, which meant that resilient individuals tended to have a longer period of time in which to receive specialist treatment than non-resilient individuals; and vulnerable individuals tended to have less time than non-vulnerable individuals. These patterns of survivorship are likely to exaggerate the differences between groups, rather than diminishing them.
There is a growing interest in the phenomenon of resilience in a range of health and social sciences. While hard to define,11 ,31 ,32 it has been suggested that resilience describes something more than either hardiness (eg, not becoming unwell) or coping. Instead, it implies experiencing adversity (illness) and adapting in order to bounce back and thrive, sometimes in changed ways.33 Our finding of generally comparable healthcare use between resilient and non-resilient individuals suggests that resilience in our study was not simply measuring hardiness.
Whatever resilience is, and however it is measured, our finding of better survival among resilient people with chronic pain, suggests that resilience is a phenomenon worth researching. It was noteworthy that a larger proportion (36.5%) of individuals were resilient than vulnerable (7.1%). This suggests that important gains may be made in understanding who is likely to become resilient, why and how. We also need to understand more about how resilience changes with time and what factors influences this. While there is already some information available regarding the traits and activities that seem to influence resilience (such as family, mood, social class, socioeconomic status and life events),20 ,34 ,35 further research is needed to tease out the internal and external factors that influence an individual's resilience. Of particular importance will be the identification of modifiable factors that could be used to help build additional resilience in individuals who could benefit.
References
Supplementary materials
Supplementary Data
This web only file has been produced by the BMJ Publishing Group from an electronic file supplied by the author(s) and has not been edited for content.
Files in this Data Supplement:
- Data supplement 1 - Online appendix
Footnotes
-
Contributors AME and PCH planned and designed the paper. AME and CDB conducted the analysis. AME produced the first draft of the paper. CDB and PCH read and commented on the paper. All authors have seen and approved the final version of the paper. AME is the guarantor and accepts full responsibility for the conduct of the study.
-
Funding This work was supported by a project grant from the Chief Scientist Office, Scottish Executive, grant number CZG/2/287.
-
Competing interests None.
-
Ethics approval The study was approved by the Privacy Advisory Committee of National Health Service (NHS) National Services, Scotland. Grampian Research Ethics Committee approved the original questionnaire survey.
-
Provenance and peer review Not commissioned; externally peer reviewed.
-
Data sharing statement All authors had full access to all of the data (including statistical reports and tables) in the study and can take responsibility for the integrity of the data and the accuracy of the data analysis. Patient-level data from the linked dataset could be made available from the corresponding author when relevant.