Article Text

Abstract
Objective The gold standard method for measuring population sodium intake is based on a 24 h urine collection carried out in a random population sample. However, because participant burden is high, response rates are typically low with less than one in four agreeing to provide specimens. At this low level of response it is possible that simply asking for volunteers would produce the same results.
Setting Lithgow, New South Wales, Australia.
Participants We randomly selected 2152 adults and obtained usable 24 h urine samples from 306 (response rate 16%). Specimens were also collected from a further 113 volunteers. Estimated salt consumption and the costs for each strategy were compared.
Results The characteristics of the ‘random’ and ‘volunteer’ samples were moderately different in mean age 58 (SD 14.6 vs 49(17.7) years, respectively; p<0.001) as well as self-reported alcohol use, tobacco use, history of hypertension and prescription drug use (all p<0.04). Overall crude mean 24 h urinary salt excretion was 8.9(3.6) g/day in the random sample vs 8.5(3.3) g/day for the volunteers (p=0.42). Corresponding age-adjusted and sex-adjusted estimates were 9.2(3.3) and 8.8(3.4) g/day (p=0.29). Estimates for men 10.3(3.8) vs 9.6(3.3) g/day; (p=0.26) and women 7.6(3) vs 7.9(3.2) g/day; (p=0.43) were also similar for the two samples, as was salt excretion across age groups (p=0.72). The cost of obtaining each 24 h urine sample was two times greater for the random compared to volunteer samples ($A62 vs $A31).
Conclusions The estimated salt consumption derived from the two samples was comparable and was not substantively different to estimates obtained from other surveys. In countries where salt is pervasive and cannot easily be avoided, estimates of consumption obtained from volunteer samples may be valid and less costly.
- Nutrition & Dietetics
- Public Health
This is an Open Access article distributed in accordance with the Creative Commons Attribution Non Commercial (CC BY-NC 3.0) license, which permits others to distribute, remix, adapt, build upon this work non-commercially, and license their derivative works on different terms, provided the original work is properly cited and the use is non-commercial. See: http://creativecommons.org/licenses/by-nc/3.0/
Statistics from Altmetric.com
Strengths and limitations of this study
-
The sample size was small.
-
While the random survey method using 24 h urines represents what can be achieved in practice, it is not a gold standard against which the validity of the volunteer sampling approach can be evaluated.
-
However, the estimates obtained were broadly in line with those anticipated.
-
Since salt is ubiquitous in the food supply and variation in consumption between individuals is driven primarily by factors that can be adjusted for (age, sex and body mass index), volunteer sampling may give a fairly robust estimate.
Background
Non-communicable diseases (NCDs) are the leading cause of death accounting for an estimated 35 million (66%) of the 53 million deaths at all ages that occurred in 2010.1 Raised blood pressure is the leading risk factor for global disease burden, and is estimated to cause 9.4 million deaths every year—more than half of the estimated 17 million deaths a year caused by cardiovascular disease.2 Much evidence shows that a reduction in salt intake lowers blood pressure and there is a high likelihood that this would reduce the risk of cardiovascular disease.3 While there is not a current definitive estimate of population dietary salt intake in Australia, it is widely accepted that average consumption is between 7 and 12 g/day4 which is far above the suggested dietary target of 4 g/day5 for Australians.
The reduction of salt intake and sodium content of food has been recommended as a cost-effective action that should be undertaken immediately, with expected accelerated results in terms of lives saved, cases of disease prevented and costs avoided.6 This position has since been endorsed by the 2011 Political Declaration of the United Nations High Level Meeting on NCDs7 which led to the development and adoption of the Global Monitoring Framework and Voluntary Global Targets for the Prevention and Control of NCDs in which salt reduction is a core target.8
Measurement of population salt consumption is fundamental for planning and monitoring salt reduction policies and the gold standard method is based on a 24 h urine collection from a random community sample. Surveys of this type are, however, complex and expensive and because participant burden is high, randomly selected community samples typically have low response rates.9–11 This has been noted as a significant concern at recent WHO NCD surveillance, monitoring and evaluation consultation meetings in which several member states have expressed doubts about the feasibility of using this method.12 The potential adverse impact that a low response rate might have on the conclusions drawn was highlighted and the need for further research into practicable methods for defining and monitoring population salt consumption was underlined.12
The objective of the present study was to measure sodium excretion using assays of 24 h urine specimens collected from a randomly selected community sample. The response rate was poor, however, and a number of non-randomly selected individuals were interested in participating in the study. Accordingly an opportunistic (volunteer) sample was recruited to investigate whether this alternate approach to sampling might give similar results to a random sample with significant non-response. The study also examined the costs associated with each strategy.
Methods
The data derived from a random sample and a volunteer sample carried out concurrently in Lithgow, New South Wales, Australia between March and June 2011.
Inclusion and exclusion criteria
Consenting individuals aged 20 years or above who were residents in Lithgow and listed on the 2009 Federal electoral roll were eligible for inclusion. There was no exclusion based on intercurrent illness, use of medications or any other aspect of demography or personal history.
Selection and recruitment process
Random sampling was carried out by selecting individuals at random from the electoral roll. The electoral roll provided the name and address of each potential participant with electronic databases searched to identify corresponding telephone numbers. Based on the assumption that approximately 25% of invited individuals would participate, 2152 individuals were selected to reach the desired sample size.
Potential participants were first mailed invitations to take part in the survey, with an explanation of the purpose of the study, a participant information sheet and a consent form provided. These individuals were then contacted by telephone to determine their willingness to participate and to schedule an interview time, where a telephone number could not be obtained a member of the research team visited them at their home address and willingness to participate was discussed face-to-face.
Volunteer sampling was carried out by offering participation in the study to individuals at two local shopping centres over several weeks. An information booth was established where those interested could seek further information about participation and arrange a visit by a member of the study team. Recruitment was completed at the time of the inquiry made to the study staff member manning the information booth.
Data collection process
Data collection for randomly selected individuals and the volunteer sample was identical and started with a visit to the study participant by a trained research assistant. Once consent was obtained the three components of data collection, comprising a questionnaire, a physical examination and a 24 h urine collection were initiated. The questionnaire and physical examination were completed at the time of the visit and the urine collection was scheduled to be carried out within the following 3 days.
The questionnaire was fully structured and administered by research assistants, with all responses based on self-report. The questionnaire recorded information on sociodemographic variables, vascular disease history and current drug treatments. Participants were asked to provide the names of regular medications but if that was not known the purpose of the medication was recorded (eg, antihypertensive medication).
The physical examination comprised measurement of body weight (using calibrated Tantia HD-357 portable electronic scales (USA) and height (using a calibrated portable stadiometer Wedderburn WS-HRP model (Australia)) to the nearest 0.1 kg and 0.1 cm, respectively, with body mass index (BMI; kg/height(m2)) then calculated. Blood pressure was measured using a manual inflation blood pressure monitor (A&D UA-&704) in triplicate, according to the American Heart Association protocol.13
A single 24 h urine collection was obtained with the first voided urine on waking on the day of collection being discarded and participants then collecting all voided urine up to and including the first void the following morning. The time at the beginning and the end of urine collection were recorded. The urine volume was noted and the urinary sodium concentration in an aliquot was measured by ion-selective electrode with the buffered kinetic Jaffe reaction without deproteinisation used for assay of urine creatinine (Cobas Integra 400). Suspected inaccurate urine collections (ie, urinary creatinine <4 mmol/day for women, or <6 mmol/day for men, or a 24 h urine collection of <500 mL for either sex) and extreme outliers for urinary creatinine (ie, >3 SDs from the mean) were excluded. The rates of exclusion were similar for the random and volunteer samples. For each individual, the 24 h sodium excretion value (mmol/day) was calculated as the concentration of sodium in the urine (mmol/L) multiplied by the urinary volume (L/day). The conversion from mmol to grams was made by dividing by 17 and the conversion from sodium (Na) to salt (NaCl) by multiplying by 2.542.
Cost data
The preinterview costs involved staff time in selecting and attempting to reach participants including accessing the electoral roll, sending participant invitations, follow-up phone calls and door-knocking to schedule interviews with those randomly selected, as well as setting up and manning an information booth to engage the volunteer sample. The postinterview costs comprised primarily of pathology expenses and were the same for each sample.
Statistical analyses
The baseline characteristics of the sample selected at random and the volunteer sample were summarised and compared using t tests and χ2 tests as were their average urinary sodium values. In addition to the crude estimates described above, weighted estimates of overall population mean sodium excretion were also made in an effort to account for the non-random sampling of individuals. This was carried out for both the randomly selected group (to adjust for the poor response rate) and for the volunteer group (to adjust for their non-representative age and sex structure) by calculating age-specific and sex-specific estimates of salt excretion for 20-year age bands (20–39, 40–59 and 60 plus) for men and women and then weighting these by the age and sex structure of the population to obtain an overall estimate for the community. Regression models were fitted to explore the association between baseline participant characteristics and a range of covariates in the combined (random plus volunteer) sample. Throughout, a p Value of 0.05 or less was taken to indicate a finding unlikely to have arisen solely by chance. Statistical analyses were conducted using SPSS for Windows (V.21, SPSS Inc, Chicago, Illinois, USA).14
Results
Of 2152 individuals selected by random sampling of the electoral roll, 853 (40%) were uncontactable after multiple attempts, 126 (5.8%) were ineligible because they had moved out of the study area, 5 (0.2%) had died and 843 (39%) declined to participate. The remaining 329 individuals comprise the ‘random’ sample with a response rate of 16%. The volunteer sample comprised 120 individuals recruited consecutively at a shopping mall over a 7-day period. The characteristics of the random and volunteer samples were moderately different in a number of regards, including age, proportion using tobacco, alcohol use, self-reported hypertension and use of any prescription medication (table 1).
Characteristics of random and volunteer samples
Crude and weighted 24 h urinary salt excretion in random and volunteer samples
For the analysis there were 306 individuals in the random sample and 113 in the volunteer group with 20 excluded because of suspected incomplete urine collections and 10 for other reasons (figure 1). The crude mean 24 h urinary salt excretion was 8.9 (SD 3.6) g/day in the random sample and 8.5 (3.3) g/day in the volunteer group (p=0.42). The corresponding weighted estimates for the Lithgow population were 9.2 (3.9) g/day and 8.8 (3.4) g/day, respectively (p=0.29).

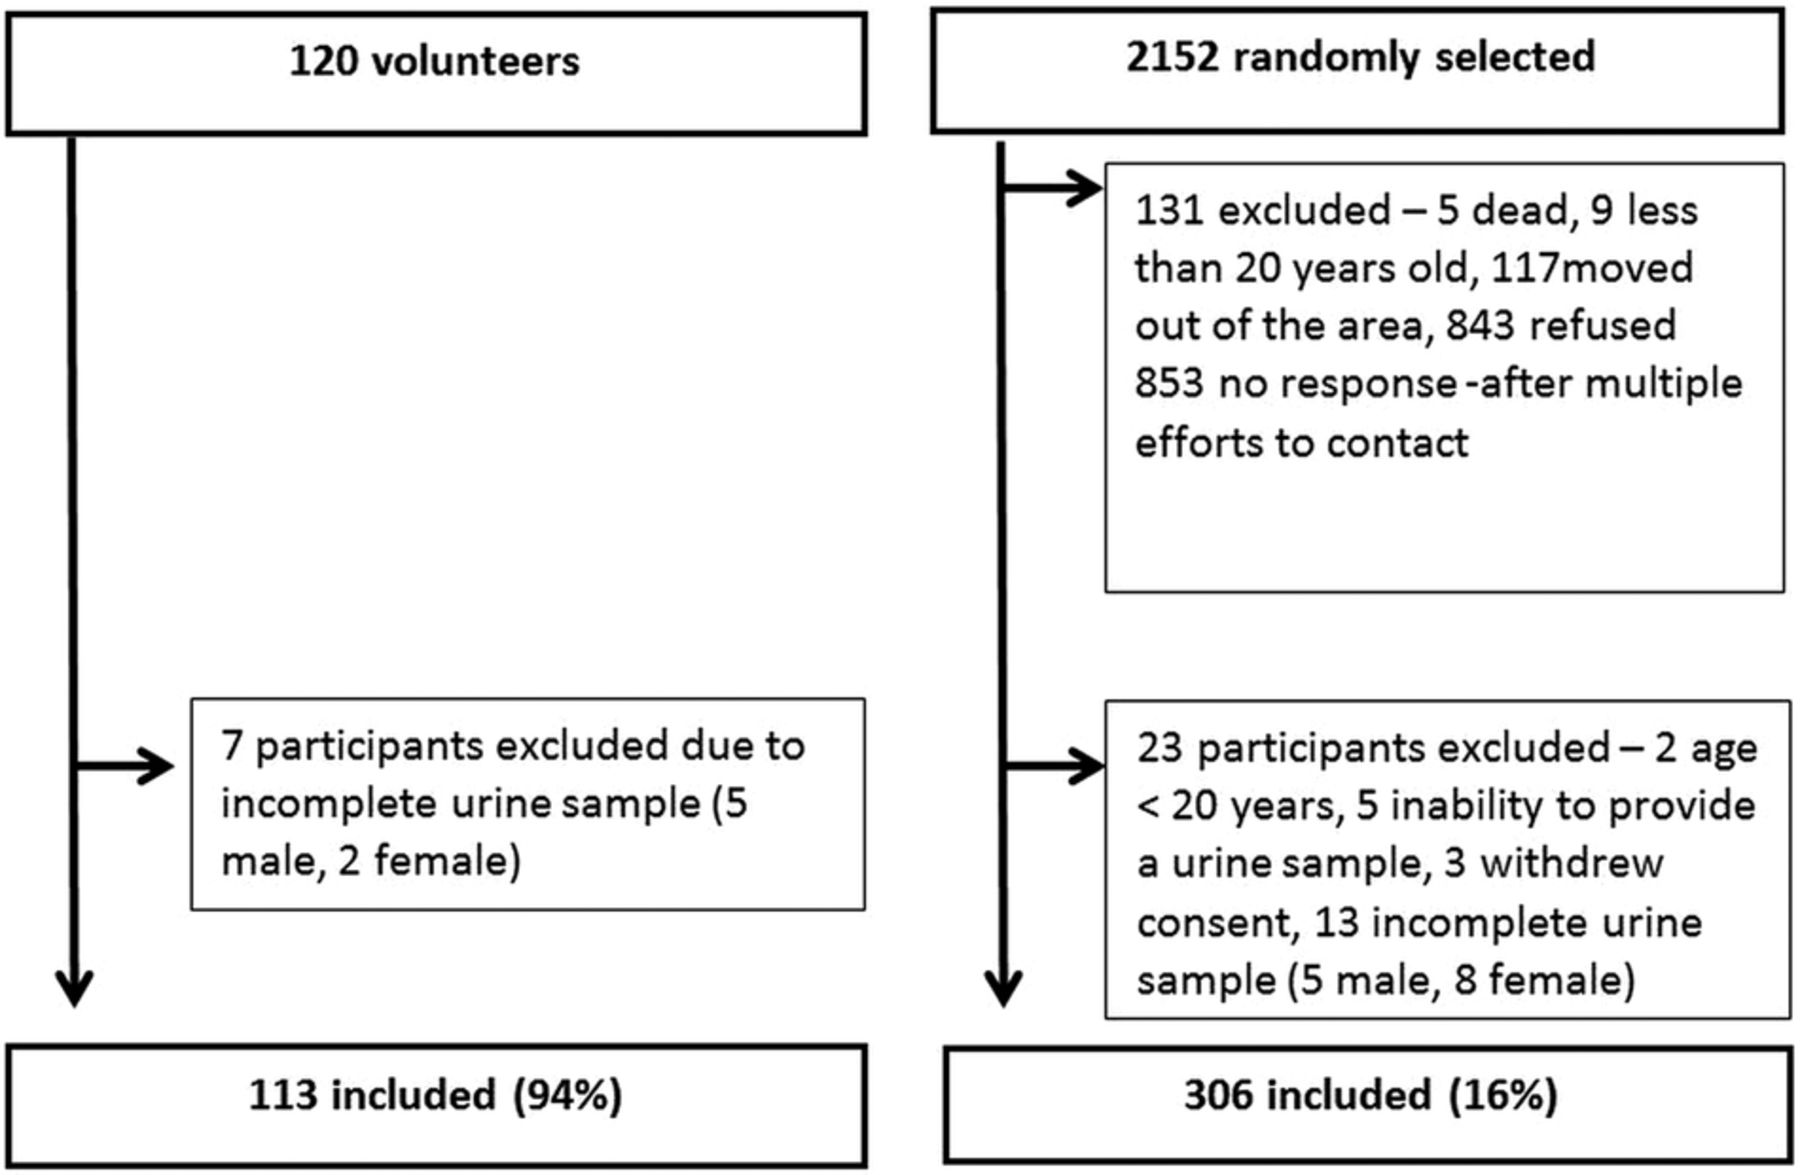
Recruitment of study samples.
The proportion of randomly sampled individuals exceeding 6 g/day recommended maximum level for Australians was 79%, the proportion exceeding the Australian Suggested Dietary Target of 4 g/day was 94% and the proportion exceeding the WHO maximum recommended level of 5 g/day was 87%. The corresponding proportions for the volunteer group were 75%, 93% and 84%. Population-weighted estimates of these proportions were not substantively different.
24 h urinary salt excretion in participant subgroups
Urinary salt excretion in both population samples was significantly higher in men compared with women 10.3 (3.8) vs 7.6 (3) g/day; p<0.001 for random sample and 9.6 (3.3) vs 7.9 (3.2) g/day; p=0.006 for the volunteer sample (table 2) and this was also true for every age group. There was an inverse association between daily salt excretion and age (table 3) such that for every decade increase in age there was 0.3 g/day less excretion of salt (p=0.007). The association between salt excretion and BMI was positive with every unit rise in BMI associated with a 0.16 g/day greater excretion of salt (p<0.001). Similar patterns were observed in both the random and volunteer population samples. There were no other significant associations observed between salt excretion levels and recorded participant characteristics including education, health status, tobacco use, alcohol use, blood pressure, disease history or prescription drug use (all p>0.05).
Urinary salt excretion (g/day)
Cost of random compared to volunteer sampling
Costs associated with random and volunteer survey methods
The two main costs associated with doing the study were staff salaries and pathology expenses. Due primarily to the increased staff time required for the selection and interaction with the randomly selected individuals the estimated average cost associated with obtaining a valid 24 h urine sample was greater for each participant in the random sample (about $A62) compared with each participant in the volunteer sample (about $A31).
Discussion
In this population salt intake greatly exceeds recommended levels, reaffirming the urgent need for concerted action to address salt consumption in Australia. Mean salt excretion levels were some 50% higher than the maximum recommended5 ,15 and only about one in every 20 individuals was found to be consuming the level of salt recommended for good health. Even these data are likely to be an underestimate of the problem because the approximate 10% of salt excreted by the gastrointestinal system and the skin will have gone unrecorded.16 An association between blood pressure and salt intake was not observed in this study but this is unsurprising—the substantial day-to-day variability in blood pressure levels and sodium excretion mitigates against the detection of this association and only a much larger study or a study with multiple measures of blood pressure and urinary sodium excretion would have been able to reliably explore this question. The level of excess salt consumption indicated by this survey would be anticipated to cause substantial disease burden in Australia leading both to large numbers of lives lost prematurely and to many individuals suffering significant disability.17 With centrally managed salt reduction programmes projected to deliver large population health gains at very low cost,18–20 the implementation of an effective salt reduction programme should be a priority for the government of Australia.21 ,22
The observation that the volunteer sample produced similar findings to the random sample is of interest and worthy of further exploration because it was much easier and less costly to collect data from the volunteer sample than from the random sample. There are several reasons why a volunteer sample might provide a similar result to a random sample when estimating population salt consumption from 24-h urine samples. First, the response rate in a random sample from whom a 24 h urine sample is sought is typically very low, averaging 20% (range 9.7–26.8%) in a series of recently reported studies.9–11 ,21 In this situation the random sample effectively becomes a volunteer sample and any biases consequent on using a volunteer sample might also be apparent in the ‘random’ sample. That said, there were many differences between the characteristics of the random and volunteer samples included in this study but these did not translate into detectable differences in the observed sodium excretion. Another possible explanation therefore is the ubiquitous nature of salt in the food supply23 and the rather limited capacity of even motivated individuals to meaningfully modify their salt consumption,24 thereby minimising the impact of any ‘healthy volunteer’ effect.25 It is also possible, of course, that both samples in our study were equally biased and neither gave a robust estimate of true population intake. While this may be true it is of note that the estimates obtained from the present study are not substantially different from prior studies in Australia26–38 or other countries with broadly similar dietary patterns.39 ,40
In some countries it may be possible to achieve better response rates41 ,42 and in others it may be that specific dietary practices or other cultural factors will mean that a volunteer sample will not give a good measure of true population salt intake. If, however, the findings reported here are observed elsewhere and with larger populations, volunteer sampling might provide a low-cost alternate to traditional random sampling techniques while maintaining the strength of 24 h urinary collection. At the very least it may be possible to use a volunteer sample to demonstrate the need for action—most countries in the world are likely to have salt consumption levels far above the WHO consumption target of <5 g/day, and the likelihood that the selection of a volunteer sample will lead to an under-recording of salt consumption of a very large magnitude is probably fairly small.
In addition to the baseline assessment required to justify the start of a salt reduction strategy, ongoing monitoring of salt consumption is required to objectively determine programme efficacy. If the resources required to conduct high quality surveys of a random population sample can be acquired then this remains the optimal approach both to baseline evaluation and monitoring of progress. If not, then repeat surveys of volunteers are likely to be of value if the methods used for participant selection are identical on each occasion—if the biases are the same on each measurement occasion then any real rise or fall in average salt consumption should be clearly apparent. However, we do not advocate for a shift to volunteer-based surveys without sufficient robust evidence that our findings are repeatable.
The cost estimates made for this study showed that recruiting the volunteer sample was a significantly less expensive exercise than recruiting the random population sample. The primary reason for this was the much reduced fieldwork time required for the per capita recruitment of the volunteer sample. Pathology and other recorded costs were otherwise approximately the same. Expenses that were not specifically determined were the costs of computer hardware, computer software, the training of the field staff, and the time required for supervision by the project manager. The last two of these are also likely to have been lower for the volunteer sample due to the simplified and more rapid recruitment process and, as a consequence, the reported difference between costs is likely to have been underestimated, rather than overestimated.
Strengths and limitations
The ‘Gold Standard’ 24 h urine method was used to measure salt intake with standard checks for completeness of the specimens based on urine volume and urine creatinine excretion. The response rate for the random sample was low but comparable to other studies carried out in similar settings over recent years.9–11 The sample size was relatively small and results for subgroups are somewhat imprecise as a consequence. It is possible, for this same reason that the study may have failed to identify small, but real, differences between the sodium excretion levels determined by the two different population sampling methods. The location of the study in a single town in a regional area of New South Wales compromises the direct generalisability of the study findings to Australia as a whole, although the estimated level of salt excretion is not substantively different from that reported in a number of diverse population groups throughout the country.26–38
Conclusion
These data affirm that current efforts to reduce salt intake in Australia are failing, with a large majority of the population studied consuming more than the recommended Australian Upper Limit of 6 g/day and almost everyone eating more than the Suggested Dietary Target of 4 g/day. The observation that an opportunistically recruited volunteer population sample may provide a reasonable estimate of salt intake is worthy of further investigation because this could substantially reduce the cost of future monitoring efforts for some countries.
Acknowledgments
The authors would like to thank Lithgow City Council, the Nepean Blue Mountains Local Area Health Network for their support and most importantly all of the participants for their support and interest in the study.
References
Footnotes
-
Contributors M-AL contributed to study concept and design, data collection, analysis and interpretation of the data, drafting the article and final version of the article. JW contributed to the study design, revising content and final approval of the version to be published. AC contributed to the analysis of data, revising content and final approval of the version to be published, DP contributed to the analysis and interpretation of data, revising content and final approval of the version to be published. PJ contributed to the study design, interpretation of data, revising content and final approval of the version to be published. JC, WS, MW and CN contributed to the conception and study design, revising critically and final approval of the version to be published. FB and VF contributed to the analysis and interpretation of the data, revising critically and final approval of the version to be published. BN contributed to the conception and study design, analysis and interpretation of data, drafting of the article, revising critically and final approval of the version to be published.
-
Funding This work was supported by a National Health and Medical Research Council (NHMRC) of Australia partnership project (Neal #13372) which includes The George Institute for Global Health in partnership with the Australian Division of World Action on Salt and Health; the Australian Food and Grocery Council; the New South Wales Food Authority; and New South Wales Health.
-
Competing interests BN was supported by an Australian Research Council Future Fellowship and an NHMRC Fellowship, MW by a NHMRC Fellowship and JW by a National Heart Foundation and Stroke Foundation postdoctoral research fellowship. JW is the coordinator, and BN is the Chairman of the Australian Division of World Action on Salt and Health.
-
Ethics approval Permission to undertake the study was obtained from the Lithgow City Council and the project was approved by the University of Sydney Human Research Ethics Committee, New South Wales, Australia.
-
Provenance and peer review Not commissioned; externally peer reviewed.
-
Data sharing statement Additional data are available on request to M-AL: maland@georgeinstitute.org.au