Article Text

Abstract
Objective To develop and externally validate a risk algorithm (QAdmissions) to estimate the risk of emergency hospital admission for patients aged 18–100 years in primary care.
Design Prospective open cohort study using routinely collected data from general practice linked to hospital episode data during the 2-year study period 1 January 2010 to 31 December 2011.
Setting 405 general practices in England contributing to the national QResearch database to develop the algorithm. Two validation cohorts to validate the algorithm (1) 202 different QResearch practices and (2) 343 practices in England contributing to the Clinical Practice Research DataLink (CPRD). All general practices had data linked to hospital episode statistics at the individual patient level.
Participants We studied 2 849 381 patients aged 18–100 years in the derivation cohort with over 4.6 million person-years of follow-up. 265 573 of these patients had one or more emergency admissions during follow-up. For the QResearch validation cohort, we identified 1 340 622 patients aged 18–100 years with over 2.2 million person-years of follow-up. Of these patients, 132 723 had one or more emergency admissions during follow-up. The CPRD cohort included 2 475 360 patients aged 18–100 years with over 3.8 million person-years of follow-up. 234 204 of these patients had one or more emergency admissions during follow-up. We excluded patients without a valid NHS number and a valid Townsend score.
Endpoint First (ie, incident) emergency admission to hospital in the next 2 years as recorded on the linked hospital episodes records.
Risk factors Candidate variables recorded on the general practitioner computer system including (1) demographic variables (age, sex, strategic health authority, Townsend deprivation score, ethnicity); (2) lifestyle variables (smoking, alcohol intake); (3) chronic diseases; (4) prescribed medication; (5) clinical values (body mass index, systolic blood pressure); (6) laboratory test results (haemoglobin, platelets, erythrocyte sedimentation rate, ratio of total serum cholesterol to high density lipoprotein cholesterol concentrations, liver function tests). We also included the number of emergency admissions in the preceding year based on information recorded on the linked hospital episodes records.
Results The final QAdmissions algorithm incorporated 30 variables. When applied to the QResearch validation cohort, it explained 41% of the variation in women and 43% of that in men. The D statistic for QAdmissions was 1.7 in women and 1.8 in men. The receiver operating curve statistic was 0.78 for men and 0.77 for women. QAdmissions had good performance on all measures of discrimination and calibration. The positive predictive value for emergency admissions for the top tenth of patients at highest risk was 42% and the sensitivity was 39%. The results for the CPRD validation cohort were similar.
Conclusions The QAdmissions model provided a valid measure of absolute risk of emergency admission to hospital in the general population as shown by its performance in a separate validation cohort. Further research is needed to evaluate the cost-effectiveness of using these algorithms in primary care.
- PRIMARY CARE
- PREVENTIVE MEDICINE
- EPIDEMIOLOGY
This is an Open Access article distributed in accordance with the Creative Commons Attribution Non Commercial (CC BY-NC 3.0) license, which permits others to distribute, remix, adapt, build upon this work non-commercially, and license their derivative works on different terms, provided the original work is properly cited and the use is non-commercial. See: http://creativecommons.org/licenses/by-nc/3.0/
Statistics from Altmetric.com
Article summary
Article focus
-
Methods to identify patients at increased risk of emergency admission to hospital are needed to identify patients for whom interventions may be required to reduce risk of admission.
-
Current risk scoring methods are expensive, unpublished or difficult to implement.
Key messages
-
We have developed and validated a new algorithm to quantify absolute risk of emergency admission to hospital, which includes established risk factors, and which is designed to work in primary care.
-
The QAdmissions model provides a valid measure of absolute emergency admission risk in the general population of patients as shown by its performance in a separate validation cohort.
-
Further research is needed to evaluate the clinical outcomes and cost-effectiveness of using these algorithms in primary care.
Strengths and limitations of this study
-
The key strengths include use of linked data on hospital admissions, study size, representativeness, and lack of selection and recall bias.
-
Limitations include potential for bias due to missing data.
Introduction
Unplanned admissions account for an estimated 11 billion pounds a year in England, which is a considerable proportion of the National Health Service (NHS) budget.1 Such admissions are not only costly but also potentially distressing to individuals. Successive governments have tried to implement approaches to prevent the rise in emergency admissions including identifying patients at high risk of emergency admission so that these patients can be targeted before preventable or avoidable costs have been incurred.
In Spring 2013, the NHS commissioning Board (now NHS England) announced a new Enhanced Service Specification to reward general practitioner (GP) practices for the identification and case management of patients identified as seriously ill or at risk of an emergency admission.2 As part of this, GP practices need to undertake risk profiling and risk stratification of their registered patients on at least a quarterly basis.
Central to any risk stratification and case identification programme is the accuracy and utility of the algorithm used to undertake the risk assessment. In general, a risk stratification algorithm needs to be developed using data from the setting where it will subsequently be used (eg, primary care in England). It needs to be able to distinguish between patients who do or do not experience the event of interest (discrimination) and accurately quantify the level of risk (calibration). It should predict the outcome of interest (eg, emergency admission) for the population of interest (eg, all adult patients registered with the general practitioner). It needs to apply over the relevant time period (eg, 1–2 years) assuming that sufficient time is needed for interventions to have an effect. It needs to include predictors with good clinical face validity and, ideally, include some clinically relevant factors which are amenable to change (ie, help reduce risk of emergency admission). It should preferably incorporate measures of socioeconomic deprivation and ethnicity not only in recognition of the role these factors have as predictors of major diseases, but also to prevent widening health inequalities which can occur when new programmes are introduced. The risk algorithm needs to have the potential to be updated or recalibrated, and its performance should be tested in a population of patients separate from that used to develop the tool to demonstrate that it can reliably identify the target population. Finally, the tool needs to be suitable for implementation in clinical practice.
While a number of emergency admission risk assessment tools have been developed, they are generally designed for use in hospital to identify patients at risk of readmission.3–5 Other current tools focus on specific populations or have not been published or validated. For example, there are a number of American algorithms based on patients enrolled in health maintenance organisations with questionable generalisability.6–8 There are several tools which have been intended for use in primary care. The Emergency Admission Risk Likelihood Index is a six item questionnaire which was developed using data from patients aged 75+ from 17 general practices in the North of England.9 Hence, it only applies to elderly patients and may not be sufficiently representative for wider use. The Predicting Emergency Admissions Over the Next Year (PEONY) score was designed for use in Scottish primary care patients aged 40–65 years.10 However, it does not include morbidity data from primary care, and currently the underlying algorithm is not published or independently validated. Finally, the combined predictive model11 (CPM), developed using data from two Primary Care Trusts, had been designed to work on primary care data linked to three secondary care data sources (inpatient, outpatient, accident and emergency). However, the Department of Health announced in August 2011 that the tools were outdated and in urgent need of a refresh.12
One problem which has beset all the existing risk algorithms is the practical difficulty in implementing them into primary care since they have not been designed to run off routinely collected data that are already in GP computer systems or have not been validated in that setting. While it is possible to extract the primary care data from GP clinical systems into a data warehouse for linkage, processing and feeding back to the practice, this is a complex technical process to achieve in real time. It also has significant information governance challenges given the necessary controls around the processing of personal confidential data by third parties without patient consent.
Therefore, we decided to develop and validate a new risk prediction algorithm to predict the absolute risk of emergency admissions to hospital (QAdmissions) which could meet the above requirements. We were interested to develop an algorithm which incorporates ethnicity and clinical diagnoses, medications and abnormal laboratory results which the healthcare professional in practice can then follow-up. In addition, we decided to develop a tool which could be automatically populated using data solely from GP computer systems and so provide an expedient practical alternative where primary care data are not routinely linked to secondary care data.
Methods
Study design and data source
We conducted a prospective cohort study in a large UK primary care population using a method similar to our analyses for other risk prediction scores such as QRISK2.13 V.35 of the QResearch database was used for this study (http://www.qresearch.org). This is a large validated primary care electronic database containing the health records of 13 million patients registered from 660 general practices using the Egton Medical Information System (EMIS) computer system.13 Practices and patients contained on the database are nationally representative14 and similar to those on other primary care databases using other clinical software systems.15 We included all QResearch practices in England once they had been using their current EMIS system for at least a year (to ensure completeness of recording of morbidity and prescribing data), randomly allocating two-thirds of practices to the derivation dataset with one-third to the validation dataset. The analysis was conducted on QResearch practices in England in order to incorporate hospital episode data linked at the individual patient level via a pseudonymised NHS number. We also assembled a second validation cohort using 343 English practices contributing to the Clinical Practice Research Datalink (CPRD) which had linked hospital episode statistics (HES) data (August 2012 download).
Cohort selection
We identified three open cohorts of patients aged 18–100 at the study entry date, drawn from patients registered with eligible practices between 1 January 2010 and 31 December 2011. We used an open cohort design, rather than a closed cohort design, as this allows patients to enter the population throughout the whole study period rather than require registration on 1 January 2010, thus better reflecting the realities of routine general practice. We excluded registered patients without a valid pseudonymised NHS number as this was needed to link the primary and secondary care data together. We also excluded patients without a valid postcode-related Townsend deprivation score.
For each patient, we determined an entry date to the cohort, which was the latest of the following dates: 18th birthday, date of registration with the practice plus 1 year, date on which the practice computer system was installed plus 1 year, and the beginning of the study period (1 January 2010). Patients were censored at the earliest date of the following: the first emergency hospital admission in the study period, death, deregistration with the practice, last upload of computerised data or the study end date (31 December 2011).
Emergency hospital admission outcomes
The primary outcome measure of interest was the first recorded emergency admission to hospital in the study period. We identified emergency hospital admissions from the HES data, which includes all hospital trusts in England. The HES data was linked at the individual patient level to the QResearch database via a pseudonymised NHS number. Emergency admissions were identified by selecting the standard codes to represent all emergency admissions in England. This information is derived from the method of admission field recorded for each admission. The following codes were included—coded as 21 (accident and emergency); 22 (GP direct to hospital); 23 (GP via a bed bureau); 24 (consultant clinic); 25 (mental health crisis resolution team); 28 (other means). We only included emergency admissions where the admission date and discharge date were both recorded and where the admission date was on or before the discharge date.
Risk factors for emergency admission
We identified a list of candidate variables, focusing on variables which have previously been established to increase risk of emergency admission10 or readmission.4 ,7 We also included predictors used in other risk algorithms where the outcome is likely to require emergency admission (eg, as thrombosis16 or cardiovascular disease17 ,18). We decided to focus on variables which are recorded in the primary care electronic record in order to ensure that the resulting algorithm could be implemented into existing GP computer systems in a way similar to the implementation of similar risk prediction algorithms developed using the QResearch database.4 ,11–14 The full list of candidate variables is shown in table 1 and is summarised as follows:
-
Demographic variables: age, sex, Strategic Health Authority, Townsend deprivation score, ethnicity.
-
Lifestyle variables: smoking status, alcohol intake.
-
Chronic diseases.
-
Medication for statins, non-steroidal anti-inflammatory drugs (NSAIDs), anticoagulants, corticosteroids, antidepressants and antipsychotics at study entry date.
-
Clinical values: body mass index, systolic blood pressure.
-
Laboratory test results: haemoglobin, platelets, erythrocyte sedimentation rate, total serum cholesterol/high-density lipoprotein ratio, liver function tests.
-
Emergency admissions in the year before study entry date (none, 1, 2, 3 or more).
Baseline characteristics of patients in the QResearch derivation cohort, the QResearch validation cohort and the CPRD validation cohort
All the above variables were derived from the patients’ primary care record except for the number of emergency admissions in the year before the study entry date where we used the HES-linked data. We restricted all values of these candidate predictor variables to those recorded in the person's electronic healthcare record before baseline, except for ethnicity where we used the most recently recorded value in the study period before the patient had the outcome or was censored.
We imputed missing values where necessary as described below. Given the large number of candidate variables, we combined factors where appropriate. For example, we combined (1) asthma and chronic obstructive airways disease and (2) schizophrenia and manic depression. We defined abnormal liver function tests as a single variable which denoted either a high γ-GT, aspartate aminotransferase or bilirubin where a high value was at least three times the upper limit of normal.
Model derivation and development
As in previous studies,17 we used the Cox proportional hazards model in the derivation dataset to estimate the coefficients and hazard ratios (HRs) associated with each potential risk factor for the first recorded emergency admission to hospital for males and females separately. We used fractional polynomials to model non-linear risk relationships with age and body mass index where appropriate.19 We tested for interactions between each variable and age and included significant interactions in the final model where they improved the model fit. Continuous variables were centred for analysis. Our main analyses used multiple imputation to replace missing values for systolic blood pressure, cholesterol, smoking status, alcohol status and body mass index.
Our final model was fitted based on five multiply imputed datasets using Rubin's rules to combine estimates and standard errors to allow for the uncertainty due to imputing missing data.20 We took the logarithm of HR for each variable from the final model and used these as weights for the risk equations. We combined these weights with the baseline survivor function evaluated at 1 and 2 years to derive a risk equation which could be applied for each time period. There were at least 100 outcome events per variable considered in the prediction model in the derivation cohort.21
Model validation
We tested the performance of the final model (QAdmissions) in the QResearch validation cohort and also in a cohort of practices and patients derived from the Clinical Practice Research Datalink (CPRD). We calculated the 2-year estimated risk of emergency admission for each patient in the validation datasets using multiple imputation to replace missing values as in the derivation dataset.
We calculated the mean predicted and observed risks at 2 years13 and compared these by 10th of the predicted risk for each score. The observed risk at 2 years was obtained using the 2-year Kaplan-Meier estimate. We calculated the receiver operating characteristic (ROC) statistic, the D statistic (a measure of discrimination where higher values indicate better discrimination)22 and an R2 statistic (which is a measure of explained variation for survival data where higher values indicate more variation is explained).23
Since there is no currently accepted threshold for classifying a high risk of emergency admission based on an absolute risk estimate, we examined the distribution of predicted risk values for QAdmissions and calculated a series of centile values. For each centile threshold, we calculated the sensitivity and the observed risk of admission (as an estimate of the positive predictive value) over the 2-year follow-up.
For the main validation analyses, we estimated the risk of emergency admission using predictor variables derived from data recorded in the GP record, except for prior emergency admissions which were derived from the HES-GP-linked data.
We repeated the analyses using data on hospital admissions recorded on the GP record instead of the HES-linked data to derive the prior admissions variable. For this second analysis, we examined the clinical Read codes used to identify hospital admissions on the GP record and selected admissions which were coded either as emergency admissions or referral to accident and emergency. A list of the clinical codes used to identify prior hospital events on the GP data can be found in the first table of the online supplementary appendix. This was then used alongside the other GP data derived predictor variables to calculate the risk scores. This was performed to evaluate the performance of the algorithm in a primary care setting where the GP-HES-linked data are not available (GP-HES is not routinely available in all primary care settings).
All analyses were conducted on the QResearch and CPRD validation cohorts. We used STATA (V.12.1) for all analyses.
Results
Practices and patients
Overall, 607 QResearch practices in England met our inclusion criteria and had been using their current computer system for at least 1 year. Of these, 405 were randomly assigned to the derivation dataset and 202 to the QResearch validation dataset. We identified 2 857 476 patients aged 18–100 years in the derivation cohort. Of these, 4518 (0.16%) had an invalid NHS number and 3577 (0.13%) had a missing Townsend score leaving 2 849 381 eligible patients for analysis. Similarly, we identified 1 343 274 patients in the QResearch validation cohort. Of these 1254 (0.09%) had an invalid NHS number and 1398 (0.10%) had a missing Townsend score leaving 1 340 622 eligible patients for analysis.
Table 1 compares the characteristics of eligible patients in the QResearch derivation and validation cohort. It also includes the characteristics of the 2 475 360 patients from 343 CPRD practices which met the inclusion criteria and which constitute the second validation cohort. The baseline characteristics of all three cohorts were similar except that the recording of ethnicity was higher in the two QResearch cohorts (75% and 76%) than in CPRD (53%).
Emergency admissions outcome
Table 2 shows the numbers of cases (patients with one or more admissions in follow-up) and incidence rates of first emergency admissions by age, sex, ethnicity and Strategic Health Authority (SHA) in each cohort. Overall in the derivation cohort, we identified 265 573 patients (9.3% of 2 849 381) with an incident emergency admission arising from 4.6 million person-years of observation. Of these, 181 784 (68.5%) had one admission and 83 789 (31.6%) had more than one emergency admission in the study period. Of the 265 573 patients with an emergency admission, 212 803 (80.1%) had no emergency admissions in the previous 12 months; 34 246(12.9%) had one admission; 10 741(4.0%) had two admissions and 7783 (2.9%) had three or more admissions. The median duration of admission was 2 days (IQR 0–6 days).
Incidence rates of first emergency admissions to hospital during follow-up for men and women in the QResearch derivation cohort, the QResearch validation cohort and the CPRD validation cohort
In the QResearch validation cohort, we identified 132 723 patients (9.9% of 1 340 622) with an incident emergency admission arising from 2.2 million years of observation. Of these, 90 622(68.3%) had one admission only and 42 101 (31.7%) had more than one admission. The median duration of admission was 2 days (IQR 0–6 days).
The crude incidence rate of emergency admission was higher in women than in men and rose steeply with age. The age-sex standardised emergency admission rates varied between SHAs with the highest rates in SHAs in the North East. The emergency admission rates for the CPRD validation cohort as recorded on the CPRD-HES-linked data are similar to those for both QResearch cohorts for age, sex and ethnicity.
Model development
Table 3 shows the results of the Cox regression analysis for the final QAdmissions model. Details of the fractional polynomial terms for age and body mass index are shown in the footnote of the table. The final model included interactions between age and the following variables in men and women: prior admissions, type 2 diabetes, venous thromboembolism, epilepsy, manic depression/schizophrenia, chronic renal disease, malabsorption, chronic liver/pancreatic disease, NSAIDs, anticoagulants, antidepressants and antipsychotics. In addition for men, there were interactions between age and atrial fibrillation and cardiovascular disease. The interactions with age indicated higher HRs for these risk factors among younger patients compared with older patients.
Adjusted HRs (95% CI) for emergency admission to hospital for the final QAdmissions model in the derivation cohort. HRs are adjusted for fractional polynomial terms for age and BMI
Increasing material deprivation (as measured by the Townsend score) was associated with increasing risk of admission. Women in the Pakistani, Caribbean and Black African groups had significantly increased risks of emergency admission compared with women who were white or who did not have ethnicity recorded. Men in the Indian, Bangladeshi, Chinese and the other Asian groups had significantly lower risks compared with men who were white or who did not have ethnicity recorded.
Prior emergency admission to hospital was associated with increased risk of emergency admission in men and women. For example, compared with men with no emergency admissions in the previous 12 months, there was a 2.7-fold increased risk in men with one previous admission; a 4.4-fold increased risk for two prior admissions and an 8.3-fold increased risk for those with three or more prior admissions. There was a similar pattern for women.
There was a ‘dose–response’ relationship for smoking with heavy smokers having higher risks than moderate smokers, light smokers or ex-smokers. There was a ‘J-shaped’ effect for alcohol with lower risks for those recorded as trivial, light or moderate drinkers and higher risks for those recorded as very heavy drinkers or non-drinkers. This was despite adjustment for a diagnosis of chronic liver/pancreatic disease and the presence of abnormal liver function tests.
All the other comorbidities and medications in the table were significantly associated with increased risks in men and women. Patients with a haemoglobin value of <11 g/dL, those with raised platelets and those with at least one abnormal liver function test also had increased risks of emergency admission.
Calibration and discrimination in the validation cohort
In the QResearch validation cohort, the QAdmissions risk scores calculated using the GP-HES-linked data explained 41% of the variation in women and 43% of that in men (table 4). The D statistic was 1.7 in women and 1.8 in men. The ROC value was 0.77 for women and 0.78 for men.
Validation statistics for the QAdmissions prediction algorithm in the QResearch and CPRD validation cohorts using (a) the score calculated using the GP-HES-linked data and (b) the score calculated using the GP data alone
Figure 1 displays the predicted and observed risks of emergency admission at 2 years across each 10th of the predicted risk (1 representing the lowest risk and 10 the highest risk). This shows that the QAdmissions algorithm was well calibrated.

Mean predicted risks and observed risk of emergency admission to hospital at 2 years by 10th of the predicted risk applying the QAdmissions risk prediction scores to all patients in the QResearch validation cohort (results from Clinical Practice Research DataLink available from the authors).
Table 5 shows the performance statistics for QAdmissions at different thresholds in the QResearch validation cohort using the GP-HES-linked data and the GP data alone. For example, for the top 10% of men and women at the highest risk based on the GP-HES data (ie, those with a score of 23% or higher), QAdmissions had a sensitivity of 39% and a positive predictive value (based on the observed risk at 2 years) of 42%.
Performance of QAdmissions for predicting emergency admissions in the QResearch and CPRD validation cohorts based on (a) the score calculated using the GP-HES-linked data and (b) the score calculated using the GP data alone.
The performance of the QAdmissions score calculated using the GP-HES-linked data was marginally better than that using data from the GP record alone. For example, the ROC values for women were 0.77 using the GP-HES-linked data and 0.76 for the GP data alone (table 4). Calibration was similar.
The results for the validation statistics in the CPRD cohort were very similar to those for the QResearch validation cohort, as shown in tables 4 and 5.
Figures 2 and 3 show clinical examples of applying the QAdmissions score to two individual patients.
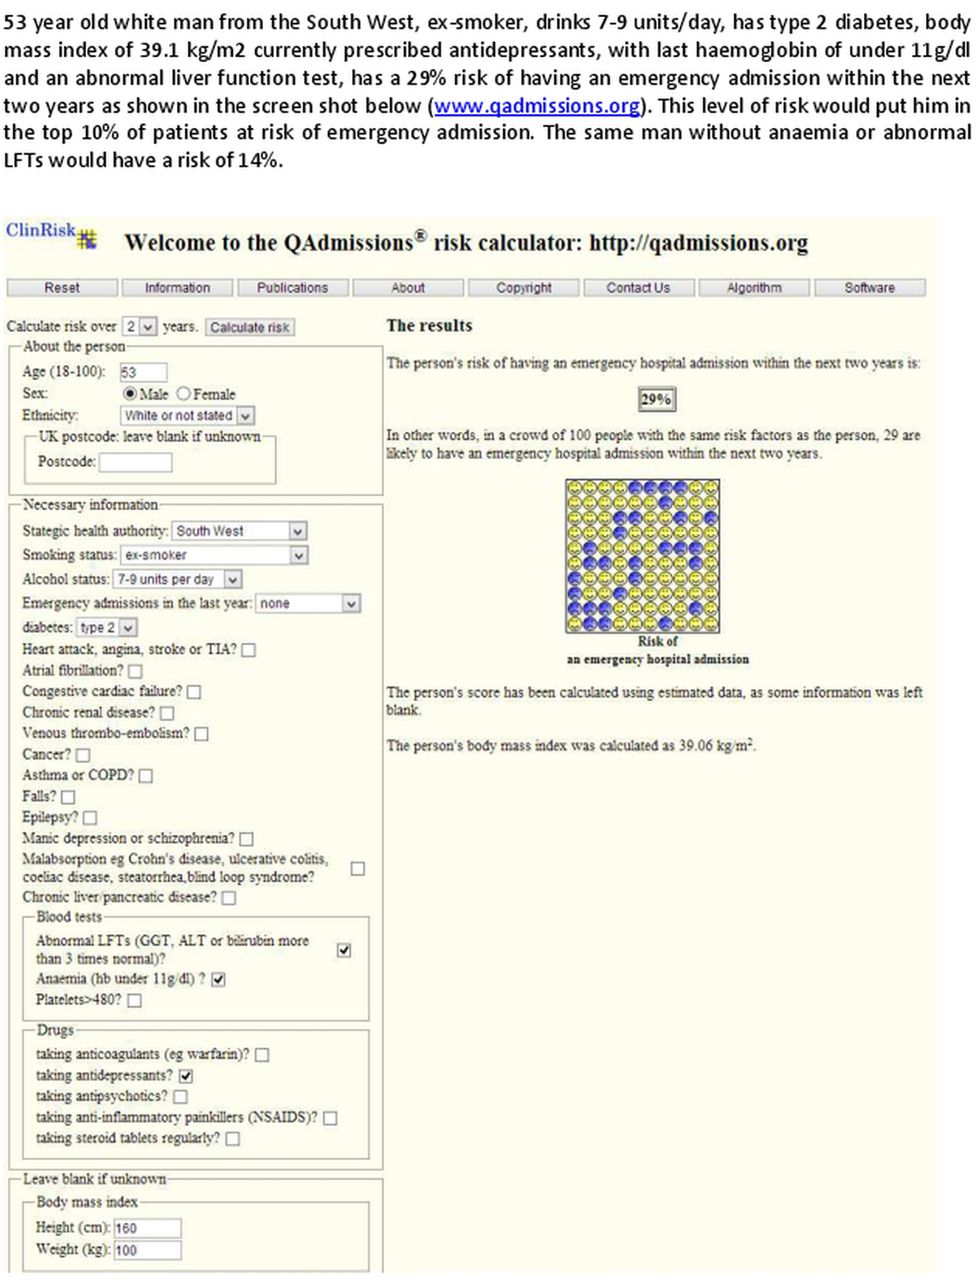
Clinical case.

Clinical case.
Discussion
Summary of key findings
We have developed and externally validated a new algorithm (QAdmissions) to identify patients at high risk of emergency admission to hospital using contemporaneous primary care data from the UK. The algorithm incorporates 30 predictor variables which are associated with increased risk of hospital admission including sociodemographic variables, lifestyle, morbidity, medication and laboratory results such as anaemia and abnormal liver function tests. The algorithm can be applied to any adult in a primary care setting regardless of whether they have had a prior emergency admission. The algorithm is intended to be used for regular batch processing of a dataset containing an entire population to generate a rank-ordered list of patients at high risk for further assessment and management. It can be integrated into GP clinical computer systems by the systems suppliers in a way similar to how other risk prediction tools such as QRISK2,17 QDiabetes24 and QFracture25 have been implemented. Alternatively, a stand-alone version is available at the publicly available website http://www.qadmissions.org. This can be used for the assessment of individual patients.
QAdmissions provides an estimate of absolute risk of admission either at 1 or 2 years—the latter being potentially useful for interventions which are likely to work over a more extended time period. It includes a weighting for geographical area at the SHA level to help take account of local differences in configuration of services. Like the CPM,11 it can be applied across the general population to help health organisations to design and implement interventions across the risk spectrum as follows: prevention and wellness promotion for low-risk patients; supported self-care interventions for moderate risk patients; early intervention care management for patients with emerging risk and intensive case management for very high-risk patients.11
We undertook an additional validation by applying the final QAdmissions model to GP data alone and compared with the results using GP-HES-linked data. The results in both the QResearch and CPRD validation cohorts were comparable and hence provide evidence to support the implementation of QAdmissions within GP computer systems based solely on GP data. This potentially overcomes one of the main logistical difficulties in implementing other risk scores since they require real-time data linkage of primary data with secondary care data. Much of the apparent complexity relating to additional variables and interactions can be incorporated into the software using data already entered into the patient's electronic health record. The algorithm uses routinely collected data, which means it can be easily and regularly updated to reflect changes in populations, improvements in data quality or coding, advances in knowledge and evolving guidelines.
As with the PEONY algorithm,10 QAdmissions includes age, deprivation, prior emergency admission and medications (eg, antidepressants, antipsychotics and analgesics) and these were all significantly associated with an increased risk of emergency admission. We found similar interactions between these variables and age with higher risks in younger patients, which diminished with increasing age. We have included many more emergency admissions in the derivation sample (265 573 events rather than 6793); more up-to-date data (2010–2011 rather than 1999–2004), which is important given the rise in emergency admission rates over the last 10 years. In contrast to PEONY, QAdmissions has been modelled using a more ethnically diverse population and includes morbidity in addition to prescribed medication. Apart from prior hospital admissions, all of the variables in the model are derived from the primary care record.
Although not directly comparable because of differences in the samples to which the algorithms can be applied and also the outcomes predicted, the positive predictive value for the top 1% of patients at highest risk was higher for QAdmissions (73%) than PEONY (59%), although the sensitivity was similar (7% vs 8%). Our ROC value of 0.77 is comparable to the value of 0.79 reported in the validation cohort of PEONY and significantly higher than the 0.69 reported by the authors of the PARR score4 and the 0.70 for PARR-30.26 Our ROC value is also significantly higher than that reported by Donze et al (0.71), although their risk prediction model was designed to identify patients at high risk of 30 day readmission to hospital, which is an outcome different from the one in our study.27
We have not provided definite comment on the threshold of absolute risk that should be used for intervention, as that would require cost-effectiveness analyses which are outside the scope of this study. We have, however, provided analyses using a range of thresholds of risk, which can be used to help inform future analyses. Sensitivity is important as it is a measure of how well the algorithm performs in finding cases that might be suitable for intervention. If the risk threshold is set too high, then the sensitivity will be low and a large number of patients with emergency admission will be ‘missed’ by the algorithm. Conversely, a high-risk threshold is likely to result in a better positive predictive value, which means a higher proportion of those identified are likely to go on to have an emergency admission. So there is a balance to be struck between the sensitivity and positive predictive value of the score, which depends on the risk threshold selected, resources available and likely effectiveness of the interventions. For example, if the top 1% of patients at highest risk are targeted, then patients with an estimated absolute risk of admission of greater than 69% will be identified. This will have a good positive predictive value (73%) but a low sensitivity (7%). If the top 10% of patients at highest risk are identified, the sensitivity at this threshold will be 39% and the positive predictive value will be 42%. However, more patients will require assessment, so the costs of the intervention will be higher.
Strengths and limitations of this study
The methods to derive and validate this model are the same as for a range of other clinical risk prediction tools derived from the QResearch database.16 ,17 ,24 ,25 ,28 The strengths and limitations of the approach have already been discussed in detail15 ,16 ,24 ,29–31 including information on multiple imputation of missing data. In summary, the key strengths include size, duration of follow-up, representativeness and lack of selection, recall and respondent bias. UK general practices have good levels of accuracy and completeness in recording clinical diagnoses and prescribed medications.32 ,33 We think our study has good face validity since it has been conducted in a setting where the majority of patients in the UK are assessed, treated and followed up. Limitations include lack of formally adjudicated outcomes, information bias and potential for bias due to missing data. Our database has linked data for admission to hospital and is therefore likely to have picked up the majority of emergency admissions, thereby minimising ascertainment bias. There is scope for improvement in the recording of emergency admission on the GP clinical record as some codes are used which identify an admission has occurred but not the method or type of admission. An information standard for recording of hospital admissions on GP clinical records could help address this and is likely to improve the performance of the score when applied to GP data alone.
We excluded people without a valid NHS number as this was required to link the primary and secondary care data for individual patients. We also excluded patients without a valid deprivation score since this group may represent a more transient population where follow-up could be unreliable or unrepresentative. Their deprivation scores are unlikely to be missing at random, so we did not think it would be appropriate to impute them.
The present validation has been done on two completely separate sets of practices and individuals to those which were used to develop the score. One of the validation cohorts was derived from the QResearch database, so the practices all use the same GP clinical computer system (EMIS—the computer system used by 55% of UK GPs). The favourable results from the validation which uses CPRD is a more stringent test since this is a fully external set of practices which use a different computer system. Ideally, an additional validation should be undertaken using another external data source by an independent team not involving the study authors.
This QAdmissions model has been developed using data from general practices in England and includes a postcode-based deprivation score. It is therefore not likely to be applicable for clinical use in international settings without some modification of the English-specific risk factors, and validation in the setting in which it is intended to be used.
In summary, we have developed and validated a new algorithm to predict risk of emergency hospital admission. QAdmissions has some advantages compared with the current risk-scoring methods. QAdmissions also provides an accurate measure of absolute risk of emergency hospital admission in the general population as shown by its performance in a separate validation cohort. Further research is needed to evaluate the clinical outcomes and cost-effectiveness of using this algorithm in primary care.
Acknowledgments
The authors would like to acknowledge the contribution of EMIS practices who contribute to QResearch and the University of Nottingham and EMIS for expertise in establishing, developing and supporting the database. They also acknowledge the contribution of the NHS Information Centre for pseudonymising the Hospital Episodes Statistics dataset so that the data could be linked to patients in the QResearch database.
References
Supplementary materials
Supplementary Data
This web only file has been produced by the BMJ Publishing Group from an electronic file supplied by the author(s) and has not been edited for content.
Files in this Data Supplement:
- Data supplement 1 - Online supplement
Footnotes
-
Contributors JHC initiated the study, undertook the literature review, data extraction, data manipulation and primary data analysis and wrote the first draft of the paper. CC contributed to the design, analysis, interpretation and drafting of the paper. All authors have read and approved the final version of the manuscript.
-
Funding The North East London Commissioning support group provided limited funding to support the later stages of this work. The National School for Primary Care Research contributed to the license costs of the Clinical Practice Research Data Link which was used for the external validation of QAdmissions.
-
Competing interests JHC is the professor of clinical epidemiology at the University of Nottingham and co-director of QResearch—a not-for-profit organisation which is a joint partnership between the University of Nottingham and EMIS (leading commercial supplier of IT for 60% of general practices in the UK). JHC is also the director of ClinRisk Ltd which produces open and closed source software to ensure the reliable and updatable implementation of clinical risk algorithms within clinical computer systems to help improve patient care. CC is the associate professor of Medical Statistics at the University of Nottingham and a consultant statistician for ClinRisk Ltd.
-
Ethics approval The project was approved in accordance with the QResearch agreement with Trent Multi-Centre Research Ethics Committee. The validation of QAdmissions on CPRD was approved by the Independent Scientific Advisory Group (Reference 13_079).
-
Provenance and peer review Not commissioned; externally peer reviewed.
-
Data sharing statement The patient level data from QResearch are specifically licensed according to its governance framework. See http://www.qresearch.org for further details. The QAdmissions algorithm will be published as open source software under the AGPLv3 Public License.