Article Text

Abstract
Objectives Transient ischaemic attack (TIA) is a medical emergency requiring rapid access to effective, organised, stroke prevention. There are about 90 000 TIAs per year in the UK. We assessed whether stroke-prevention services in the UK meet Government targets.
Design Cross-sectional survey.
Setting All UK clinical and imaging stroke-prevention services.
Intervention Electronic structured survey delivered over the web with automatic recording of responses into a database; reminders to non-respondents. The survey sought information on clinic frequency, staff, case-mix, details of brain and carotid artery imaging, medical and surgical treatments.
Results 114 stroke clinical and 146 imaging surveys were completed (both response rates 45%). Stroke-prevention services were available in most (97%) centres but only 31% operated 7 days/week. Half of the clinic referrals were TIA mimics, most patients (75%) were prescribed secondary prevention prior to clinic referral, and nurses performed the medical assessment in 28% of centres. CT was the most common and fastest first-line investigation; MR, used in 51% of centres, mostly after CT, was delayed up to 2 weeks in 26%; 51% of centres omitted blood-sensitive (GRE/T2*) MR sequences. Carotid imaging was with ultrasound in 95% of centres and 59% performed endarterectomy within 1 week of deciding to operate.
Conclusions Stroke-prevention services are widely available in the UK. Delays to MRI, its use in addition to CT while omitting key sequences to diagnose haemorrhage, limit the potential benefit of MRI in stroke prevention, but inflate costs. Assessing TIA mimics requires clinical neurology expertise yet nurses run 28% of clinics. Further improvements are still required for optimal stroke prevention.
- ACCIDENT & EMERGENCY MEDICINE
This is an Open Access article distributed in accordance with the Creative Commons Attribution Non Commercial (CC BY-NC 3.0) license, which permits others to distribute, remix, adapt, build upon this work non-commercially, and license their derivative works on different terms, provided the original work is properly cited and the use is non-commercial. See: http://creativecommons.org/licenses/by-nc/3.0/
Statistics from Altmetric.com
Article summary
Article focus
-
Is the current provision of stroke-prevention clinical services adequate to meet the volume of work in the UK?
-
Is access to brain and carotid imaging adequate to meet the demand and is imaging being used efficiently?
-
Who is providing these services?
Key messages
-
Most responding centres had some form of rapid access stroke-prevention clinic.
-
Front-line assessment was by nurses in nearly a third of clinics, but about half of patients have a transient ischaemic attack mimic which requires medical expertise for diagnosis.
-
There was an efficient use of CT of the brain and carotid ultrasound imaging, but less good access to MR brain imaging and this was often used incorrectly or inefficiently.
Strengths and limitations of this study
-
The survey covered the whole of the UK and achieved a 45% response rate.
-
Clinical and imaging service responses were highly concurrent.
-
Services may be much worse in areas that did not respond.
Background
Transient ischaemic attack (TIA) and minor stroke are medical emergencies. In the UK, there are 80 000–90 000 TIAs and minor strokes every year.1 ,2 The benefit of medical or surgical treatment to prevent recurrent stroke after TIA is greatest if given as early as possible3–5; the benefit falls rapidly with increasing delay.6 ,7 Patients with TIA and minor stroke need a rapid, comprehensive assessment and active management to reduce the short-term and long-term risks of recurrent stroke. Establishing an accurate diagnosis and delivering effective stroke prevention is challenging and requires organised stroke services. National Health Service (NHS) Improvement in England introduced tariffs to encourage the establishment of stroke-prevention services which meet the key performance criteria; there are supplementary tariffs for achieving optimum management of high risk TIA patients by rapid triage of patients with ABCD2 score ≥4 including use of MRI (additional amount payable £450 to £634 per patient in 2012, equivalent to $670–945 US).8 ,9 We surveyed the UK clinical and imaging secondary stroke-prevention services to determine their performance against recent guidelines.10
Methods
We devised two electronic survey questionnaires: one for clinical stroke-prevention services and one for imaging services using the online survey software ‘SurveyMonkey’ (http://www.surveymonkey.com). These were informed by previous questionnaires sent to stroke services which achieved high response rates.11–13 We used a ‘closed’, ‘structured’ response format. Both questionnaires provided information on the rationale and the purpose of the study, including details of the research team, and incorporated best research practice issues such as confidentiality and informed consent.
Following pilot testing, the agreed versions of the survey questionnaires (available on request) contained detailed questions addressing the current provision of stroke-prevention services (56 questions) and imaging services (47 questions) focusing on the volume of work, capacity, professionals involved, type and timing of brain and carotid imaging (within or outside normal office hours, for inpatients or outpatients) and carotid endarterectomy rates. We considered eligible participants to be all clinical leads of the UK stroke services and radiology departments.
We offered no incentives to participate in the surveys. The responses were completely anonymous and the completion was voluntary; hence, the approval of Ethics Committees was not required. We sent letters of invitation explaining the objectives and providing links to access the questionnaires online in April 2011 by email or post, via multiple routes, to all UK stroke clinical leads and Radiology Directorates, including: stroke leads of all 15 NHS Boards in Scotland through the Scottish Stroke Care Audit; the 27 stroke networks (with three to nine clinical sites within each network) through NHS Improvement following contact with the Department of Health; to Stroke Leads in Trust Hospitals through the Royal College of Physicians Sentinel Stroke Audit database (200 hospitals in 158 Trusts in England, Wales and Northern Ireland); to Radiology Directorate Leads in England through NHS Improvement and the Magnetic Resonance National Evaluation Team database; all 12 Scottish Clinical Directors of Radiology through the Diagnostic Imaging Clinical Network and to clinical and imaging stroke services in Wales through the Stroke Collaborative. The surveys went to 171 Acute Trusts, 129 Foundation Trusts, seven Welsh Trusts, hospitals in the 15 NHS Boards in Scotland and hospitals in Northern Ireland. We estimated from the contact lists that there were in total 253 Stroke Services sites and 342 Radiology Departments to contact although there is no central list of all this information in one place. Our questionnaire included questions about stroke patients that were assessed at the hospital generally as well as in specific clinics, for example, in acute receiving units or general medicine, with the intention of obtaining information on all stroke-prevention pathways. Details of the surveys and the online links were also disseminated through the Royal College of Physicians website and advertised through the NHS Improvement Stroke and Radiology newsletters. Reminder messages were sent to non-respondents in June 2011.
Data management and analysis
The results of both internet surveys were reported according to the Checklist for Reporting Results of Internet E-Surveys (CHERRIES) statement.14
Surveys results were generated using SurveyMonkey software and entered into an Excel spreadsheet. We expressed the clinical leads’ answers as proportions, medians or means. Not all respondents answered all the questions, therefore the percentages reported are of the actual numbers of respondents. To calculate the response rate, we divided the number of clinical leads to whom we initially sent the invitation to participate by the number of participants who actually completed the online questionnaires. However, as both surveys were also disseminated and advertised through professional body websites and newsletters, it was not feasible to calculate the exact number of all potential respondents contacted. The surveys were completed anonymously, and therefore it was not possible to associate services with geographical location.
Results
One hundred and fourteen Stroke Service surveys and 146 Imaging Service surveys were partially or fully completed, a response rate of 45% for each.
Stroke-prevention clinics
Among the 114 respondents, the mean catchment population was 400 000 people (median 300 000); 97% indicated that their hospital had a specialist stroke-prevention clinic. The service was run at least once a week in 99%; every weekday in 47% and every day in 31%. Most centres (86%, 88/102 respondents) saw between one and five new patients per clinic. In half of the clinics (51/102 respondents), the estimated proportion of patients ultimately diagnosed as TIA/minor stroke mimics was 41–60%; in 31% of centres, it was between 60% and 79%. In only 16% of centres did definite TIA/minor strokes make up the majority (61–100%) of attendees (figure 1).
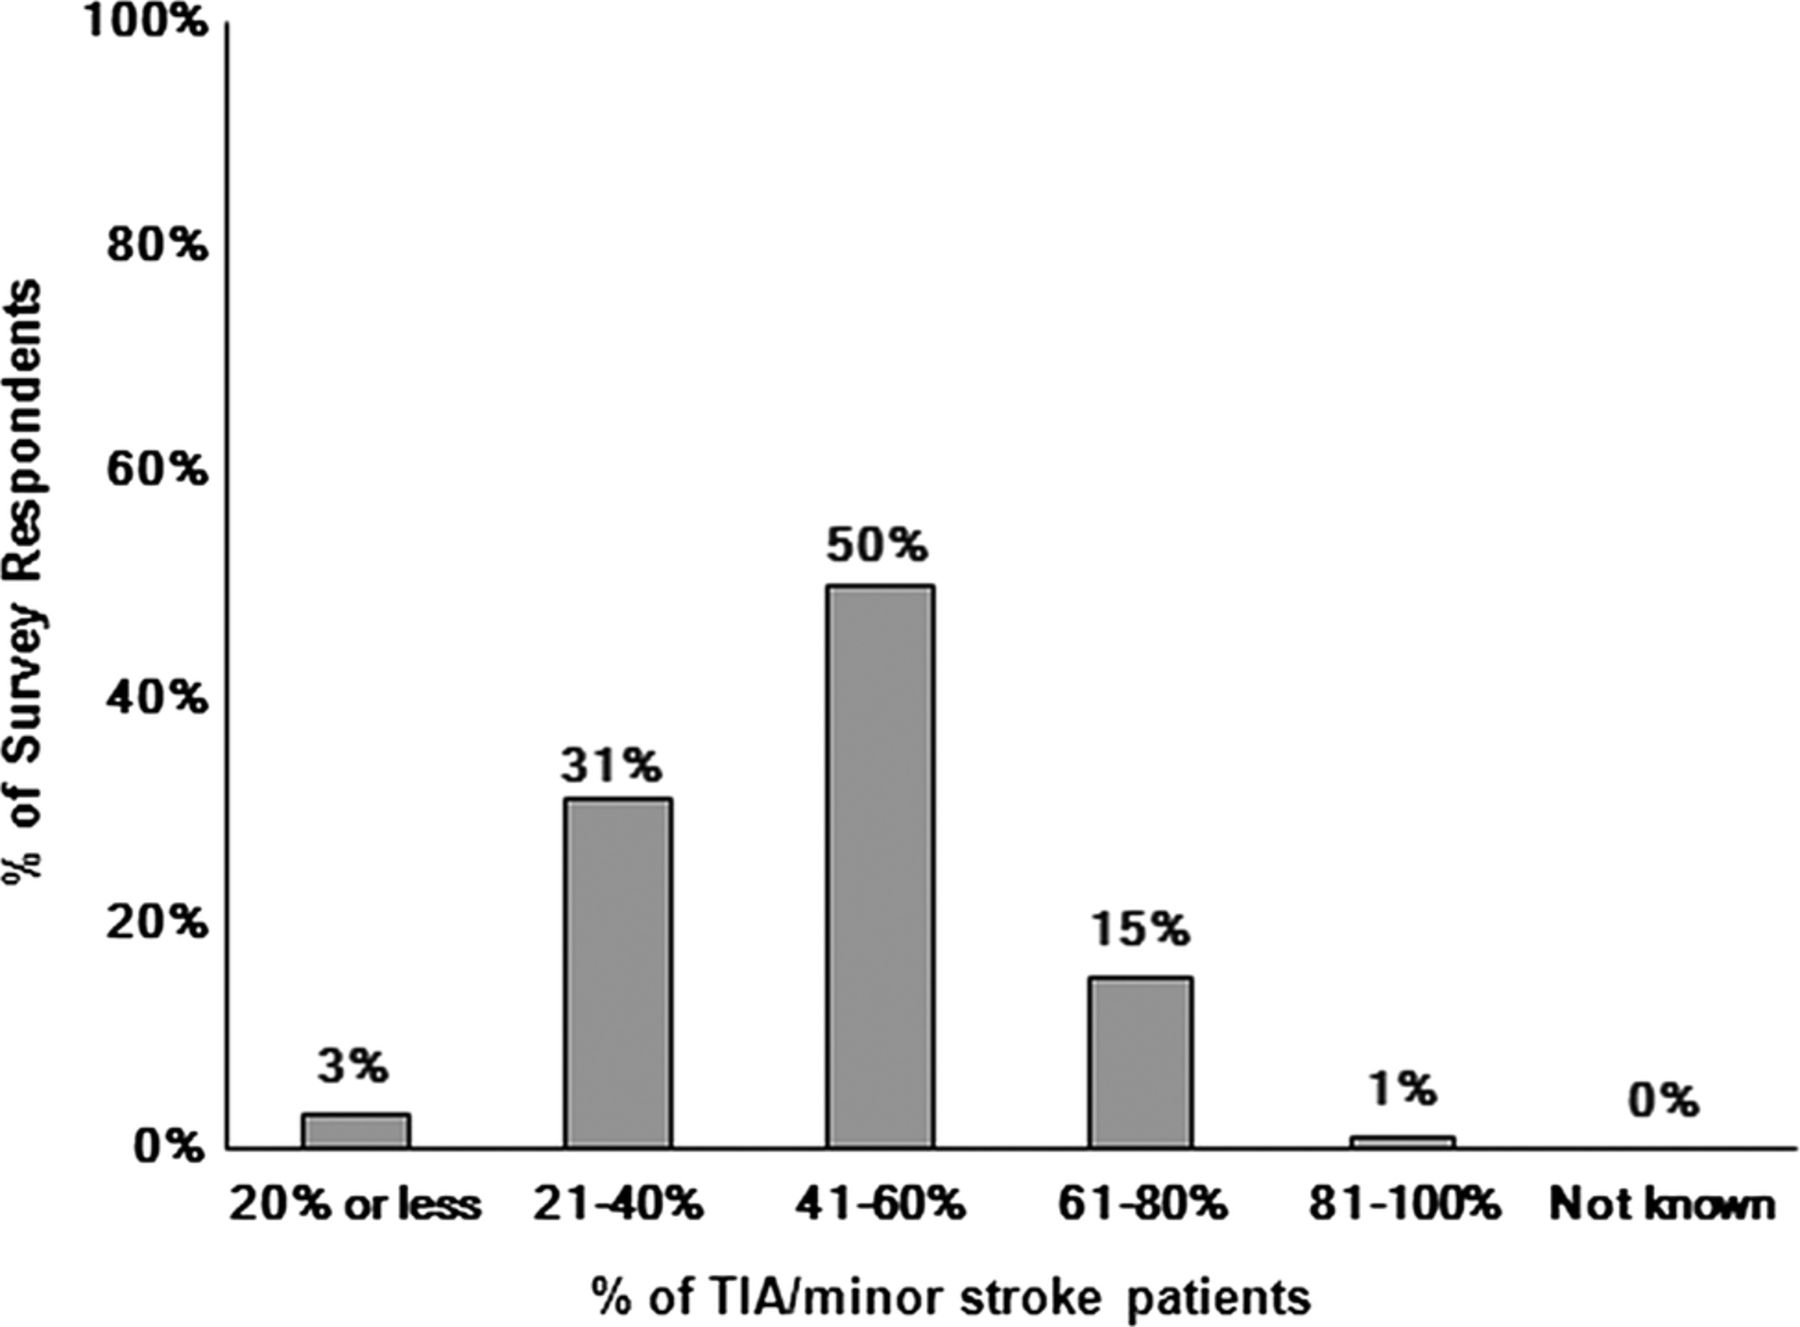
Proportion of patients attending the stroke-prevention clinic who were ultimately diagnosed as having transient ischaemic attack or minor stroke. In total, 102 of the 114 centres answered this question.
Thirty-five per cent of the TIA/minor stroke patients were seen by the stroke-prevention clinic within 24 h, 25% between 2 and 3 days and about 20% within 1 week of their symptoms. Thirteen per cent of centres indicated that patients considered as high risk according to the ABCD2 risk prediction score were seen within 24 h of referral and low-risk patients within 7 days.
Most stroke-prevention clinics were run by consultants (stroke physicians; neurologists; geriatricians). However, the main medical assessment/triaging was undertaken by nurses in 28% of centres. The final diagnosis was established either with input from, or by a consultant in 71% of centres.
In most centres, most patients seen at the specialist stroke-prevention service had already been prescribed secondary prevention drugs (eg, aspirin; statins) for their recent suspected TIA/minor stroke by their referring doctor (see online supplementary table S1).
Brain imaging of TIA/minor stroke
The stroke services survey showed that CT was routinely used as the main brain imaging modality in 84% (98/114 respondents) and that MRI was used in only 51% of centres for stroke prevention. This concurred very closely with the imaging services survey which showed that CT was the main modality in most departments (86%, 49/57 respondents). Details of access to CT and MR are provided in online supplementary tables S2 and S3. The stroke prevention as well as imaging surveys also showed that most patients were having CT as the first-line test (figure 2A,B). The proportion of TIA/minor stroke patients for whom a subsequent MRI was requested after an initial CT varied considerably (range 0–60%; see online supplementary figure S1), the waiting time for MR after CT being 1 month in about half of centres (47%). The results of brain imaging were returned to the stroke service on the day of scanning in 66% of centres; for 22%, however, it took more than 2 days. In most centres (76%), positive brain imaging results (eg, haemorrhage) were provided to the stroke-prevention clinic immediately.

Proportion of patients suspected of transient ischaemic attack/minor stroke who had CT or MRI as first-line brain imaging investigation. (A) Imaging services survey (55/146 responders). (B) Stroke-prevention services survey (101/114 responders).
The routine MR sequences used for TIA/minor stroke were primarily focused on detecting ischaemia: T1-weighted or T2-weighted, diffusion-weighted imaging (DWI) and Fluid Attenuated Inversion Recovery sequences. Fewer than half of the departments (49%) performed sequences that are sensitive to haemorrhage (eg, gradient echo, GRE/T2*; see online supplementary figure S2). Some departments (18%) used only DWI and T2-weighted sequences routinely, thus limiting the chance of detecting either cerebral haemorrhage or non-vascular brain lesions that mimic stroke/TIA.
Carotid artery imaging and endarterectomy
Carotid artery imaging most frequently took place the day of the clinic (47%, 47/100 respondents). Doppler ultrasound (DUS) was the first-line carotid/vertebral imaging in most centres (95%). Most centres (80%) provided the results of carotid artery imaging on the same day, and most centres (86%; 85/99 respondents) provided important positive results immediately. A repeat DUS (19%) or CTA (60%) or contrast MRA (41% of centres) was used as confirmatory tests prior to referral for endarterectomy.
The time between the decision to perform a carotid endarterectomy and the actual surgical procedure was less than 1 week in 59% of centres and between 1 and 3 weeks in approximately 37% of centres (see online supplementary figure S3). No stroke service performed endarterectomy more than 6 months after the decision to operate.
Workload volume and capacity
During 2010, on average of 4905 CT brain scans were performed per radiology department (range 20–48 346; median 2500), 18% were conducted out-of-hours but with considerable variation. On average, 686 CT brain scans were for patients with suspected TIA/minor stroke (range 0–5000 scans; median 200 scans), that is, about 14% of the total workload. On average, 9% of these CT scans were performed out-of-hours (range 0–60% scans; median 2% scans).
During 2010, on average, 2888 brain MRI were performed per radiology department (range 20–24 391 scans; median 1530 scans), only 3% of MR scans were conducted out-of-hours (most performed no MR brain imaging out-of-hours). On average, 258 MR brain scans were conducted on patients suspected of TIA/minor stroke (range 0–1200 scans; median 100 scans), that is, about 9% of the total workload.
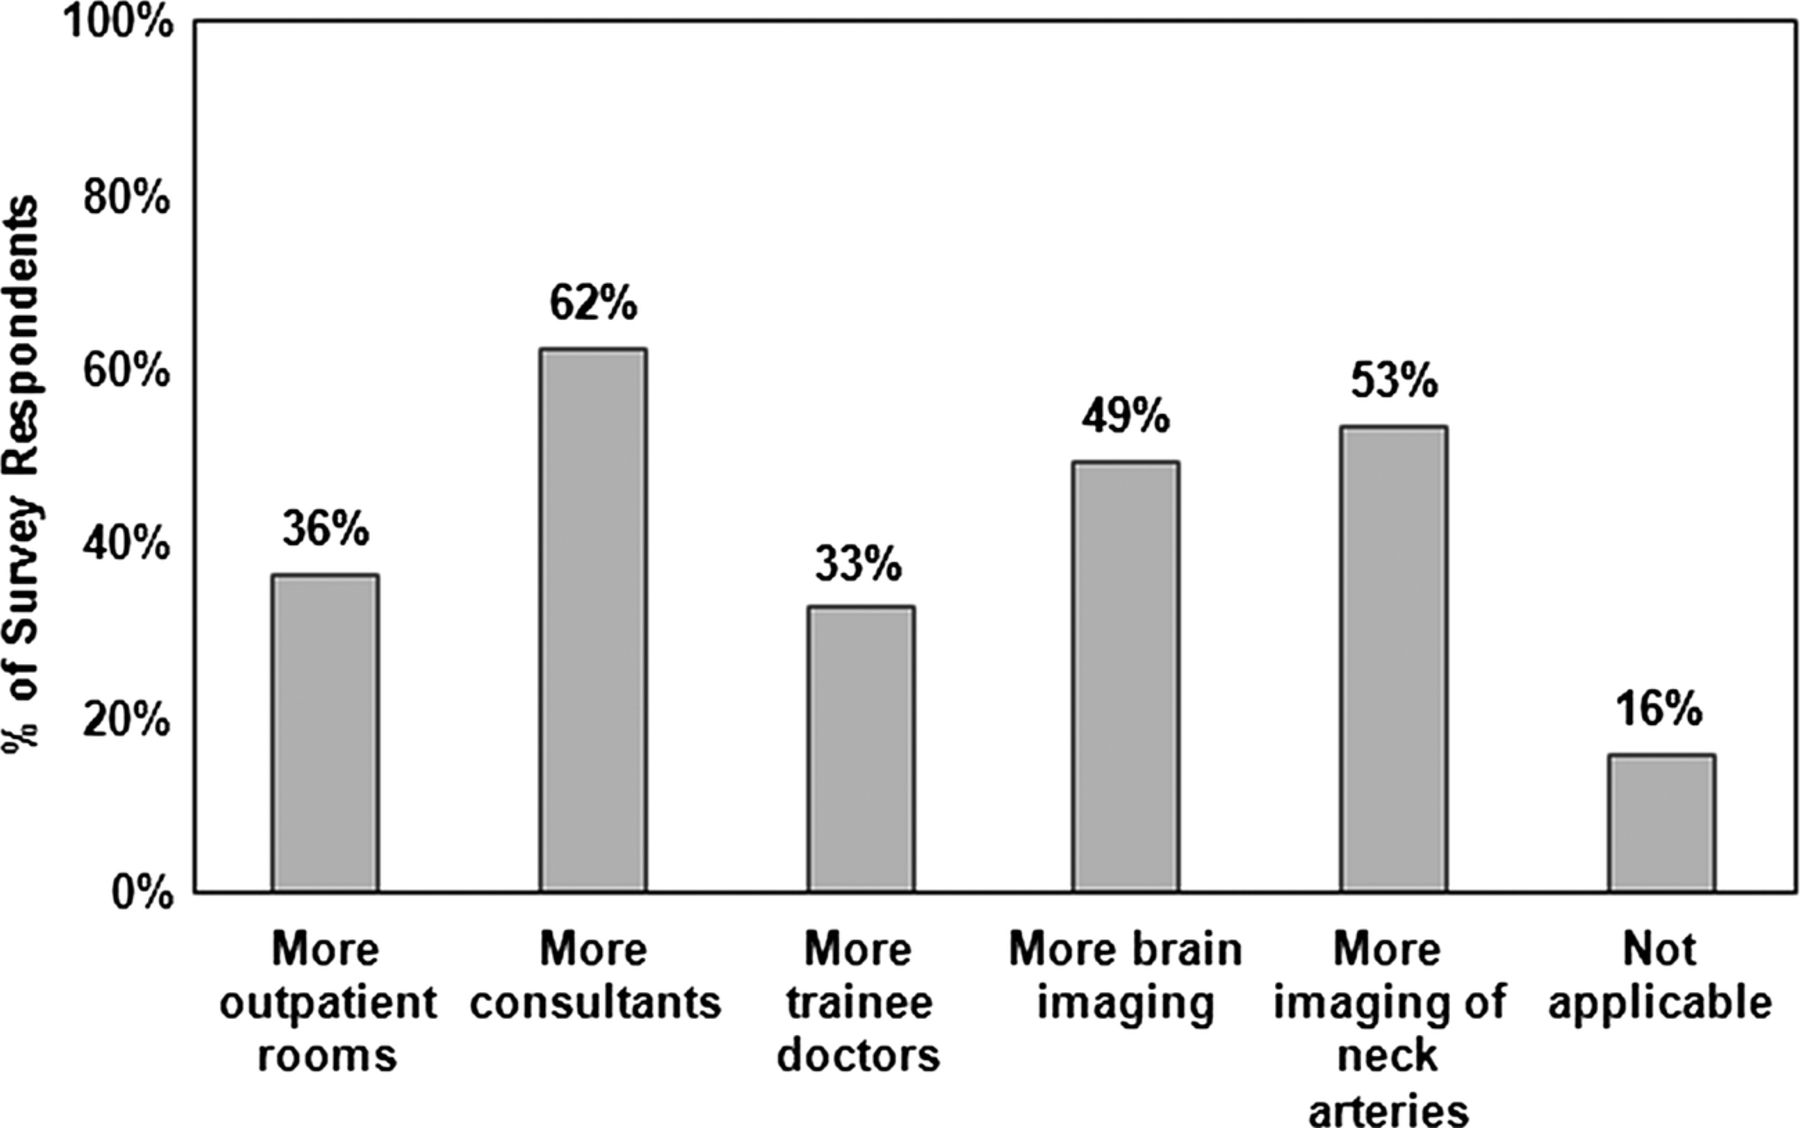
Forty-three per cent of the stroke-prevention centres indicated that they had spare capacity to see further patients. Responses varied as to what extra facilities were required to expand the current stroke service (figure 3), ‘more consultants’ being the most frequent, but ‘more carotid imaging’ was required in 53%. When ‘more brain imaging’ was chosen, all respondents opted for more MRI (38/38 respondents) rather than CT (14/38).
Resources needed to expand capacity in fully saturated stroke-prevention services. In total, 77/114 responded. Participants were asked to choose all suitable answers.
Discussion
These simultaneous surveys of stroke-prevention clinics and imaging services indicate that the necessary components of stroke-prevention services are widely available in the UK, but their structure and organisation vary considerably and an important proportion of practice remains suboptimal (box 1). In most centres (78%), specialist stroke-prevention services operate every weekday with an average of five new patients attending each clinic, yet only 60% of patients were seen within 1 week of their event. Additionally, over half the case-load are patients with a final diagnosis of a non-TIA/minor stroke ‘mimic’. Specialist medical knowledge is required for accurate diagnosis and appropriate medical management of this very heterogeneous case-mix, yet in a quarter of clinics, the main assessment is by nurses.
Key findings
-
Nurses provide the primary assessment and diagnosis in nearly a third of clinics.
-
A total of 50% of patients attending these clinics have transient ischaemic attack (TIA)/minor stroke mimic.
-
Most patients (75%) have already started secondary-prevention treatment before attending the clinic.
-
CT for TIA and minor stroke is widely available (94%) and is the first-line test in the vast majority of centres, and routinely used in 82%.
-
MR is available for TIA and minor stroke patients in 88% of centres but in about half of those it is after an initial CT scan.
-
There are long delays to MRI.
-
The key MR sequence needed to diagnose haemorrhage is omitted in more than half of the centres, reducing the value of MR.
-
Ultrasound is the primary carotid imaging test in 95% of centres.
-
There is limited capacity to undertake more imaging although about 40% of stroke services indicated that they had the capacity to see more patients; however, the main barrier to seeing more patients was the limited availability of MR.
The consistency between the clinical services’ responses and imaging departments’ responses to the question about first-line imaging method is striking (figure 2A,B). CT as well as MR is widely available, but access to CT is more rapid and more complete than for MR, particularly outside normal office hours and for outpatients (see online supplementary tables S2 and S3). MR was commonly performed in addition to and after CT—possibly somewhat inappropriately since the diagnostic yield from MR for ischaemic lesions on diffusion imaging declines rapidly with time after the event.15 The survey did not include a question on why MR was performed in addition to CT (or vice versa); therefore, we are not able to say why this practice was so common. Furthermore, in more than half the centres, the key MR sequence required to identify haemorrhage accurately (ie, GRE/T2* or equivalent) was omitted (see online supplementary figure S2),16 increasing the risk that haemorrhages would be misdiagnosed as ischaemic events17 (one of the two main reasons for brain imaging in TIA/minor stroke) leading to these patients receiving potentially inappropriate antithrombotic or anticoagulant treatment or even offered inappropriate carotid endarterectomy. Some centres that only use DWI and T2 are also likely to miss some stroke/TIA mimics that could otherwise be diagnosed with MR (the other of the two main reasons for brain imaging in TIA/minor stroke). Most patients had already been started on secondary prevention by their general practitioners before they reached the clinic (see online supplementary table S1), further questioning the value of MR performed in addition to CT, especially as the MR was frequently too late to be of great diagnostic utility.
The surveys confirmed that DUS is the main carotid imaging for TIA (95%) not MRA or CTA, perhaps reflecting that the potential for a ‘combined brain and carotid’ examination (eg, CT+CTA or MR+MRA) is not practical in most centres. In 59% of stroke services, endarterectomy was performed within 1 week of the decision to operate. The decreasing delay to surgery is encouraging and is in line with guidelines and recent audit reports,18 but the persistence of delays of up to a month in nearly 40% of patients remains a concern.
The surveys were targeted to clinical leads of stroke-prevention services and radiology departments. Response rate for both surveys was 45% which we considered satisfactory for such a survey in view of the large number of departments surveyed, the busy workload of service leads and their many administrative tasks. The response rates in three previous surveys about stroke services were higher, but these took place among much smaller catchment groups where many of the respondents knew the surveyors personally and were highly motivated about the topic of the survey.11–13 The present survey went to a substantially larger number of sites across the whole of the UK and inevitably could not achieve the same personal touch. The strengths include our use of several mechanisms to prevent sampling bias and increase response rate. We used multiple routes to access all stroke and imaging services clinical leads in the UK and web-based questionnaires for the ease of completion. We sent reminders to non-respondents. We reported our findings according to the standard methodology (ie, CHERRIES checklist). We provided web and paper surveys to assist respondents. We based these surveys on several previous surveys of stroke services that achieved high response rates.11–13
There were also limitations. The survey was anonymous and voluntary so we are not able to chart service distribution across the UK. We cannot exclude the possibility that some centres submitted two surveys. To protect the anonymity of the participants we also did not request full demographic details, so were unable to compare respondents with non-respondents. Our findings may, therefore, not apply to all stroke-prevention services. Although both internet surveys provided invaluable data to picture current clinical practice, some data were not routinely collected in all centres and respondents were only able to estimate some answers. Not all respondents answered all questions. Even though the 45% response rate for both surveys can be considered satisfactory, we cannot be sure to have captured the full range of performance with respect to current stroke service provision.
There are no other current nation-wide data on clinical services or imaging for stroke prevention in the UK or from other countries. MR usage for stroke is rising rapidly in many countries. For example, the use of MR rose by 235% in 10 states in the USA from 1999 to 2008,19 making diagnostic imaging the single fastest growing component of hospital costs rising by 213% from 1999 to 2008 in the USA.19 MR was used in addition to CT in about half of the patients, a similar pattern to that found in our survey. The use of several imaging tests will increase delays and further impede rapid access to imaging. The increase in use is occurring despite a lack of evidence in a recent systematic review that MR significantly changed management, or any randomised trials, case–control or cohort studies of imaging strategies to justify its increased use.20
We suggest that use of expensive resources in TIA/minor stroke, such as brain imaging, could be improved by ensuring that patients only have either CT or MR but not both. Where MR is used, then it should be used as fast as possible (beyond a few days after the TIA/minor stroke is unlikely to detect recent ischaemia and would be a waste of time for that purpose) and diagnostic sequences should include those appropriate to avoid misdiagnosing haemorrhage or TIA/minor stroke mimics; this is particularly critical if MR is used in patients whose presentation is delayed beyond 7 days when CT will not differentiate haemorrhage. Further consideration should be given to whether the widespread use of nurse triage is the most effective way of dealing with complex TIA/minor stroke mimics which generally require some considerable medical experience to differentiate from true TIA/minor stroke.
Acknowledgments
The authors would like to thank the following people for their assistance in circulating the questionnaires: Dr Damian Jenkinson, Stroke Advisor, Department of Health; Ian Golton, Barbara Zutshi, NHS Improvement Stroke Improvement Programme; Professor Tony Rudd and Ms Alex Hoffman, Royal College of Physicians London Sentinel Stroke Audit Office; the clinical leads of all 27 Stroke networks clinical leads in England; the Scottish Stroke Care Clinical Leads; NHS Improvement Database for Radiology Departments in England (Gail Powell); the MagNET Database; Professor Ian Robertson, Mr James Cannon, the Diagnostic Imaging Clinical Network, Scotland; the Scottish Radiological Society; all Scottish Regional Imaging Services Leads; Michelle Price, Stroke Collaborative, Wales; all imaging and clinical leads for stroke services in Wales.
References
Supplementary materials
Supplementary Data
This web only file has been produced by the BMJ Publishing Group from an electronic file supplied by the author(s) and has not been edited for content.
Files in this Data Supplement:
- Data supplement 1 - Online supplement
Footnotes
-
Contributors JMW, MD and PS conceived the idea for the study and secured funding; MB, ZQ and JMW drafted the survey; DH, KM, PMcN, JDeW, MD and PS tested and edited the survey; MB and KS set up the final version of the survey into the survey software; MD, JMW, MB and JDeW disseminated the survey as widely as possible; KS and MB downloaded the responses, collated and analysed the results; all authors interpreted the results; MB and JMW drafted the paper; all authors contributed to critical comments and edited the manuscript; all authors gave their final approval for the submission of the manuscript; JMW was the principal investigator and takes full responsibility for the integrity and accuracy of the work. Thus, all authors fulfil all three ICMJE criteria for authorship: (1) substantial contributions to conception and design, acquisition of data or analysis and interpretation of data; (2) drafting the article or revising it critically for important intellectual content and (3) final approval of the version to be published.
-
Funding The work was funded by the UK National Institutes of Health Research Health Technology Assessment Programme (09/22/169). The SINAPSE Collaboration is funded by the Scottish Funding Council. The Brain Research Imaging Centre is supported by NHS Lothian Research and Development Office.
-
Competing interests The authors acknowledge funding for the study from the UK National Institutes of Health Research Health Technology Assessment Programme (salary for MB and ZQ). JMW and KM were supported by the SINAPSE Collaboration. All authors had full unrestricted access to all the study data. The views are those of the authors and not those of the funding agency. There are no other competing interests. JMW takes responsibility for the integrity of the data and the accuracy of the data analysis.
-
Provenance and peer review Not commissioned; externally peer reviewed.
-
Data sharing statement Individual and summary responses for both surveys can be accessed via the Dryad data repository at http://datadryad.org/ with the doi:10.5061/dryad.3nc25.