Article Text

Abstract
Objective To describe the accuracy of ethnicity coding in contemporary National Health Service (NHS) hospital records compared with the ‘gold standard’ of self-reported ethnicity.
Design Secondary analysis of data from a cross-sectional survey (2011).
Setting All NHS hospitals in England providing cancer treatment.
Participants 58 721 patients with cancer for whom ethnicity information (Office for National Statistics 2001 16-group classification) was available from self-reports (considered to represent the ‘gold standard’) and their hospital record.
Methods We calculated the sensitivity and positive predictive value (PPV) of hospital record ethnicity. Further, we used a logistic regression model to explore independent predictors of discordance between recorded and self-reported ethnicity.
Results Overall, 4.9% (4.7–5.1%) of people had their self-reported ethnic group incorrectly recorded in their hospital records. Recorded White British ethnicity had high sensitivity (97.8% (97.7–98.0%)) and PPV (98.1% (98.0–98.2%)) for self-reported White British ethnicity. Recorded ethnicity information for the 15 other ethnic groups was substantially less accurate with 41.2% (39.7–42.7%) incorrect. Recorded ‘Mixed’ ethnicity had low sensitivity (12–31%) and PPVs (12–42%). Recorded ‘Indian’, ‘Chinese’, ‘Black-Caribbean’ and ‘Black African’ ethnic groups had intermediate levels of sensitivity (65–80%) and PPV (80–89%, respectively). In multivariable analysis, belonging to an ethnic minority group was the only independent predictor of discordant ethnicity information. There was strong evidence that the degree of discordance of ethnicity information varied substantially between different hospitals (p<0.0001).
Discussion Current levels of accuracy of ethnicity information in NHS hospital records support valid profiling of White/non-White ethnic differences. However, profiling of ethnic differences in process or outcome measures for specific minority groups may contain a substantial and variable degree of misclassification error. These considerations should be taken into account when interpreting ethnic variation audits based on routine data and inform initiatives aimed at improving the accuracy of ethnicity information in hospital records.
- Ethnicity
- Hospital Records
- Equality
This is an open-access article distributed under the terms of the Creative Commons Attribution Non-commercial License, which permits use, distribution, and reproduction in any medium, provided the original work is properly cited, the use is non commercial and is otherwise in compliance with the license. See: http://creativecommons.org/licenses/by-nc/3.0/ and http://creativecommons.org/licenses/by-nc/3.0/legalcode
Statistics from Altmetric.com
Article summary
Article focus
-
Accurate recording of ethnicity in administrative health data is a pre-requisite for efforts to ensure equality or reduce inequalities in healthcare.
-
This paper describes the accuracy of ethnicity coding in English National Health Service hospital records compared with the ‘gold standard’ of self-reported ethnicity, and identifies areas where improvement is needed.
Key messages
-
Hospital records will usually code the ethnicity of patients with self-reported White British ethnic group correctly, but the levels of incorrect coding of the ethnicity of all ethnic minority groups are high.
-
Belonging to an ethnic minority group is the only independent predictor of having an incorrectly coded hospital record ethnicity; there is substantial variation in the quality of coding between hospitals.
-
The probability look-up tables provided in this paper can be used for weighting of incidence or prevalence estimates where hospital record ethnicity is being used, or in regression analysis to improve estimation of ethnic variation in processes or outcomes of care.
Strengths and limitations of this study
-
This was a unique opportunity to carry out an audit of the accuracy of hospital record coding of ethnicity in England, using data from a large national survey of recently treated patients.
-
We were not able to account for the different processes by which ethnicity was ascertained in hospital records and the study population was skewed towards older ages, which may limit the generalisability of the findings.
Background
Modern healthcare systems aspire to equal access and quality of care for patients of any ethnic group.1 ,2 In England, there are nevertheless well-documented ethnic inequalities in the processes and experiences of care.3 ,4 Good practice in measuring these inequalities is needed.5 Therefore, the availability of complete and valid information on patients’ ethnicity in routine National Health Service (NHS) data is a fundamental first step to enable equality audits to inform improvement actions. Further, there are variations in the incidence and prevalence of some conditions between different patient ethnic groups. Understanding such variations can be vital for service planning and required capacity estimates. NHS hospitals began to routinely record ethnicity information in their Patient Administration System (PAS) records in the mid-1990s.6 (PAS records are a precursor to Hospital Episode Statistics (HES) data—hereafter, we refer to hospital records as ‘HES records’ for simplicity, as this is the more commonly used convention to denote patient administrative data in the NHS.) Although implementation of this measure has been slow,7 HES data in recent years have high completeness of ethnic group information (typically exceeding 90%).6 ,8 There is, however, little evidence about the accuracy of routinely recorded information on patients’ ethnicity. In the past, audits of the quality of ethnicity information in NHS records have principally focused on data completeness, rather than accuracy,6 and completeness of ethnicity coding information currently forms part of the Commissioning Outcomes Data Set,6 a prescribed standard for data quality that is linked to hospital reimbursement.
Ethnicity can be classified by referring to a community of people who share the same culture and/or by referring to an ancestral population which comprises their self-identity.9 Self-reported ethnicity captures both the shared experiences/culture of an individual and their self-identity. Methods such as surname recognition algorithms or geocoding (or combinations of both these approaches) have been developed to indirectly infer the ethnicity of individuals,10–15 but both have limitations that do not apply to self-reported ethnicity. For example, geocoding methods rely on high levels of geographical (residential) segregation between different ethnic groups. Surname recognition methods rely on low levels of interethnic marriages and the existence of distinctive surname nomenclatures (which do not always exist for some ethnic groups, eg, Black populations in the USA). Further, by definition, indirect methods will misclassify the ethnicity of some patients and disproportionately do so for the ethnicity of people from ethnic minorities. For all the above reasons, self-report is currently considered the gold standard measure of ethnicity.16 ,17
Patient surveys, when linked to routine ethnicity data, provide opportunities to determine the accuracy of ethnic group information contained in routine health system records. As this linkage is rarely performed, few studies have cross-examined the accuracy of ethnic group information included in routine healthcare records against self-reported ethnicity information. Those that have examined this have been conducted in the USA.18–20
Against this background and using data from an English national patient survey, we aimed to examine the overall accuracy of recorded versus self-reported ethnicity; and whether discordance between recorded and self-reported ethnicity information varied between patients of different ethnic groups.
Methods
Data
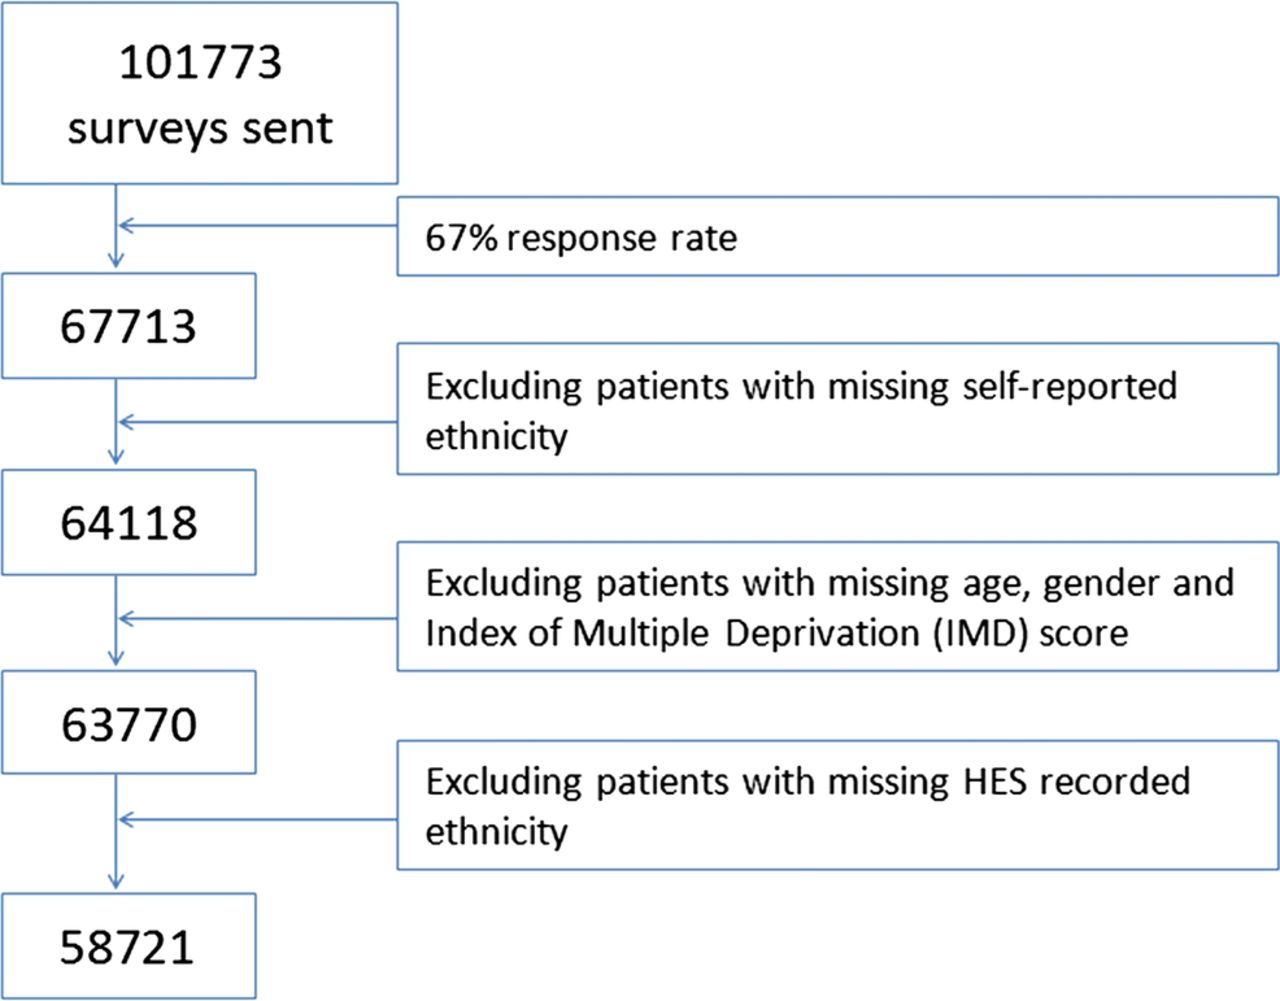
We used publicly available anonymous data from the 2010 Cancer Patient Experience Survey in England.21 An unusual feature of this survey is that hospital-recorded ethnicity was collected when compiling the sample and linked to patient responses by the survey provider. All patients treated for cancer in an English NHS hospital during the first quarter of 2010 were invited to participate in the survey, with a response rate of 67%.21 Of 67 713 respondents, 64 418 (94.7%) provided valid self-reported ethnicity information. As self-reported ethnicity was used as the gold standard against which the accuracy of HES-recorded ethnicity was compared, data on respondents with missing self-reported ethnicity were excluded from further analysis (see figure 1). Data on an additional 348 respondents with missing information on deprivation status were also excluded from further analysis, leaving 63 770 respondents. An additional 5049 records with missing HES-recorded ethnicity were excluded, leaving 58 721 records for analysis. For all respondents included in our analyses, completely observed data were available for patients’ HES-recorded age, gender and socioeconomic status (using the Index of Multiple Deprivation score of lower super output area of residence). In both HES-records and patient reports, ethnicity was classified using the same 16-group categorisation (Office of National Statistics (ONS16) 2001; see online supplementary appendix 1).

Survey responders and exclusions.
Analysis
We first described the overall degree of discordance between HES-recorded and self-reported information on ethnicity using the Cohen's κ statistic. We further calculated the sensitivity and the positive predictive value (PPV) of HES-recorded ethnicity in respect of self-reported ethnicity. In this context, sensitivity denotes the proportion of patients with a given self-reported ethnicity with concordant ethnicity information in their HES record; and PPV denotes the probability that a patient with a particular HES-recorded ethnic group will self-report the same ethnic group.
Subsequently, we explored independent predictors of discordant ethnicity information by constructing a multivariable logistic regression model with concordant/discordant ethnicity status as the binary outcome variable and self-reported ethnicity as a covariate. Adjustment was also made for other patient sociodemographic characteristics (age in 10-year age groups, gender and postcode-linked area-based deprivation). For age and gender, we used HES-recorded information because the completeness of these variables among survey respondents was higher than self-reported age and gender, and as the degree of concordance between HES-recorded and self-reported age (based on year of birth) and gender were very high (>99.5% for both).
To explore whether clustering of patients in some groups in hospitals with higher or lower discordance levels could in part explain the findings, we subsequently repeated the regression model described above including a random effect for hospital—in addition, this model allows us to explore the degree of variation in the level of ethnicity information discordance between different hospitals. As less detailed classifications of ethnicity are often used in health research, we also carried out supplementary analysis looking at discordance when using six (as opposed to 16) ethnic groups (ie, White, Mixed, Asian or Asian British, Black or Black British, Chinese and other).
Lastly, we constructed a probability ‘look-up’ table indicating the probability that HES-recorded ethnicity represents true (self-reported) ethnicity for each of the 16 different ethnic groups. These probabilities can be used for weighting of incidence or prevalence estimates or used in regression analysis to improve estimation of ethnic variation in processes or outcomes of care.14 ,22 For the calculation of the probability ‘look-up’ table only, we combined data from two surveys (2010 and 2011/2012) to improve the precision of the probabilities presented (increasing our sample size to 133 204). STATA V.11 was used for all analyses.
Results
Overall, the frequency of discordance of HES-recorded and self-reported ethnicity information was 4.9% (4.7–5.1%). Patients who identified themselves as White British had the lowest frequency of discordant ethnicity information in their HES records (2.2% (2.0–2.3%)). In contrast, patients who identified themselves as belonging to any other ethnic group had a substantially higher frequency of discordant HES-recorded ethnicity (41.2% (39.7–42.7%)). Cohen's κ for HES-recorded and self-reported ethnicity was 0.64 overall and 0.54 if White British patients were excluded. The frequency of discordance was particularly high for patients who self-reported that they belonged to the Any Other Black Background (90.0% (55.5–99.7%)) and the Any Other Mixed Background (87.8% (78.2–97.3%)) groups (table 1).
Crude and adjusted predictors of discordant hospital record ethnicity coding
HES-recorded ‘White British’ ethnicity had a high sensitivity of 97.8 (97.7–98.0) and PPV of 98.1 (98.0–98.2) for self-reported White British ethnicity (figure 2, estimates and CIs in online supplementary appendix table 2 for the 6 and 16 group classification). In contrast, HES-recorded ‘Mixed’ ethnicity had very low sensitivities (12–31%) and PPVs (12–42%). HES-recorded ‘Indian’, ‘Pakistani’, ‘Bangladeshi’, ‘Chinese’, ‘Black-Caribbean’ and ‘Black African’ ethnicity had intermediate levels of sensitivity (65–80%) and PPV (80–89%), respectively. HES-recorded ‘White Irish’ ethnicity had low sensitivity (47.8% (44.5–51.0%)) but high PPV (81.5% (77.9–84.6%)). This means that of all individuals who self-identify themselves as White Irish, only 48% would have their ethnic group recorded as such in their HES records; however, among patients whose HES records indicate that they are ‘White Irish’, 82% would identify themselves as belonging to this group too.

Sensitivity* and positive predictive value** of hospital record-recorded ethnicity compared with self-reported ethnicity as a gold standard. *If a patient self-reports that they belong to a particular ethnic group, then the sensitivity of the hospital record ethnicity coding is the probability that the hospital record will record the same (correct) ethnicity. **If a patient's hospital record states that they belong to a particular ethnic group, then the positive predictive value of the hospital record ethnicity code is the probability that this code has been recorded correctly and that the patient will self-report the same ethnicity.
While there was some evidence that age, gender and deprivation are crudely associated with discordance of ethnicity information, in multivariable logistic regression analysis, adjusting for other patient characteristics, the sole independent predictor of discordance was self-reported ethnicity (table 1). Repeating this model with a random effect for hospital produced only trivial differences to associations of discordance with patient characteristics. This means that the association between discordance and self-reported ethnic minority group cannot be explained by ethnic minority patients attending hospitals that have poor levels of accuracy of ethnicity information overall. There was, however, strong evidence (p<0.0001) of variation in discordance between different hospitals (accuracy of coding of ethnicity across hospitals ranged from 67% to 100%). Specifically, if all hospitals were to be arranged in order of frequency of discordance of ethnicity information, and after accounting for differences in the proportion of ethnic minority patients attending the hospital, the OR of discordance between the hospital in the 97.5th and 2.5th centiles (the 95% reference range) will be about 13, indicating a 13-fold difference in the odds of discordance across hospitals. After accounting for differences in the proportion of ethnic minority patients attending each hospital, the hospital at the bottom 2.5th centile of coding accuracy had concordant self-reported and hospital record-recorded ethnicity codes in 90% of records.
Similar findings to those observed in the main analysis were observed when using a six-group classification (table 2). The total numbers of respondents with discordant ethnicity decreased when using a six-group classification to 796 participants (1.4%) from 2878 (4.9%), indicating that much of the discordance was within the cruder six-group classification. However, self-reporting a non-White ethnic background remained as strongly associated with having an incorrectly coded hospital-record ethnic group as for the 16-group classification. Details of the ethnic groups to which people from each self-reported ethnic background were misclassified are given in table 3, showing the variation between and within the 6-group and 16-group coding.
Crude and adjusted predictors of discordant hospital record ethnicity coding (ONS 6-group classification)
The probability (%) of ‘true’ ethnic group for each hospital record-recorded ethnic group (ie, the probability that a given person with a specific HES-recorded ethnicity belongs to any (self-reported) group
People who self-report mixed ethnic backgrounds are particularly likely to have an incorrectly coded ethnic group in their hospital records, with high numbers using both the 16 (79.9%) and 6 (74.9%) group classifications. Looking at table 3, we see that the self-reported ethnicity falls into one of three groups—the concordant mixed category, white (either British or Other white) or the corresponding ethnic minority category—over 90% of the time, explaining why for this group the broader six-category classification does not improve the accuracy of hospital record ethnicity coding.
Finally, the probability table (table 3) can be used in estimating ethnic group variations in incidence, prevalence or measures care quality when using HES data. Examples of such applications in the context of US health research have been reported previously.14 ,22
Discussion
Using data from a recent national survey of hospital patients with cancer, we explored the accuracy of ethnicity information in HES data. Overall, we found that the level of discordance of ethnicity information between HES records and patient self-reports is low, particularly for the majority White British patients. There is, however, a substantial degree of inaccuracy in the recorded ethnicity of patients who self-report themselves as belonging to ethnic minority groups. For many major ethnic groups (‘Indian’, ‘Pakistani’, ‘Bangladeshi’, ‘Chinese’, ‘Black-Caribbean’ and ‘Black African’), routine hospital data will miscode between 20% and 35% of all patients who self-report that they belong to these ethnic groups (sensitivity 65–80%). Further, up to 20% of patients recorded as belonging to some major ethnic groups will self-report that they actually belong to other ethnic groups (PPV 80–89%, respectively). For patients who self-report being of mixed ethnic groups, HES records are usually discordant. We provide probability tables that can be used in re-estimating ethnic group variations when investigating ethnic variation in processes or quality of care from the UK hospital records in order to improve the precision of such estimates.
The study explored a unique opportunity provided by patient survey data to explore the accuracy of ethnicity information in the UK-routine healthcare data. Previous evidence on the accuracy of ethnicity information in administrative datasets relates to US settings.18–20 Our findings concord with previous US literature which also indicates that the accuracy of ethnicity information tends to be highest for the majority white population, lower for major ethnic minority groups (like African American or Hispanic) and lowest for smaller ethnic groups (such as American Indian/Alaskan Natives) and Mixed or Other racial/ethnic groups.18 ,19 Other strengths of the study include its large sample size, enabling the profiling of discordance for small ethnic groups; and the use of regression analyses to explore independent predictors of discordance and to examine variation between different hospitals.
A limitation is that the study population included patients who attended hospital for cancer treatment (most of whom are aged 65 years of age or older). Therefore, in principle, the generalisability of the findings (particularly regarding younger patients) might be limited; equally, the need for accurate recording of ethnicity among cancer patients has been identified.23 We were also unable to explore potential inaccuracies in ethnicity categorisation resulting from longitudinal person-level discordance among patients with more than one hospital care episode. Previous research indicates that up to 3% of patients with more than one episode of care have longitudinally discordant ethnic group information.24 Evolving sociocultural trends or changes in Census methodology (such as the introduction of Mixed ethnic groups to the UK census in 2001) could contribute to changes in a person's self-identified ethnic group over their lifetime. Lastly, we were not able to account for the process by which ethnicity was ascertained in hospital records. It is quite likely that this process involves a combination of self-reports, reports by relatives or carers (eg, in the case of infirm patients, or patients with language or other communication difficulties) or even guesswork by hospital staff (eg, when there are language barriers, or in clinical emergencies).16
The 2001 Census has expanded the previous ONS classification of ethnicity (originally containing 10 groups) to the 16-group classification also used in this survey,2 a change which was subsequently reflected into HES coding. The impact of this secular change may explain some of the discordance observed. For example, the discordance in self-reported Irish White ethnicity may reflect the fact that this ethnic group was only included in the 2001 classification. The 2011 Census included two new ethnic groups; ‘Gypsy or Irish Traveller’ and ‘Arab’.25 It remains to be seen if this change will be reflected into the routinely collected health data.
While this study considers the accuracy of recorded ethnicity, there are issues with defining ethnicity using any simple classification; for example, the potential for ‘concealed heterogeneity’ within each of the ethnic groups.16 It is possible, for example, that within the Indian ethnic group there are certain social, linguistic or religious subgroups which are more or less likely to have a discordant ethnicity. Indeed, evidence indicates that ethnic minority patients with discordant ethnicity information may be systematically different from other patients from the same ethnic group with concordant ethnicity.20 Within-ethnic group heterogeneity is a complex issue inherent in any type of ethnicity research, and the nature of our study did not allow us to address this.
Another issue that we have not addressed in this paper is the completeness of ethnicity information, which has the potential to bias estimates of ethnic variation in addition to the misclassification detailed here. We performed similar analysis to those discussed here for predictors of missing ethnicity (not shown). We found only small variations by self-reported ethnic group but a much larger degree of variation between hospitals than that seen for discordance, implying that the issues with missing ethnicity are primarily driven by hospital-level processes.
Our findings have implications for policy and future research. First, although HES data currently have a high level of completeness of ethnic information, if the aim of any audit is to compare outcomes between White and non-White groups, the current classification system will perform well, but a degree of caution is required when interpreting more detailed evidence on ethnic inequalities in care quality or disease incidence and prevalence that is based solely on HES data, particularly for minority ethnic groups found to have higher discordance rates. Misclassification of ethnicity in HES data could result in either an underestimation of ethnic variation or an inability to detect such variation when it exists (‘type 1’ error).
Second, we provide a list of probabilities that can be used to improve estimates of ethnic variation in healthcare in a UK setting.14 ,22 These probabilities can be used both to improve the precision of prevalence estimates and in statistical models where hospital record ethnic group is a predictor.14
Third, as the completeness of ethnicity information in hospital records is currently high, more attention needs to be given to the accuracy of recorded information. The substantial variation between hospitals in the accuracy of ethnicity information indicates that there is great potential for improving the quality of ethnicity information in poorly performing hospitals. Improvement in the quality of HES data (which is generally desirable26) should also encompass improvements in the quality of ethnicity coding. Qualitative studies have found a willingness among ethnic minority groups to provide this information,27 and future research should explore optimal ways for efficiently obtaining current self-reported information on ethnicity in patient records.
Acknowledgments
We thank the UK Data Archive for access to the anonymous survey data (UKDA study number: 69488), the Department of Health as the depositor and principal investigator of the Cancer Patient Experience Survey 2010, Quality Health as the data collector; and all NHS Acute Trusts in England for provision of data samples.
References
Supplementary materials
Supplementary Data
This web only file has been produced by the BMJ Publishing Group from an electronic file supplied by the author(s) and has not been edited for content.
Files in this Data Supplement:
- Data supplement 1 - Online appendix
Footnotes
-
Contributors All authors had substantial input into the study concept, design, analysis and access to the data. GL had the original idea for the study, which was further conceptualised in discussions between all authors; methods were principally developed by CLS and further amplified by GAA. All authors communicated frequently during the course of the project, including through face-to-face meetings. CLS and GL wrote the first draft, which was edited by all authors over multiple versions. All authors saw and approved the final manuscript.
-
Funding The paper is independent research arising from a Post-Doctoral Fellowship award to GL supported by the National Institute for Health Research (PDF-2011-04-047). AET is funded by an Academic Clinical Fellowship award from the National Institute for Health Research. The views expressed in this publication are those of the authors and not necessarily those of the NHS, the National Institute for Health Research or the Department of Health.
-
Competing interests None.
-
Provenance and peer review Not commissioned; externally peer reviewed.
-
Data sharing statement No additional data are available.