Article Text

Abstract
Objective Numerous ultrasound studies have suggested that a typical enlarged area of echogenicity in the substantia nigra (SN+) can help diagnose idiopathic Parkinson's disease (IPD). Almost all these studies were retrospective and involved patients with well-established diagnoses and long-disease duration. In this study the diagnostic accuracy of transcranial sonography (TCS) of the substantia nigra in the patient with an undiagnosed parkinsonian syndrome of recent onset has been evaluated.
Design Prospective cohort study for diagnostic accuracy.
Setting Neurology outpatient clinics of two teaching hospitals in the Netherlands.
Patients 196 consecutive patients, who were referred to two neurology outpatient clinics for analysis of clinically unclear parkinsonism. Within 2 weeks of inclusion all patients also underwent a TCS and a 123I-ioflupane Single Photon Emission CT (FP-CIT SPECT) scan of the brain (n=176).
Outcome measures After 2 years, patients were re-examined by two movement disorder specialist neurologists for a final clinical diagnosis, that served as a surrogate gold standard for our study.
Results Temporal acoustic windows were insufficient in 45 of 241 patients (18.67%). The final clinical diagnosis was IPD in 102 (52.0%) patients. Twenty-four (12.3%) patients were diagnosed with atypical parkinsonisms (APS) of which 8 (4.0%) multisystem atrophy (MSA), 6 (3.1%) progressive supranuclear palsy (PSP), 6 (3.1%) Lewy body dementia and 4 (2%) corticobasal degeneration. Twenty-one (10.7%) patients had a diagnosis of vascular parkinsonism, 20 (10.2%) essential tremor, 7 (3.6%) drug-induced parkinsonism and 22 (11.2%) patients had no parkinsonism but an alternative diagnosis. The sensitivity of a SN+ for the diagnosis IPD was 0.40 (CI 0.30 to 0.50) and the specificity 0.61 (CI 0.52 to 0.70). Hereby the positive predictive value (PPV) was 0.53 and the negative predictive value (NPV) 0.48. The sensitivity and specificity of FP-CIT SPECT scans for diagnosing IPD was 0.88 (CI 0.1 to 0.95) and 0.68 (CI 0.58 to 0.76) with a PPV of 0.75 and an NPV of 0.84.
Conclusions The diagnostic accuracy of TCS in early stage Parkinson's disease is not sufficient for routine clinical use.
Clinicaltrials.gov identifier NCT0036819
This is an open-access article distributed under the terms of the Creative Commons Attribution Non-commercial License, which permits use, distribution, and reproduction in any medium, provided the original work is properly cited, the use is non commercial and is otherwise in compliance with the license. See: http://creativecommons.org/licenses/by-nc/3.0/ and http://creativecommons.org/licenses/by-nc/3.0/legalcode
Statistics from Altmetric.com
Article summary
Article focus
-
We wanted to assess the diagnostic accuracy of transcranial sonography (TCS) of the substantia nigra in patients with an undiagnosed parkinsonian syndrome of recent onset.
-
A large body of evidence suggests that TCS of the substantia nigra can help diagnose idiopathic Parkinson's disease (IPD). The problem is that almost all these studies were retrospective and involved patients with well-established diagnoses and long disease duration.
Key message
-
The diagnostic accuracy of TCS in early stage Parkinson's disease is not sufficient for routine clinical use.
Strengths and limitations of this study
-
Strength of our study is its guaranteed prospective nature: we registered this study prospectively and we carried it out exactly as proposed in the published protocol. It is the largest prospective study on this technique in this patient population up till now. At inclusion we excluded the patients with already a clear diagnosis, thus closely mimicking the clinical situation in which the neurologist would need an additional tool for diagnostic workup.
-
A limitation, as in all these studies, is the lack of an objective gold standard, that is, neuropathological analysis. We used clinical diagnosis after 2 years follow-up as gold standard. Longer follow-up periods will probably increase diagnostic accuracy, but will also lead to higher attrition rates in these elderly populations.
Introduction
In clinical practice the diagnosis of idiopathic Parkinson's disease (IPD), delineating it from the atypical parkinsonisms (APS), vascular parkinsonism (VP), drug-induced parkinsonism (DIP) and essential tremor (ET) is still difficult.1–8 Especially in the early stage of these diseases a large group of patients is erroneously diagnosed, even by experienced movement disorder specialists, when one uses postmortem findings as a gold standard.9–13 Longer term follow-up studies with clinical criteria as a gold standard found that IPD was initially frequently overdiagnosed.14 ,15 As these disorders have varying prognoses, a multitude of ancillary investigations has been proposed as aids in the early diagnosis of IPD.16–20 Of all these, 123I-ioflupane Single Photon Emission CT (FP-CIT SPECT) scans are most widely used in routine clinical practice to diagnose IPD. But a substantial fraction of patients with early IPD have normal scans, and the costs and use of intravenous radioactive tracers are seen as important disadvantages of this technique.19
The search for a cheaper and more patient-friendly technique to diagnose IPD has thus continued and over the last 10 years transcranial sonography (TCS) of the substantia nigra (SN) has emerged as a promising tool in this regard. Numerous ultrasound studies have found that a significant percentage of patients with IPD have a typical enlarged area of echogenicity in the substantia nigra (SN+), which is thought to be associated with increased iron concentrations.21–38 Some of these studies have suggested that with this echofeature one can diagnose IPD with reasonable sensitivity and specificity. Further research along these lines found that TCS might also be used to delineate IPD from the APS,39–44 such as Multiple System Atrophy and Progressive Supranuclear Palsy. These patients appear to have normal or only a moderately enhanced-hyperechogenic SN as have patients with VP,45 ET46–48 and DIP. Patients with Lewy Body dementia (LBD)49 and Cortical Basal Degeneration (CBD)50 have been reported to share the same echofeature with IPD patients, and researchers have found that the accuracy of the differential diagnosis can be enhanced by additional assessments of the echogenicity of the basal ganglia. Hyperechogenicity of the lentiform nucleus is commonly seen in patients with CBD, whereas patients with IPD have this echofeature only rarely. Furthermore, research showed that the absence of bilateral marked SN+ discriminated IPD from LBD with a moderate-to-good sensitivity, and a good specificity and positive predictive value (PPV).49 All these different findings combined could then give a ‘diagnostic fingerprint’ for these disorders by following an algorithm we recently postulated.51
However, almost all studies were retrospective and involved patients with well-established diagnoses and long disease duration. These findings thus cannot simply be extrapolated to the clinical situation for which one would need the TCS, namely the patient with a recent-onset of parkinsonian syndrome that cannot be diagnosed clinically at the first visit. Up till now only one prospective study has assessed the diagnostic accuracy in patients with recent onset of parkinsonian signs and symptoms.30 This study was relatively small, excluded patients with tremor, and followed up patients for only 12 months.
Methods
Patients
This was a prospective study testing the diagnostic accuracy of TCS of the SN in patients who were referred by their general practitioner (GP) for a first consultation by a neurologist because of recent-onset of parkinsonism of unclear origin.52 The Institutional Review Board (IRB) of the University Hospital Maastricht approved the study (MEC 05–228, 4 April 2006), and the study was registered prospectively under (ITRSCC) NCT0036819. The study protocol was published before the study started.52
We considered 283 consecutive patients, who were referred to two neurology outpatient clinics for analysis of clinically unclear parkinsonism (Neurology Outpatient Clinic of the Maastricht University Medical Centre (MUMC) in Maastricht and the Orbis Medical centre in Sittard, The Netherlands). Patients, in whom a definite diagnosis could be made at the first visit, were excluded from the study (n=42). Hence, we enrolled 241 patients. After signing informed consent, upon entering the study, all subjects underwent a structured interview and a neurological examination (see additional file 152). These tests were performed by a physician not treating the patient and blinded for information in the routine clinical records.52
Within 2 weeks of inclusion all patients underwent a TCS of the SN, at the department of neurophysiology of the two mentioned hospitals. In each hospital TCS was carried out by a specially trained investigator (P Wuisman MD in Orbis Medical Centre, Sittard, and Prof W Mess (WHM) in the MUMC). WHM is a very experienced sonographer, who did additional training with Professor D Berg one of the pioneers of this technique.53 To ensure validity of the TCS assessments among our two sonographers we had already carried out an interobserver study, and found an acceptable interobserver agreement with κ values in the 0.7–0.8 range.54
Patients in whom a TCS of the SN was not possible because of a non-accessible bone window were excluded from the study resulting eventually in a group of 196 patients. Within 2 weeks of inclusion all patients also underwent a FP-CIT SPECT scan of the brain as described in our protocol.52
After 2 years, patients were re-examined by two movement disorder specialist neurologists for a final clinical diagnosis that served as a surrogate gold standard for our study. The four consultant neurologists who alternately did these assessments were all specialists in movement disorders with more than 10 years of experience in this field (Bert Anten MD PhD, Fred Vreeling MD PhD, Wim Weber MD PhD and Ania Winogrodzka MD PhD). These investigators were blinded for all test results of these patients. In the planning of these visits we had ensured that neither of the two neurologists had ever seen the patient. They were asked to interview and examine the patient, as they would normally do during a routine neurological consultation. They were asked to fill out the same standard form as had been performed by the including investigator during the first visit of the patient (see additional file 1). Among other items this form contained the Unified Parkinson's Disease Rating Scale (UPDRS)-III score,55 and subsequently the neurologists received the scores of the patient at the first visit, so that they could evaluate whether the patient had had any progression on that scale. They also received the results of the brain scan, preferably an MRI of the cerebrum, however, when MRI was not possible because of claustrophobia or devices not allowed in the MRI, a CT of the brain. Each neurologist was asked then to reach a final clinical diagnosis of the parkinsonian syndrome using the diagnostic clinical criteria for IPD and APS.9 ,56–59 One investigator compared these scores and when there was no agreement, the two neurologists were asked to discuss these patients using their notes, in an effort to reach agreement on the final diagnosis. In all cases except five patients, this discussion resulted in agreement on the final neurological diagnosis. Concerning the five patients to discussion, the diagnosis made at regular controls on the outpatient clinic of neurology was taken as a third opinion and a final diagnosis was made.
Transcranial sonography
One investigator per hospital and blinded to clinical information, performed the ultrasound imaging (sonography) with a SONOS 5500 (Philips, Eindhoven, the Netherlands). The examination was performed in a dark room with the patient already on the examination table before the investigator entered the room. This was carried out to minimise the possible identification of a patient's clinical signs. Patient and investigator were asked not to discuss the medical information.
TCS investigation was performed bilaterally through the preauricular bone window with a 2–4 MHz phased array transducer. The quality of the bone window was scored as good, moderate or inferior. Two different methods were applied for the evaluation of the SN. First, the presence or absence of an obviously visible SN was scored (qualitative method). Second, the area of possible signal intensity was manually encircled and automatically calculated (quantitative method). This was only performed when the increase of the hyperechogenicity was located in the anatomical distribution of the SN meaning showing a typically stripe-shaped configuration. Both the right and left SN were measured from both sides.
FP-CIT SPECT
The SPECT scanning was carried out within 2 weeks of inclusion in the study. In this study FP-CIT (123I-ioflupane, Nycomed, Amersham, UK) was used as presynaptic radiotracer. Medication (amphetamine, citalopram, fentanyl, fluoxetine, fluvoxamine, paroxetine, sertraline, venlafaxine) which could interfere with the radiotracer had been discontinued at least five half life times. After intravenous injection of the tracer, SPECT measured baseline dopamine transporter integrity in the brain. SPECT was performed with a triple-head camera (MultiSPECT3, Siemens, Ohio, USA) equipped with high-resolution collimators. A semiautomatic template model program was used to calculate the ratios between left striatal and right striatal and occipital regions respectively. Total time of acquisition was 30 min (45 s per frame for 40 views per detector). Zoom factor: 1.00 and the matrix size: 128×128. Filtered back-projection acquisition was performed. Images were filtered using a Butterworth filter with a cut-off value of: 0.4–0.5 and an order of 5. A division between the caudate nucleus and putamen was made. The ratios were corrected using Alderson's brain phantom, with known activities in the caudate nucleus and putamen. A binding of 2 SDs below healthy controls was considered as abnormal (FP-CIT 8.25 ± 1.85 for putamen and 7.76 ± 1.77 for caudate nucleus). Beside quantitative analysis, the scans were also judged visually by the same nuclear specialist blinded for the final clinical diagnosis. If quantitative and visual judgments did not match, the conclusion of visual judgement was taken.
Statistical analysis
Analyses were performed with SPSS, V.16.0. To determine the diagnostic performance of the SN+ and the FP-CIT SPECT we constructed receiver operating characteristics (ROC) curves and calculated the area under the curve and their p values.
Results
Patient characteristics
We had originally included 241 patients into the TCS study after approaching 283 possible candidates (see patients flowchart) in the period September 2006 until September 2008. The number of patients with no accessible temporal bone window was 45 (18.7%); these were slightly older patients (mean age of 72.4 vs 69.2 years) and there were by far more women (71% vs 26%) in this group compared with group of patients included in the study. This resulted in a group of 196 patients who had undergone an initial TCS. After 2 years 30 (15.3%) patients had died and 52 (26.5%) patients were not able or willing to undergo a second neurological examination. All the remaining 114 patients underwent examination by two neurologists for a final clinical diagnosis of their movement disorder in the period September 2008 until September 2010. For the other 82 patients we derived a clinical diagnosis from the most recent clinical charts by the treating neurologist. To check the validity of this approach, we also derived these diagnoses from medical records for the 114 patients of whom we did have a gold standard diagnosis, and we found an agreement between these diagnoses with a κ of 0.8. We also found no significant differences in the distribution of diagnoses between the patients groups with and without a gold standard diagnosis. But the group without the gold standard follow-up diagnosis did have a significantly higher age (70.5 vs 67.7 years, p=0.034) and a higher UPDRS total score at inclusion (30.2 vs 22.8, p=0.031).
The final clinical diagnosis was IPD in 102 (52.0%) patients. For further division of the final diagnoses see table 1. The remaining 22 (11.2%) patients with no parkinsonism had alternative diagnoses like isolated tremor, orthostatic tremor, tardive dyskinesia, multi-infarction dementia, Alzheimer's disease, stroke, hypoxic encephalopathy and psychogenic disorders.
Patient characteristics
Final diagnoses and SN
Table 2 gives the presence or absence of an SN+ related to the final diagnoses. The cut-off of 0.20 cm2 corresponds to the 75th percentile of hyperechogenic signal extent at the SN in a healthy population.21 ,27 ,39
Final diagnoses divided to the results of TCS
One can see that the presence and absence of the hyperechogenic SNs are distributed at random over the various diagnoses, without any preference for one particular diagnosis. We also found no significant difference for the maximum size or the sum of the area of the SN+ in the different diagnoses (see table 3, figures 1 and 2). The maximum size of the area of the SN+ is the one side of the mesencephalon on which the SN+ is the largest one. In a considerable number of patients the SN+ was bilaterally present, and then both areas of the SN+ were added. We were not able to obtain better diagnostic discrimination with other TCS cut-offs. For example, when we lowered the sensitivity threshold to an absolute minimum of 0.7, we obtained a cut-off of 0.3 cm2, but then specificity was 0.29.
Final diagnoses divided to the results of the FP-CIT SPECT

Patients’ flow chart.
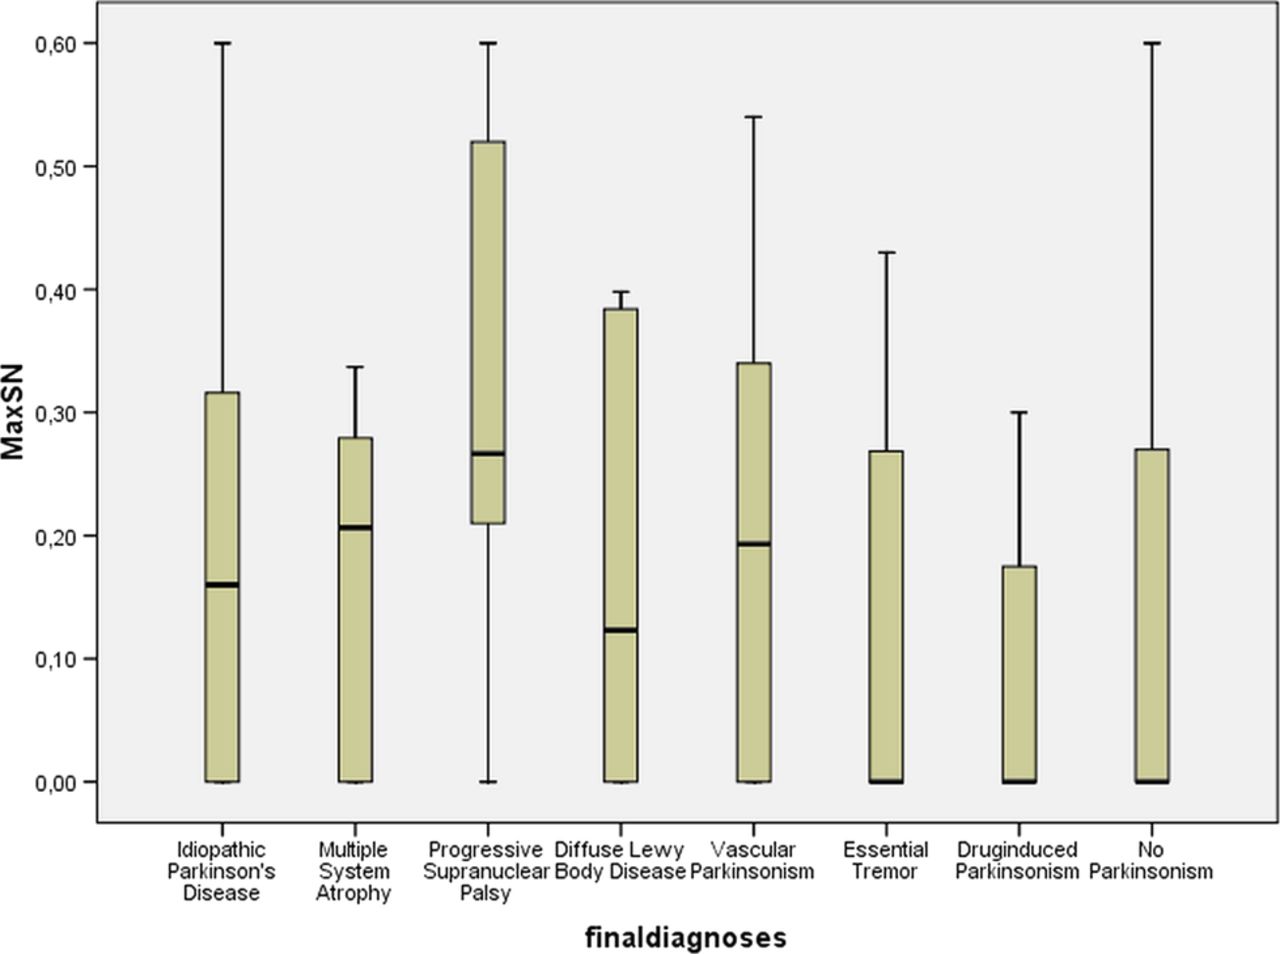
Box plot of final diagnoses compared with the range of the maximum size of the hyperechogenic substantia nigra (SN+).
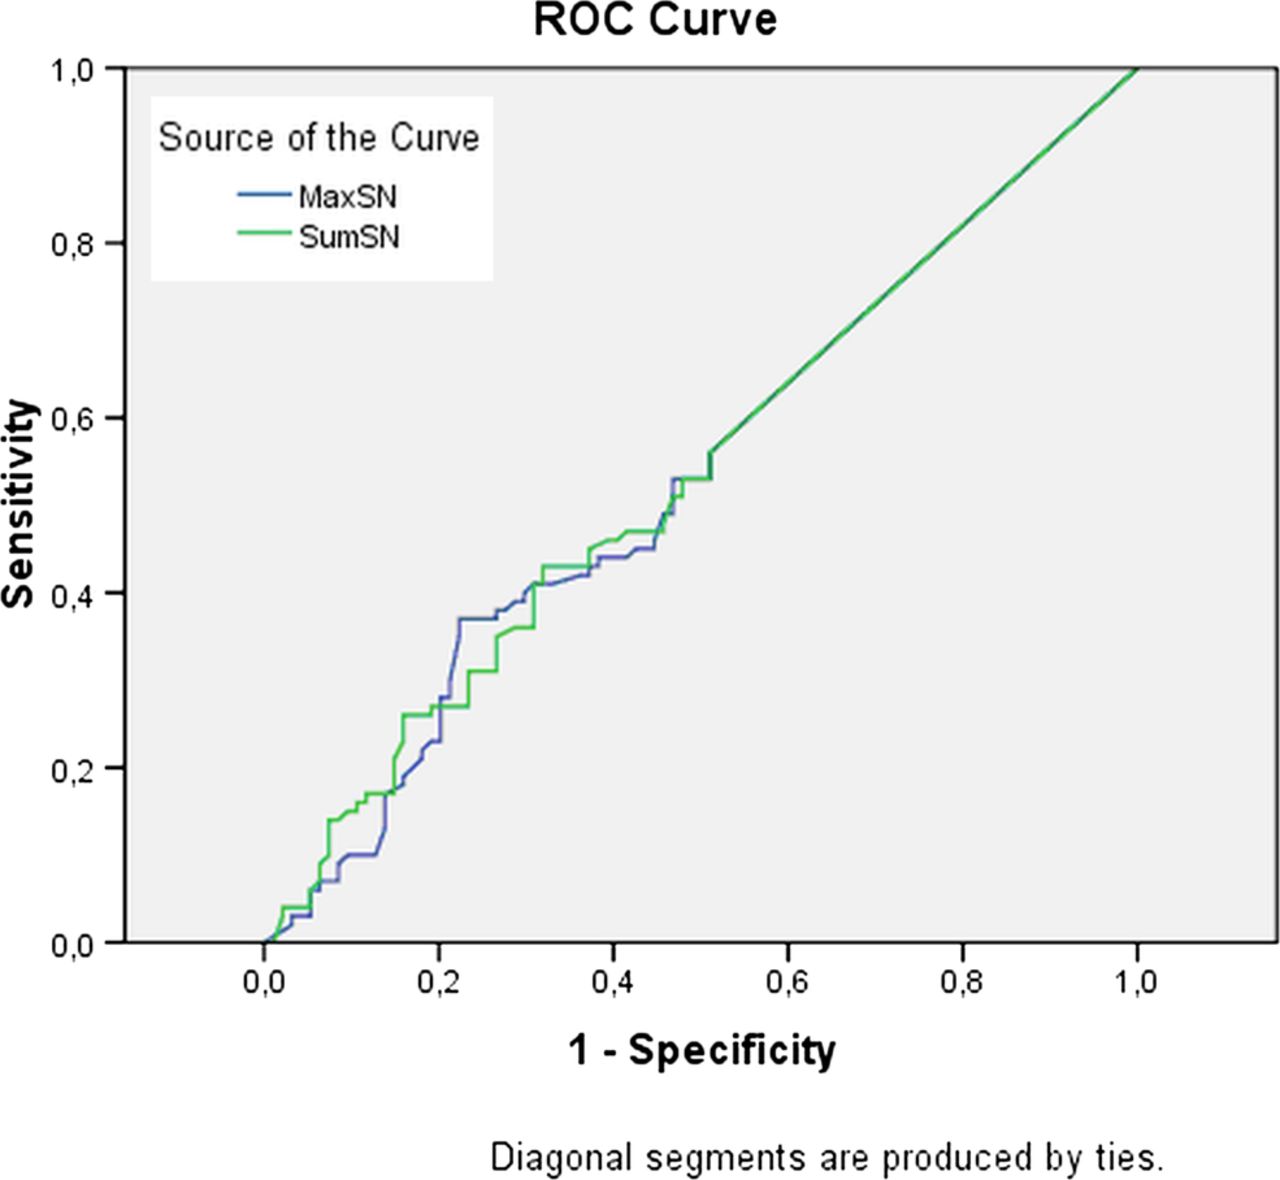
The mean area of the ROC curve was 0.541. The sensitivity of an SN+ for the diagnosis IPD was 0.40 (CI 0.30 to 0.50) and the specificity 0.61 (CI 0.52 to 0.70). PPV was 0.53 and the negative predictive value (NPV) 0.48. As earlier research suggested that SN+ can help diagnose LBD and CBS, we added these two groups to the IPD and recalculated, arriving at the same sensitivity (0.41) and specificity (0.62).
Earlier research had suggested that symmetry of the SN+ helps to differentiate between IPD and LBD. Of the three SN+ in the patients with LBD, 2 (67%) were bilaterally hyperintense. However, 29 (71%) of the 41 SN+ in the IPD patients, were bilaterally hyperintense, so in our population this echofeature had no diagnostic discriminatory value between the diagnoses LBD and IPD. As the current view is that these diagnoses clinically overlap, it may be inappropriate to consider the diagnosis of DLB instead of PD to be a diagnostic error.
Final diagnoses and FP-CIT SPECT scan results
One hundred and seventy-six patients also underwent an FP-CIT SPECT around the same time when they underwent a TCD (table 3). The sensitivity and specificity of FP-CIT SPECT scans for diagnosing IPD was, respectively, 0.88 (CI 0.81 to 0.95) and 0.68 (0.58 to 0.76) with a PPV of 0.75 and an NPV of 0.84. Figure 3 shows the ROC curve of FP-CIT SPECT minimal uptake in the putamen and nucleus caudatus as a diagnostic performance to detect IPD. TCS findings were concordant with SPECT findings in 89 of the 176 patients (p=0.36).
Receiver operating characteristics curve the maximum and the sum of the area of hyperechogenic substantia nigra correlated with the final diagnosis idiopathic Parkinson's disease.
This concordance of TCS and SPECT data was randomly distributed over the diagnostic groups in the 114 patients which had been re-examinated after a follow-up of two years, the SPECT scan and the TCS results were in agreement in only 50 patients (p=0.53). We also studied diagnostic accuracy in terms of delineating PD from non-parkinsonian (APS) syndromes. When we grouped all IPD diagnoses together with all APS diagnoses versus the rest, that is, ET, DIP, VP, etc, we found similar specificity and sensitivity of TCS, respectively, 0.67 and 0.43. In this analysis sensitivity of SPECT remained 0.84 and specificity increased to 0.84.
Discussion
We have tried to assess the diagnostic accuracy of TCS in IPD, in the clinical situation for which one would need the TCS, namely the patient with a recent-onset of parkinsonian syndrome that cannot be diagnosed clinically at the first visit. We thus assessed its accuracy in 241 consecutive patients referred by their GP for analysis of parkinsonian syndrome of recent onset. We used a clinical diagnosis after 2 years as a surrogate gold standard and also compared TCS with FP-CIT SPECT scans. Sensitivity and specificity of SN+ for the diagnosis of IPD was 0.4 and 0.61, respectively. PPV was 0.53 and the NPV 0.48. In contrast, we found that the sensitivity and specificity of FP-CIT SPECT scans for diagnosing IPD was, respectively, 0.88 and 0.68 with a PPV of 0.75 and an NPV of 0.84. The temporal acoustic windows were insufficient in a relatively high proportion of patients: 18.67%.
The strength of our study is its guaranteed prospective nature: we registered this study prospectively and we carried it out exactly as proposed in the published protocol.52 Another strength is its size: it is the largest prospective study on this technique in this patient population up till now. We excluded those patients who already had a clear diagnosis. We have also tried to obtain the best possible surrogate gold standard clinical diagnosis. We did this by having our patients examined by independent experienced movement disorder specialists. The accepted gold standard is postmortem neuropathological examination, but this is hardly feasible anymore in modern times, as relatives are reluctant to permit this. So, the methodologically highest achievable gold standard is clinical examination after several years. This follow-up is essential as the diagnostic criteria contain several items that can only be assessed after a certain amount of time (levodopa response, progression, other diagnoses). The follow-up of 2 years appeared to be a relative maximum, as by then a substantial number of patients had either expired or had deteriorated such that they did not want or were unable to undergo another examination.
We tried to circumvent this by deriving diagnoses from the medical charts of those patients who were not diagnosed by our specialists. Although our validation experiment showed that there was good agreement between these two methods of obtaining final diagnoses, we cannot deny that it may have biased our results. Simultaneous SPECT scans, which were reasonably accurate in diagnosing IPD in our study population, appear to confirm this relative lack of bias. In our study population the FP-CIT SPECT scan did not reach a specificity of 100%, confirming an earlier report that a substantial number of early stage IPD patients have a normal SPECT scan.19
We found substantially lower values for sensitivity and specificity of TCS to diagnose IPD than reported in earlier studies, including our own.20–49 ,60 In diagnostic accuracy studies there are two major sources of variability: spectrum bias and test review bias.61 Spectrum bias is the skewing of test parameters due to differences between study populations. Test review bias is skewing of test parameters due to differences in the amount of clinical information available to the investigator interpreting the test result. We think that spectrum bias is the main cause of the substantial differences between ours and earlier studies. With one exception,30 all the earlier studies were retrospective and involved patients who had already been diagnosed clinically with definite IPD. These later-stage patients are obviously not the patients for whom one needs additional diagnostic tools such as a TCS, as these patients already have a clinical diagnosis. Our study show that results obtained in already diagnosed patients cannot be simply extrapolated to early stage, as yet undiagnosed patients. One could even argue that more selective inclusion of those for whom the diagnosis would really be a ‘toss-up’, may provide different results (perhaps even lower sensitivity/specificity).
Our results also differ from the only other prospective study.30 We believe here that spectrum bias also plays a role: Gaenslen et al excluded patients with resting tremor, which we did not. The establishment of a definite diagnosis also differed between our studies. Gaenslen et al were not able to reach a definite diagnosis in all patients, possibly due to the shorter follow-up (1 vs 2 years in our study).
We cannot rule out test review bias, as we did try to blind the TCS examiner, but not to great lengths. But this, if present, would have skewed the results of Gaenslen et al, and not ours, as we found less diagnostic accuracy in the TCS.
Both our examiners had more than 20 years of experience in ultrasound, and one of us (WHM) spent considerable time, for this research project, training with Prof Berg's group in Tübingen, Germany. We had already carried out an interobserver study, which yielded reasonable intra-rater and inter-rater reliability, in accordance with results by others.54 ,62 Results of TCS seem not be substantially influenced by the type of ultrasound device used,38 and we have in the past also found good diagnostic accuracy in later-stage IPD patients when studied retrospectively.60 One might even reason that the fact that the investigators were so well trained may imply that real-world utility would be even lower than found.
We thus feel that the crucial difference between earlier studies and ours is the prospective unselected nature of our patient population. Our study represented exactly the clinical situation for which one would need the TCS, namely the patient with a recent-onset of parkinsonian syndrome that cannot be diagnosed clinically at the first visit. We show here that, in our hands, the TCS cannot be used reliably for that purpose.
Acknowledgments
We would like to thank Professor Daniela Berg, consultant neurologists Bert Anten, Fred Vreeling, Ania Winogrodzka and Marinus van Kroonenburgh for their helpful cooperation.
References
Footnotes
-
Contributors WEJW, AMMV, AK and WHM conceived the idea of the study and were responsible for the design of the study. AEPB, WEJW and AK were responsible for undertaking the data analysis and produced the tables and graphs. AMMV and WHM provided input into the data analysis. The initial draft of the manuscript was prepared by WEJW and AEPB and then circulated repeatedly among all authors for critical revision. AMMV and AEPB were responsible for the acquisition of the data. All authors read and approved the final manuscript.
-
Funding This work was funded by the ‘Stichting Internationaal Parkinson Fonds, The Netherlands’.
-
Competing interests None.
-
Patient consent Obtained.
-
Ethics approval The Institutional Review Board (IRB) of the Maastricht University Medical Centre.
-
Provenance and peer review Not commissioned; externally peer reviewed.
-
Data sharing statement No additional data are available.