Article Text

Abstract
Objective To conduct a systematic review and meta-analysis of prices of healthier versus less healthy foods/diet patterns while accounting for key sources of heterogeneity.
Data sources MEDLINE (2000–2011), supplemented with expert consultations and hand reviews of reference lists and related citations.
Design Studies reviewed independently and in duplicate were included if reporting mean retail price of foods or diet patterns stratified by healthfulness. We extracted, in duplicate, mean prices and their uncertainties of healthier and less healthy foods/diet patterns and rated the intensity of health differences for each comparison (range 1–10). Prices were adjusted for inflation and the World Bank purchasing power parity, and standardised to the international dollar (defined as US$1) in 2011. Using random effects models, we quantified price differences of healthier versus less healthy options for specific food types, diet patterns and units of price (serving, day and calorie). Statistical heterogeneity was quantified using I2 statistics.
Results 27 studies from 10 countries met the inclusion criteria. Among food groups, meats/protein had largest price differences: healthier options cost $0.29/serving (95% CI $0.19 to $0.40) and $0.47/200 kcal ($0.42 to $0.53) more than less healthy options. Price differences per serving for healthier versus less healthy foods were smaller among grains ($0.03), dairy (−$0.004), snacks/sweets ($0.12) and fats/oils ($0.02; p<0.05 each) and not significant for soda/juice ($0.11, p=0.64). Comparing extremes (top vs bottom quantile) of food-based diet patterns, healthier diets cost $1.48/day ($1.01 to $1.95) and $1.54/2000 kcal ($1.15 to $1.94) more. Comparing nutrient-based patterns, price per day was not significantly different (top vs bottom quantile: $0.04; p=0.916), whereas price per 2000 kcal was $1.56 ($0.61 to $2.51) more. Adjustment for intensity of differences in healthfulness yielded similar results.
Conclusions This meta-analysis provides the best evidence until today of price differences of healthier vs less healthy foods/diet patterns, highlighting the challenges and opportunities for reducing financial barriers to healthy eating.
- HEALTH ECONOMICS
- PREVENTIVE MEDICINE
- PUBLIC HEALTH
- SOCIAL MEDICINE
This is an Open Access article distributed in accordance with the Creative Commons Attribution Non Commercial (CC BY-NC 3.0) license, which permits others to distribute, remix, adapt, build upon this work non-commercially, and license their derivative works on different terms, provided the original work is properly cited and the use is non-commercial. See: http://creativecommons.org/licenses/by-nc/3.0/
Statistics from Altmetric.com
Strengths and limitations of this study
-
This systematic review and meta-analysis represents, to our knowledge, the most comprehensive examination of the evidence on prices of more versus less healthy foods and diet patterns. The strengths include the systematic search; adjustment for inflation and purchasing power parity; separate analyses of food groups, diet patterns and units of price; and evaluation of heterogeneity by food type, intensity of contrast and unit of comparison.
-
The study was limited by less available data on restaurant prices and prices from low-income and middle-income countries. High statistical heterogeneity was evident, although the actual observed range of price differences was more modest.
Introduction
Consumption of a healthy diet is a priority for reducing chronic diseases including obesity, diabetes, cardiovascular diseases and several cancers. This is especially crucial for socioeconomically disadvantaged populations, who have less healthy diets and higher disease risk than higher socioeconomic groups.1–4 Many factors, including the availability and cultural acceptability of healthy foods, pose obstacles to the promotion of healthy diets. One of the most commonly described barriers is cost: conventional wisdom holds that healthier foods and diets are more expensive than less healthy options, an assumption which has become “a reflexive part of how we explain why so many Americans are overweight.”5
Yet, while several studies have evaluated whether healthier foods or diets cost more,6–10 the evidence has never, to our knowledge, been systematically reviewed nor quantified to critically evaluate all the evidence for the relationship between healthfulness of foods or diet patterns and price. In addition, little is known about the potential heterogeneity of this relationship. For example, price differences may vary by the foods or diets being compared. Many studies compare healthier and less healthy versions of the same food (ie, more vs less healthy grains), while other studies examine the price differences of healthier vs less healthy overall diet patterns, containing very different foods. Price differences may also depend on how healthfulness is defined, ranging from definitions based on single nutrients (eg, fat or sugar content) to those based on food types or more complex diet patterns. The intensity of the health contrast could also affect the price difference; for example, a fast food meal versus a healthier home-cooked meal is a more extreme comparison than a low-fat versus high-fat cookie. Finally, price differences may vary by the unit of comparison, for example, per serving, per calorie, or per day. In particular, price differences per calorie may be limited by reverse causation, as healthier foods (eg, fruits and vegetables) often have fewer calories; and evaluation of price differences per serving may alter the conclusions.11
To address each of these key gaps in knowledge, we performed a systematic review and meta-analysis of the evidence for relationships between the healthfulness of foods/diet patterns and their price, including consideration of different food groups and diet patterns, definitions of healthfulness, intensities of the contrast and units of comparison (calorie, serving and daily diet).
Methods
We followed the Meta-analysis of Observational Studies in Epidemiology (MOOSE) guidelines throughout all stages of design, implementation and reporting.12 The independent and dependent variables of interest were the healthfulness of foods or diet patterns and their price, respectively. The protocol, which was not altered after beginning the study, is available from the authors on request.
Search strategy and selection of articles
Systematic searches were conducted using MEDLINE (via PubMed) for all eligible English language articles published through December 2011. Additional articles were identified by expert consultations, and hand-reviews of reference lists and the first 20 “Related citations” in PubMed for all studies included after full-text review. Because our focus was on contemporary price differences related to healthfulness, and because such price differences could vary in earlier decades, we focused our search on studies having collected price data in the year 2000 or later. The search query combined the terms related to foods/diet patterns, price, setting and time (supporting appendix 1).
Studies were included if they reported the mean retail prices of foods (including beverages) or diet patterns stratified by a specified measure of healthfulness, as well as sufficient (or obtainable by direct contact) data to derive or estimate the statistical uncertainty (ie, SE of difference in means). No foods or diet patterns were excluded. Studies reporting wholesale price or perceived rather than the actual price, as well as reviews, letters, editorials and commentaries, were excluded.
One investigator screened all identified studies based on these inclusion and exclusion criteria by title and abstract. Following screening, remaining full-text articles were obtained and reviewed independently and in duplicate by two investigators for final inclusion/exclusion using the same criteria. Any differences were resolved by discussion among all of the investigators. A list of excluded citations is available from the authors on request.
Data extraction and synthesis
For each included study, two investigators extracted data independently and in duplicate using a standardised electronic spreadsheet. Data extracted included first author, title, publication year, year of price data collection, source of price data, demographic variables of study participants and/or community from which price data were collected, definition(s) of healthfulness, food/diet pattern comparison(s), the number of participants and/or the number of foods and mean prices and uncertainties (including unit, eg, calorie and serving) of the healthier and less healthy foods/diet patterns compared. Because the magnitude of differences in healthfulness could influence price differences, we also rated the intensity of the contrast in health difference between the compared foods/diet patterns on an ordinal scale (1–10), with 1 representing a very small difference in healthfulness and 10 a marked difference in healthfulness. These ratings were based on growing evidence that different types of foods and food-based diet patterns predict chronic disease outcomes better than differences in single nutrients.13 Thus, foods/diet patterns that differed by a single nutrient were rated as lower intensity, while foods/diet patterns that differed across multiple aspects (eg, three home-cooked meals vs three fast-food meals) were rated as higher intensity. The intensity of contrast was rated independently and in duplicate by two investigators with good concordance (generally ≤2 points); discrepancies were resolved by group discussion. These ratings are available in the supporting information.
Statistical analysis
Our primary endpoint was the difference in mean price between the healthier and less healthy foods or diet patterns. When data on the variance of the difference in means or information to directly calculate this variance were not reported, we calculated it based on the variance of the mean prices in each category, based on standard formulas14:

For nine studies in which mean prices were reported without their uncertainty, the SEs were imputed from the number of observations in each category, based on linear regression of studies with complete data, performed separately for market surveys (6 studies comparing samples of foods) and individual dietary surveys (3 studies comparing diets across samples of participants; supporting figure 1).
We recognised that price comparisons within food groups (ie, healthier vs less healthy options within the same category of food) may vary from price comparisons across overall diet patterns. Furthermore, price differences may vary for diet patterns largely based on foods versus diet patterns largely based on one or a few isolated nutrients. Thus, we separately investigated price differences that compared options within a single similar category of food (eg, meats/protein, grains, dairy), price differences that compared varying concordance to food-based diet patterns (eg, Alternative Healthy Eating Index, Western or Mediterranean diet patterns) and price differences that compared varying concordance to isolated nutrient-based (eg, fat, sugar) diet patterns. For analyses of diet patterns, we evaluated price differences for the extreme categories (eg, the top vs bottom quartile or quintile) of diet, to enable comparisons of the largest differences in diet quality.
Because price differences could also vary by the unit of comparison, findings for foods were evaluated and standardised to one usual serving and to 200 kcal; and for diet patterns, standardised to 1 day (3 meals) and to 2000 kcal. Standard serving sizes were based on the 2011 United States Department of Agriculture (USDA) MyPlate guidelines or, if not available from MyPlate, on nutrition labels from a major grocery website.15 ,16 Calorie conversions were derived from the USDA database.17 For standardising studies of food baskets to meals, one serving of any food was assigned as one-fourth of a meal, except for condiments, fats or oils for which one serving was assigned one-eighth of a meal. All price differences were adjusted for inflation by country to reflect the prices in 2011. In addition, to account for the varying values of currencies across countries, these prices were further adjusted for purchasing power parity by standardising to 2011 international dollars; one international dollar is defined as US$1. Inflation rates and purchasing power parity conversion factors were obtained from the World Bank; 2011 is the latest year for which these data are available.18 We also repeated all analyses with an additional weighting for the intensity of the contrast in healthfulness (range 1–10), that is, with greater differences (higher intensity values) carrying greater weights.
Summary estimates were quantified using inverse-variance weighted, random effects meta-analysis (metan command in Stata). Statistical heterogeneity was evaluated using the I2 statistic. Metaregression (metareg command in Stata) was performed on intensity, study location (USA/Canada vs other) and type of survey (market survey vs dietary survey) to explore the potential sources of heterogeneity. Publication bias was assessed using the Egger test and visual inspection of funnel plots. Statistical analyses were performed using Stata V.12 (StataCorp, College Station, Texas, USA), with two-tailed α=0.05.
Results
Search results and study characteristics
Of 1010 articles identified by the MEDLINE search and screened for inclusion, 83 were selected for full-text review (figure 1). Of these, 19 articles met the inclusion criteria, and an additional 8 articles were identified from hand-searches of references lists, related citations in PubMed and expert consultations. Among the final 27 studies, 14 were conducted in the USA, 2 in Canada, 6 in Europe and 5 in other countries including South Africa, New Zealand, Japan and Brazil (table 1). Twelve studies were market surveys, and 15 were dietary surveys. The number of foods evaluated by the market surveys ranged from 2 to 133, with prices collected from between 1 and 1230 stores. The number of participants evaluated by the dietary surveys ranged from 30 to 78 191. Several studies reported prices for multiple food comparisons or from different types of stores and contributed more than one estimate to the analysis.
Characteristics of food price studies included in meta-analysis
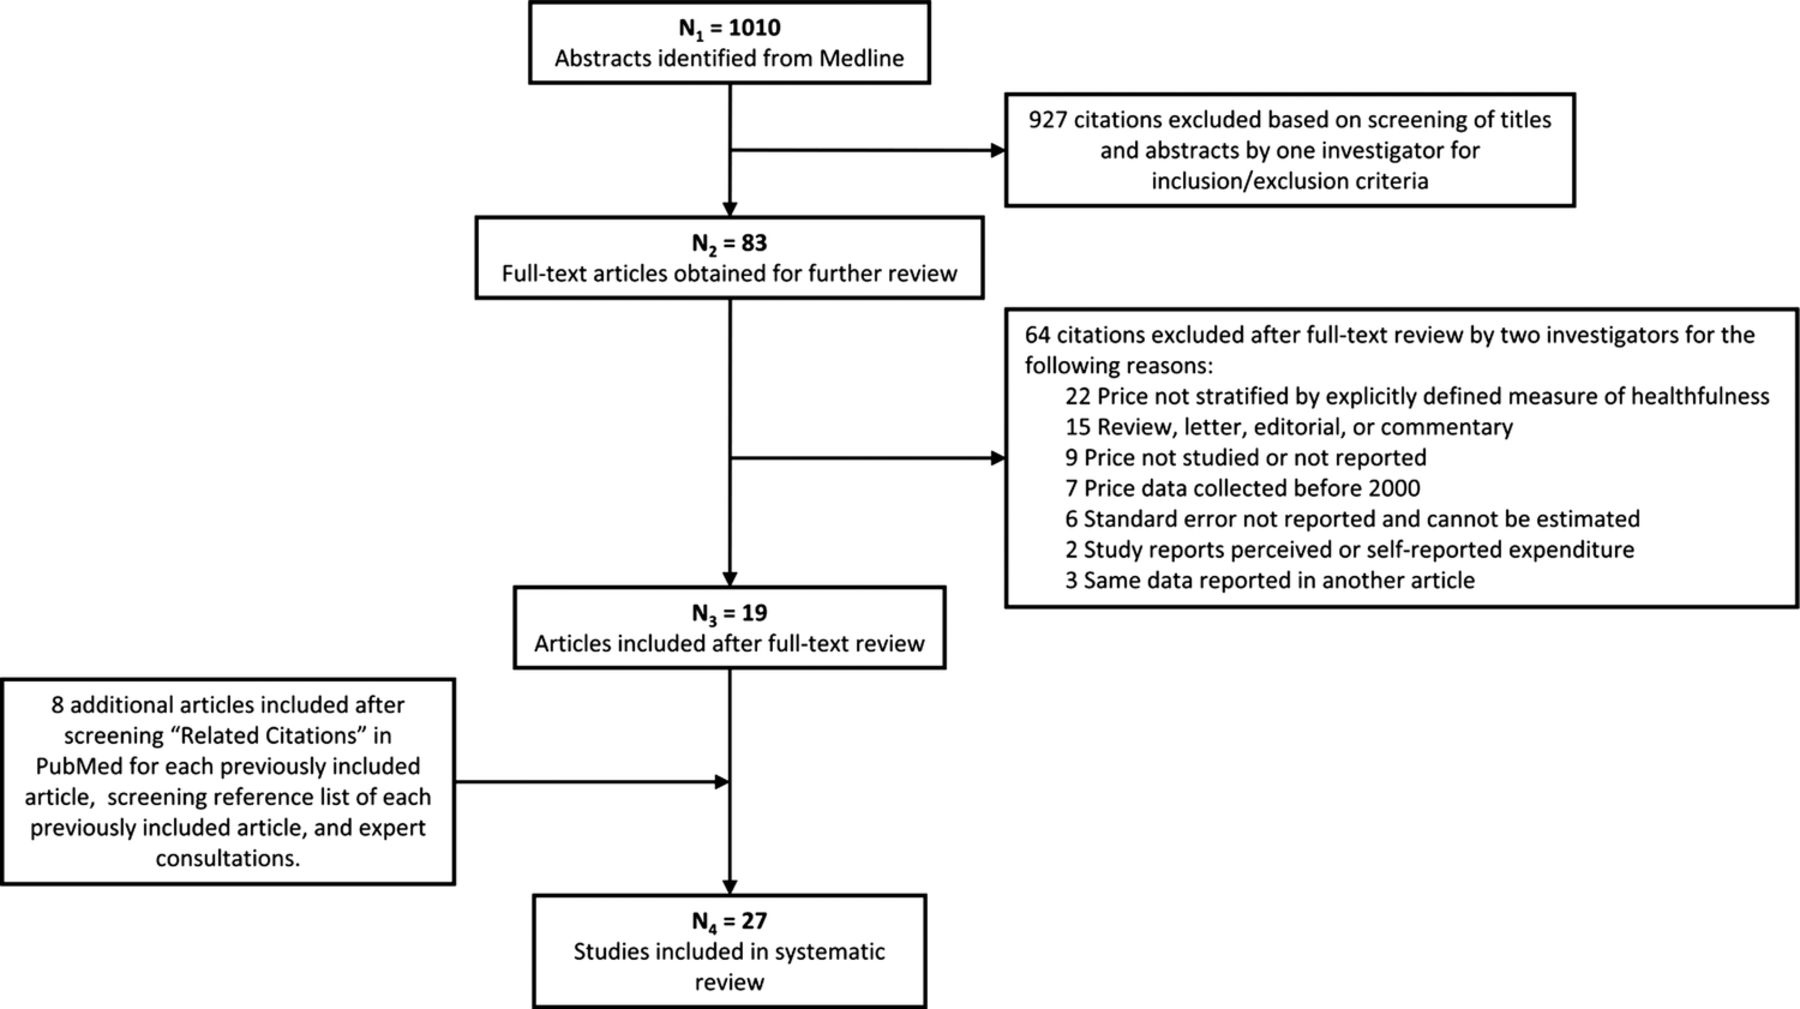
Search and screening of studies comparing prices of healthier and less healthy foods or diet patterns.
Price differences of foods
Evidence on price comparisons within similar food groups was available in six major food groups, including meats/protein, grains, dairy, snacks/sweets, fats/oils and soda/juice.
Per serving, meats/protein exhibited the largest price difference by healthfulness (figure 2A). On average, the healthier choice was $0.29 more expensive per serving than the less healthy choice (95% CI $0.19 to $0.40). Considerable statistical heterogeneity was evident (I2=99.4%) that appeared at least partly related to the type of comparison. For example, price differences by healthfulness appeared largest for chicken, intermediate for beef, and smallest for peanut butter. Healthier snacks/sweets, grains and fats/oils were also more expensive per serving than less healthy options, but with smaller price differences: for snacks/sweets, $0.12/serving ($0.02 to $0.23); for grains, $0.03/serving ($0.01 to $0.05) and for fats/oils, $0.02/serving ($0.01 to $0.02). For dairy, healthier options were slightly less expensive per serving (−$0.004/serving; 95% CI −$0.005 to −$0.004), although pooled findings were driven by one study with reported high statistical certainty. Excluding this study, healthier dairy options were similar in price to less healthy options (−$0.004/serving, p=0.389). No significant price differences per serving were seen between healthier and less healthy soda/juice ($0.11; 95% CI −$0.34 to $0.56; I2=25.1%), but only two studies evaluated this comparison.


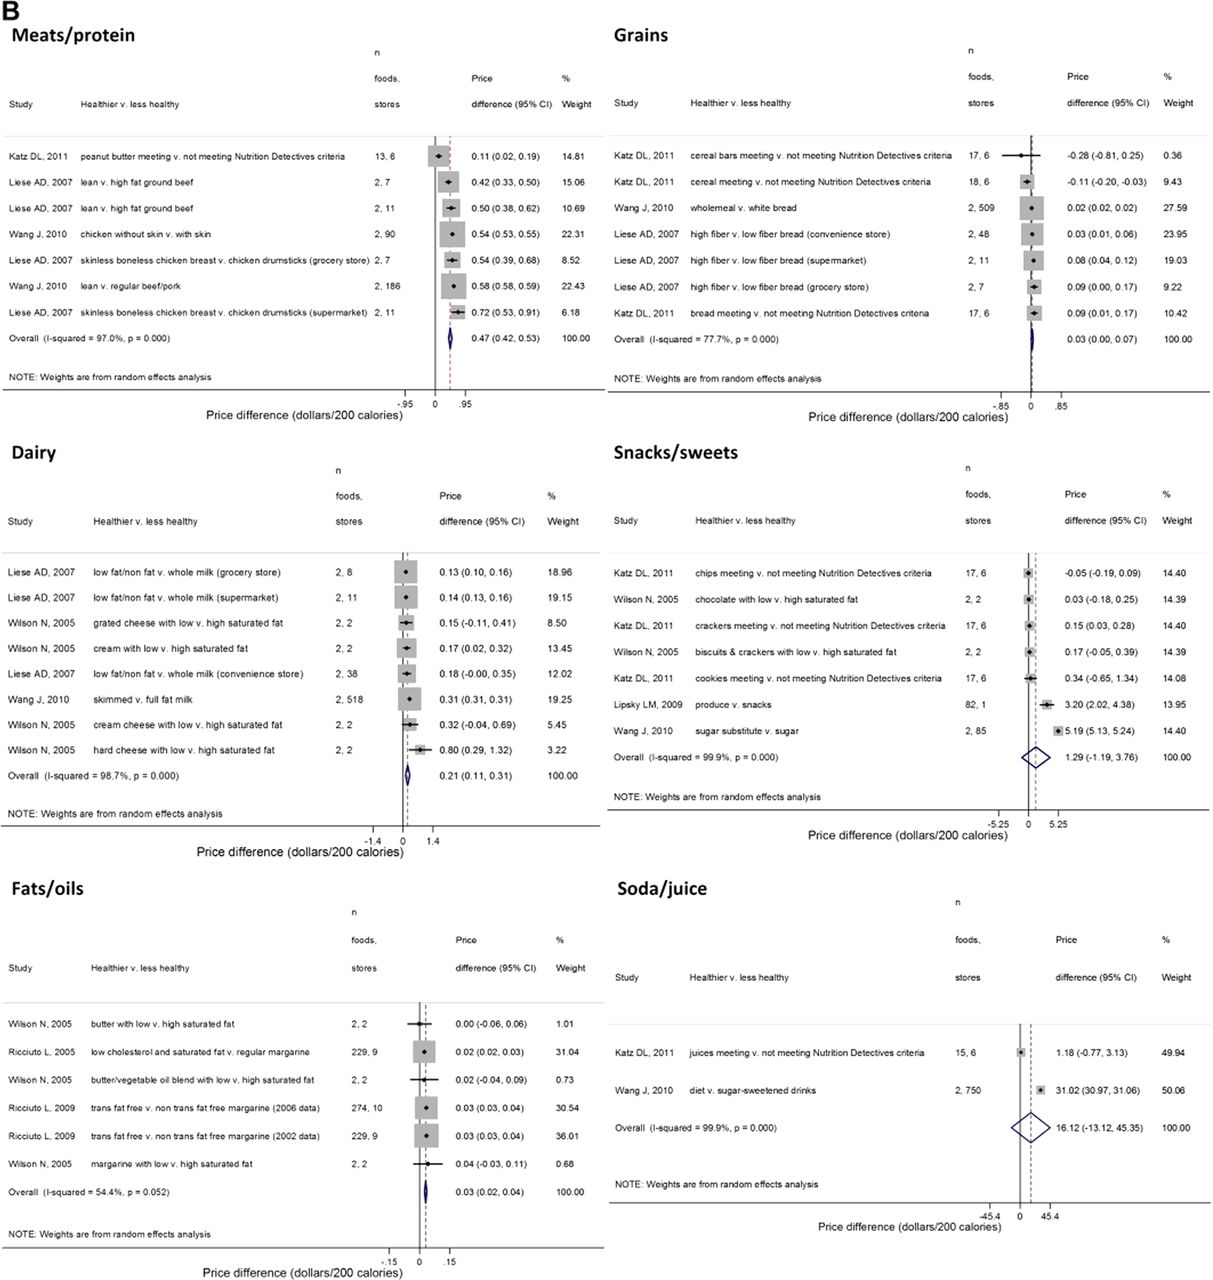
Price difference between healthier and less healthy foods per serving (A) and per 200 kcal (B). Price difference defined as the healthier category minus the less healthy category. Standardised serving sizes were derived from the 2011 United States Department of Agriculture (USDA) MyPlate guidelines or, if not available from MyPlate, nutrition labels from a major grocery website. Calorie-adjustment of price differences based on the USDA database. Summary estimates were generated using a random effects model in which the studies were weighted according to the inverse variance of the price difference. All estimates were adjusted for inflation and purchasing power parity—standardised to the international dollar, defined as US$1—by country to reflect the prices in 2011.
For most of these food groups, findings were similar or stronger for pooled price differences standardised per calorie (figure 2B), rather than per serving. The largest price difference was again among meats/protein, with healthier options costing $0.47/200 kcal more ($0.42–$0.53) than less healthy options. The main exception was dairy foods, for which the pooled price difference per 200 kcal was much greater than the price difference per serving. Per 200 kcal, healthier dairy foods were $0.21 more expensive than less healthy options ($0.11–$0.31), consistent with the strong calorie effect of the metric (fat content) that was used to define healthfulness in this food group.
Price differences of diet patterns
Twenty studies evaluated price differences according to concordance with overall healthful diet patterns, with 14 studies evaluating more food-based patterns and 7 studies evaluating more nutrient-based patterns (one study evaluated both19).
Comparing extreme categories of food-based diet patterns, the highest category of healthier diets cost $1.48/day ($1.01 to $1.95) more than the lowest category (figure 3A). The findings were broadly consistent across several different definitions of healthful diet patterns, including based on the Mediterranean dietary pattern, Western dietary pattern, Alternative Healthy Eating Index, fruit and vegetable intake and energy density. Some food-based diet patterns exhibited smaller or no price differences, including based on the Healthy Eating Index, the Environmental Standards for Healthy Eating and comparing home-cooked to fast food meals. When standardised to 2000 kcal, healthier food-based diet patterns cost $1.54 more than less healthy options ($1.15–$1.94), with price differences modestly larger for patterns based on the Alternative Healthy Eating Index and energy density, smaller for patterns based on fruit and vegetable consumption alone, and no longer significant for the Mediterranean dietary pattern (figure 3B).


Price difference between healthier and less healthy food-based diet patterns per day (A) and per 2000 kcal (B). Price difference defined as the healthier category minus the less healthy category. Dollars/day was defined as dollars/three meals. One serving of any food was assumed to comprise one-fourth of a meal, except for condiments, fats and oils for which one serving was assumed to comprise one-eighth of a meal. Calorie-adjustment of price differences based on the United States Department of Agriculture (USDA) database. Information reported was not sufficient to perform calorie-adjustment for Mozaffarian et al.37 Energy density was included as a food-based pattern since this metric represents a set of foods more than it represents any single nutrient.19 For studies reporting price across quantiles of healthfulness, the most extreme quantile comparison was selected for meta-analysis. Number of participants reported for dietary surveys (studies comparing diets across samples of participants), and number of foods reported for market surveys (studies comparing samples of foods). Summary estimates were generated using a random effects model in which studies were weighted according to the inverse variance of the price difference. All estimates were adjusted for inflation and purchasing power parity—standardised to the international dollar, defined as one US$—by country to reflect prices in 2011.
For diet patterns based largely on single or a few isolated nutrients, the price of the highest (healthiest-rated) category of diets meeting these criteria was not significantly different from the lowest (least healthy-rated) category of diets meeting the criteria when based on a day's intake (figure 4A). In contrast, when standardised to 2000 kcal, the highest category of nutrient-based patterns cost $1.56 more than the lowest ($0.61–$2.51; figure 4B). Price differences per 2000 kcal were larger relative to the per day estimates for patterns based on fat; sugar; and fibre, fat, and sugar combined.


Price difference between healthier and less healthy nutrient-based diet patterns per day (A) and per 2000 kcal (B). One outlying, implausible estimate from Aggarwal et al38 (mean adequacy ratio) was excluded ($17.23; 95% CI $14.35 to $20.11). Price difference was defined as the healthier category minus the less healthy category. Dollars/day was defined as dollars/three meals. One serving of any food was assumed to comprise one-fourth of a meal, except for condiments, fats and oils for which one serving was assumed to comprise one-eighth of a meal. Calorie-adjustment of price differences based on the United States Department of Agriculture (USDA) database. Information reported was not sufficient to perform calorie-adjustment for Temple et al39 and Krukowski et al.40 For studies reporting price across quantiles of healthfulness, the most extreme quantile comparison was selected for meta-analysis. Number of participants reported for dietary surveys (studies comparing diets across samples of participants), and number of foods reported for market surveys (studies comparing samples of foods). Summary estimates were generated using a random effects model in which studies were weighted according to the inverse variance of the price difference. All estimates were adjusted for inflation and purchasing power parity—standardised to the international dollar, defined as US$1—by country to reflect prices in 2011.
We also performed analyses restricted to the US studies. Results were similar: healthier food-based diet patterns cost an average of $1.49/day ($0.60 to $0.237; n=7 studies) and $1.79/2000 kcal ($0.78 to $2.80; n=6 studies) more than less healthy patterns. Healthier nutrient-based diet patterns cost an average of $0.40/day ($0.17 to $0.63; n=3 studies) and $2.46/2000 kcal (-$2.17 to $7.09; n=2 studies) more than less healthy patterns.
Intensity of the contrast in healthfulness
We repeated all analyses adjusting for differences in the intensity of contrast in healthfulness in each comparison. Within food groups, intensities of contrasts were generally rated in the 4–6 range, with a smallest contrast of 3 (eg, comparing different types of cookies) and a largest of 9 (eg, comparing fruits/vegetables to packaged snacks). For food groups, intensity-weighted price differences were generally similar to the unweighted findings (supporting figure 2). Contrasts of diet patterns were most often rated 6 or 7, with a smallest contrast of 1 (comparing patterns based on total fat alone) to a largest of 10 (comparing 3 healthier home-cooked meals to 3 fast food meals). Compared with unweighted comparisons, the intensity-weighted price differences of healthier versus less healthy food-based diet patterns were similar: $1.46/day ($1.00 to $1.92) and $1.53/2000 kcal ($1.14 to $1.93; supporting figure 3). Intensity-weighted price differences were also similar to unweighted results for nutrient-based diet patterns: $0.11/day (−$0.64 to $0.85) and $1.66/2000 kcal ($0.55 to $2.78; supporting figure 4).
Potential sources of heterogeneity
Statistical heterogeneity as quantified by the I2 statistic was high in most analyses. Metaregression did not identify significant effect modification based on study location (USA/Canada vs other), intensity of the contrast in healthfulness or study type (market survey vs dietary survey) (data not shown). Metaregression by study type (market survey vs dietary survey) was not possible for the food group analyses due to collinearity.
Publication bias
Publication bias was assessed using the Egger test and funnel plots (supporting figure 5).20 There was no significant bias identified by the Egger test. Visual inspection of funnel plots suggested asymmetrical distributions for dairy food, food-based diet patterns and nutrient-based diet pattern comparisons, consistent with a larger number of smaller studies reporting greater price differences than the overall pooled estimate.
Discussion
The findings from this systematic review and meta-analysis provide the most robust evidence until today on price differences of healthier versus less healthy foods and diet patterns. The results by food group provide insight into the relationship between healthfulness and price among similar foods. The results by diet pattern inform price differences for larger extremes of healthfulness, comparing very different foods, for example, diets rich in fruits and vegetables versus diets rich in processed foods. Although statistical heterogeneity was high, this was at least partly related to relatively small statistical uncertainty of each within-study price difference. The magnitude of clinically relevant heterogeneity was much lower, with comparatively similar price differences between studies. In addition, with a few exceptions, findings were similar across different units of price (per serving or day or calorie), intensity of contrast, study location and type of survey, thereby increasing the confidence in the validity and consistency of the findings.
Price differences of foods
Among six food groups, relatively large price differences were observed for meats/protein, as well as smaller but statistically significant differences for snacks/sweets, grains, fats/oils and dairy. According to the USDA, the farm share of proceeds of a $1 expenditure on domestically produced food in the USA is 14.1 cents (in 2010),21 suggesting that final retail prices are determined largely by other industries and procedures in the food supply chain. Additional cost of processing and manufacturing could explain some of the identified variation in price differences; for example, lean beef and skinless chicken require more processing, perhaps accounting for their higher price. Our findings highlight the need for more research on the underlying drivers of price differences of specific items within broad food categories.
Our findings also demonstrate that, for certain metrics of healthfulness, the selected unit of comparison alters the results. In particular, metrics based largely on fat content demonstrated greater price differences per calorie than per serving. The most striking example was for dairy foods: healthier options were $0.004 less expensive per serving but $0.21 more expensive per 200 kcal. Whole milk contains nearly twice the calories as fat-free milk,17 so nearly double the amount of fat-free milk must be purchased to achieve equivalent calories. These findings highlight the dangers of circular reasoning (eg, selecting a metric based on fat content and then evaluating price differences per calorie) and the importance of identifying the most relevant unit of comparison for any individual or public health decision about price differences of foods.11
Price differences of diet patterns
On average, healthier food-based diet patterns were more expensive than less healthy patterns, whether based on an actual day's intake or per 2000 kcal. The price difference—about $1.50/day—represents the price difference per person for consuming a much healthier versus much less healthy overall diet, for example, comparing Mediterranean-type diets rich in fruits, vegetables, fish and nuts versus diets rich in processed foods, meats and refined grains. Thus, this price difference is for a relatively extreme contrast between the healthiest and least healthy diet pattern. Better adherence to such food-based diet patterns consistently relates to improved health and lower risk of chronic diseases.22 ,23
In contrast to the findings for food-based diet patterns, healthier versus less healthy nutrient-based diet patterns were not significantly different in price when based on a day's actual intake, but only cost more when standardised to 2000 kcal. These results mirror those observed when comparing individual food groups, such as dairy, based on single-nutrient metrics of healthfulness. These findings emphasise the crucial role of the unit of comparison when comparing prices by nutrient-based metrics. Healthier diets defined based on fibre or fat content will, by definition, have fewer calories, so they will naturally cost more per calorie. Yet, such diets will not necessarily cost more per serving or per meal. In the setting of a global obesity pandemic, assessing price differences per calorie may make little sense when a healthier diet also leads to reductions in total calorie consumption. Growing evidence also indicates that single or selected nutrients are less useful for distinguishing effects on major chronic diseases than types of foods and food-based diet patterns.13
Heterogeneity
In most comparisons, statistical heterogeneity as measured by I2 was high. Yet, adjustment for intensity of differences in healthfulness had little effect on pooled price differences, and meta-regression revealed no significant effect modification by intensity, study location or study type. The high I2 values may be partly explained by the relatively small statistical uncertainty for each within-study price difference. In many of the identified studies, the combination of a continuous outcome (price) and a relatively large number of samples (foods or individuals) resulted in low uncertainty of each study-specific price difference. A lower within-study uncertainty produces higher I2 values, even when absolute magnitudes of price heterogeneity among studies may be modest from a public health or practical perspective. For example, the price differences among snacks/sweets studies fell within a relatively limited range (−$0.04 to $0.30/serving), with a reasonable summary estimate of $0.12/serving, but statistical heterogeneity was high (I2=85.9%) partly due to narrow within-study CIs. Thus, the calculated heterogeneity in each summary estimate should be interpreted in light of the actual range of observed price differences across studies. Since clinically relevant heterogeneity was lower than statistical heterogeneity, the pooled results provide an insight into average price differences between healthier and less healthy foods and diet patterns.
Although similar classes of foods and diet patterns were evaluated separately, the foods or diet patterns within each category were not exactly the same. Our aim—and the relevant public health question—was not to evaluate whether one specific product costs more than another, but whether healthier foods in a broad class of foods cost more, on average, than less healthy foods in the same broad class.
Strengths and limitations
Several strengths can be highlighted. This systematic review and meta-analysis represents, to our knowledge, the most comprehensive examination of the evidence on prices of more versus less healthy foods and diet patterns. Our systematic search makes it unlikely that we missed any large reported studies. Error and bias were each minimised by independent, duplicate decisions on inclusion of studies and data extraction. Adjustment for inflation and purchasing power parity to 2011 prices accounted for the varying value of money across years and countries. The exclusion of price data prior to the year 2000 increased the generalisability of the results to contemporary diets. A key strength of our analysis was evaluation of food groups separately from diet patterns. The former provides data to inform choices when comparing otherwise relatively similar foods, whereas the latter informs price differences across very different selections of foods. Additional strengths include the standardisation of disparate metrics, foods and units; the assessment of food-based and nutrient-based diet patterns; and the evaluation of heterogeneity by food type, intensity of contrast and unit of comparison.
Potential limitations should be considered. Like all meta-analyses, our analysis was based on the available data; for certain comparisons, relatively few studies were available. For example, only one study directly compared the prices of restaurant foods with home-cooked foods; all other studies evaluated supermarket prices. Thus, our results summarise the best current data on price differences of foods and diet patterns while also highlighting the gaps in knowledge that require further investigation. Definitions of healthfulness varied across food groups and diet patterns. Yet, our findings across a variety of diet patterns and definitions of healthfulness inform how such contrasts may influence price differences. Our assessment of publication bias suggested that price differences for dairy foods and diet patterns may be partly overestimated due to selective publication of smaller studies with more extreme estimates. Statistical heterogeneity was evident in most comparisons, a significant consideration in the interpretation of the results. All meta-analyses must strike a balance between the imperative for generalisability and the need to minimise heterogeneity. Additionally, the actual range of observed price differences for many comparisons was not extreme. The rating system for intensity of contrast was subjective; yet, the ratings were assigned independently and in duplicate with good concordance and provide important sensitivity analyses on the robustness of the results. Our findings on price differences per day and per 2000 kcal reflect an adult diet; the summary estimates should be adjusted for other caloric intakes, for example, in young children. Only English-language studies from PubMed were included, so some studies may have been missed. Given the absence of accepted criteria for judging the quality of observational studies, quality of studies was not formally assessed. Most of the comparisons were from high-income countries, highlighting the need for similar studies in low-income and middle-income nations.
Conclusions
In sum, our findings provide the most complete evidence until today on price differences of healthier foods and diet patterns, while also highlighting the importance of carefully considering the metric of healthfulness, intensity of contrast and unit of comparison. Our results indicate that lowering the price of healthier diet patterns—on average ∼$1.50/day more expensive—should be a goal of public health and policy efforts, and some studies suggest that this intervention can indeed reduce consumption of unhealthy foods.24–26
It remains an open question as to why healthier diets cost more. Some have argued that US agricultural subsidies for commodities (eg, corn and soy) lower the price of less healthy, more processed foods compared with unprocessed foods.27 However, careful economic analyses demonstrate that the main impact of such subsidies is a direct income transfer to farmers, with little influence on retail prices; and that tariffs and other protectionist policies are actually raising the prices of many commodities such as sugar.28–30 Conversely, many decades of policies focused on producing inexpensive, high volume commodities have led to a complex network of farming, storage, transportation, processing, manufacturing and marketing capabilities that favour sales of highly processed food products for maximal industry profit.31 Based on these experiences, efforts to create an infrastructure and commercial framework that facilitates production, transportation and marketing of healthier foods could increase the availability and reduce the prices of more healthful products.31 Taxation of less healthy foods and subsidies for healthier foods would also be an evidence-based intervention to balance price differences.31
Other potential barriers to a healthier diet exist, such as availability and cultural acceptability. However, our findings suggest that for socioeconomically disadvantaged populations, the relatively higher cost of healthy foods may be an impediment to eating better. On the other hand, Americans at all income levels allocate too little of their food budgets towards healthy foods.32 A daily price difference of ∼$1.50 translates to ∼$550 higher annual food costs per person. For many low-income families, this additional cost represents a genuine barrier to healthier eating. Yet, this daily price difference is trivial in comparison with the lifetime personal and societal financial burdens of diet-related chronic diseases.33 34 For example, suboptimal diet quality was recently estimated to account for 14% of all disability-adjusted life years in 2010 in the USA35; if translated to a proportion of national health expenditures in 2012,36 this corresponds to diet-related healthcare costs of $393 billion/year or more than $1200/year for every American. Our findings highlight the nuanced challenges and the opportunities for reducing financial barriers to healthy eating.
References
Supplementary materials
Supplementary Data
This web only file has been produced by the BMJ Publishing Group from an electronic file supplied by the author(s) and has not been edited for content.
Files in this Data Supplement:
- Data supplement 1 - Online supplement
Footnotes
-
Contributors MR and DM conceived the study design and aims and drafted the manuscript and they are the guarantors. MR, AA, and GS performed the systematic review and data extraction. MR performed the analysis. MR, AA, GS and DM interpreted the results. AA and GS contributed to manuscript revisions.
-
Funding Funding support was provided by a Genes and Environment Initiative (GENI) grant from the Harvard School of Public Health; by a National Heart, Lung, and Blood institute Cardiovascular Epidemiology Training Grant in Behavior, the Environment, and Global Health (T32 HL098048); and by a National Institute of Diabetes and Digestive and Kidney Diseases Training Grant in Academic Nutrition (T32 DK007703).
-
Competing interests None.
-
Provenance and peer review Not commissioned; externally peer reviewed.
-
Data sharing statement Technical appendix available on request from corresponding author.