Article Text

Abstract
Objective To assess the impact of chronic kidney disease (CKD) and cardiovascular comorbidity on mortality in a multiethnic primary care population.
Design Retrospective cohort study.
Setting Inner-city primary care trust in West Midlands, UK.
Participants Individuals aged 40 years and older, of South Asian, black or white ethnicity, registered with a general practice and with their kidney function checked within the last 12 months (n=31 254).
Outcome measure All-cause mortality.
Results Reduced estimated glomerular filtration rate, higher albuminuria, older age, white ethnicity (vs South Asian or black ethnicity) and increasing cardiovascular comorbidities were independent determinants of a higher mortality risk. In the multivariate model including comorbidities and kidney function, the HR for mortality for South Asians was 0.697 (95% CI 0.56 to 0.868, p=0.001) and for blacks it was 0.533 (95% CI 0.403 to 0.704, p<0.001) compared to whites.
Conclusions The HR for death is lower for South Asian and black individuals compared to white individuals. This is, in part, independent of age, gender, socioeconomic status, kidney function and comorbidities. Risk of death is higher in individuals with CKD and with a higher cumulative cardiovascular comorbidity.
- EPIDEMIOLOGY
- PRIMARY CARE
This is an Open Access article distributed in accordance with the Creative Commons Attribution Non Commercial (CC BY-NC 3.0) license, which permits others to distribute, remix, adapt, build upon this work non-commercially, and license their derivative works on different terms, provided the original work is properly cited and the use is non-commercial. See: http://creativecommons.org/licenses/by-nc/3.0/
Statistics from Altmetric.com
Strengths and limitations of this study
-
Sample size with inclusion of many practices.
-
Ethnicity data self-reported and well recorded (>80%).
-
Individuals of white ethnicity relatively under-represented.
Introduction
Chronic kidney disease (CKD) is a risk factor for increased mortality,1 with an increased risk of death associated with declining excretory renal function and albuminuria.2–4 CKD prevalence and the risk imparted by CKD may vary by ethnicity; for example, some studies indicate that CKD is more common in people of white ethnicity,5 ,6 but non-white ethnic groups have a faster progression to end-stage kidney disease.7 ,8 Paradoxically, when treated with chronic dialysis treatment, people of non-white ethnicity have a lower mortality risk than people of white ethnicity.9 ,10 An increased risk of death is also associated with other comorbidities, including hypertension, diabetes and cardiovascular (CV) disease.11–16
While previous studies have indicated survival differences between ethnic groups,8 ,17–21 there has been limited reporting in these studies on the relative impact of comorbidities including kidney function on a population basis. This paucity of data reflects a shortfall in the availability of population-based primary care databases linked to estimated glomerular filtration rate (eGFR) and albuminuria reporting and traceable to mortality. Furthermore, there is minimal comparative data on people of South Asian ethnicity; comparative studies usually report data on Chinese-Asians.5
In the UK, there has been a systematic improvement in chronic disease recognition through a primary care pay for performance system, the Quality and outcomes framework (QOF).22 ,23 This system utilises chronic disease registers for the identification, monitoring and management of patients with known comorbidities; a component of this monitoring involves measuring and documenting renal function. These disease registers can be combined with laboratory results and linked with demographic and mortality data to better identify determinants of outcomes.
We have therefore utilised chronic disease registers to perform a retrospective cohort study of the relationship between CKD, CV comorbidity and mortality within a deprived, inner-city multiethnic population. Our study hypotheses were
-
There are differences in mortality between different ethnic groups.
-
These differences in mortality are explained by known risk factors including comorbidities, renal function, demographic and socioeconomic factors.
This study incorporated all stages of kidney function except stage 5 CKD (an eGFR below 15 mL/min/1.73 m2) in patients with known CV comorbidities and focused on three ethnic groups: South Asian (including individuals of Bangladeshi, Indian and Pakistani descent), black (individuals from, or who have ancestors from, Africa or the Caribbean) and white.
Methods
Ethics
The data were fully anonymised and were available as a component of an ongoing clinical development programme. The responsible National Health Service (NHS) R&D Consortium stated that this study did not require ethical submission to an NHS research ethics committee as it represented an evaluation of part of an ongoing primary care trust (PCT) programme. For PCT data extraction, the PCT professional executive committee and general practitioner (GP) locality leads provided approval for the programme, including evaluation and publication.
Cohort identification
The cohort was derived from Heart of Birmingham (Teaching) Primary Care Trust (HoB PCT), which had a registered population of 312 070 (September 2008). The majority of the population (62%) were non-white.24 Sixty-nine per cent of the population were below 40 years of age. Data were collected centrally, utilising software able to identify comorbidities through their classification on chronic disease registers (Enhanced Healthcare Services, Essex, UK). Complete sets of anonymised data were available for 63 of 73 general practices within HoB PCT, comprising a population of 285 221, and these were extracted from electronic downloads. Figure 1 illustrates the selection process for inclusion in the study.

Flow diagram indicating selection process for inclusion in the analyses (ACR, albumin : creatinine ratio; eGFR, estimated glomerular filtration rate; IDMS, isotope dilution mass spectrometry; GP, general practitioner; HoB, Heart of Birmingham).
The inclusion criteria comprised individuals aged 40 years and over who had kidney function testing performed within the previous 12 months as recommended by national guidelines.25 Data for the following variables were collected: age, gender, ethnicity, current smoking status, socioeconomic status (SES), eGFR and/or creatinine, urinary albumin : creatinine ratio (ACR) and vascular comorbidity (atrial fibrillation, CKD, diabetes mellitus, heart failure, hypertension, ischaemic heart disease and stroke) as defined by a relevant clinical (Read) code specified by the UK pay for performance (QOF) business rules.26 Ethnicity was self-reported, considered the ‘gold standard’ for classification.27
A standardised isotope dilution mass spectrometry (IDMS) MDRD eGFR28 was reported from one of three local biochemistry laboratories; however, eGFR reporting was not universally recorded on primary care systems in 2008 and if this was not available, the eGFR was calculated by utilising laboratory provided correction factors for the creatinine to generate IDMS-traceable MDRD eGFR. One general practice in the catchment area was excluded as IDMS-traceable creatinine was not available from a fourth laboratory that provided blood tests specifically for that catchment area.
SES was assessed using the Index of Multiple Deprivation29; this utilises the postcode from an individual's address to identify the lower layer super output area (LSOA) where the individual resides. Each of the 32 482 LSOAs in England are assigned a score and rank for the IMD 2007, with lower ranks corresponding to the most deprived areas. The IMD has been validated as superior to traditional deprivation indexes such as the Townsend score,30 due to its use of multiple domains reflective of socioeconomic deprivation.31 The IMD 2007 score incorporates seven areas of deprivation: income deprivation; employment deprivation; health deprivation and disability; education; skills and training deprivation; barriers to housing and services; living environment deprivation and crime. For the analyses presented, deprivation was divided into national quintiles, with the most deprived quintile as the reference population (ie, how mortality in less deprived quintiles compared to the most deprived quintile).
Mortality data were obtained from the Primary Care Mortality Database,32 a resource developed by The NHS Information Centre in partnership with the Office for National Statistics (ONS). Data obtained from ONS records are linked to the general practice where the individual was registered and therefore allow data to be extracted for specific general practices (ie, those within HoB PCT). Individuals included in this analysis were either still registered with an HoB PCT GP at the end of the follow-up period or had died while still registered at the practice. 9,907 (11.1%) individuals who had left, and therefore were no longer registered with their practices, were excluded from the analysis. The follow-up period was 23 months from May 2008 until February 2011.
Statistical analyses
All analyses were performed using PASW statistics 18 for Windows (IBM, Chicago, Illinois, USA).
Measurements for kidney function were divided into categories; eGFR into six categories (15–29, 30–44, 45–59, 60–89, 90–119 and ≥120 mL/min) with the eGFR range between 90 and 119 mL/min as the reference population. Individuals with an eGFR <15 mL/min were excluded from the analysis. ACR was divided into five categories (<1.1 mg/mmol ‘optimal’, 1.1–2.99 ‘high normal’, 3–29.99 ‘high’, 30–199.99 ‘very high’ and ≥200 ‘nephrotic’) in line with the KDIGO consensus conference.33
The relationship between age and mortality was not linear. Therefore, age was divided into six categories (50 years and under, 51–60, 61–70, 71–80, 81–90, greater than 90 years), with the youngest group serving as comparator.
Descriptive statistics are presented as mean with SD or median with IQR depending on distribution. Continuous variables were compared using analysis of variance (normal distribution) with post hoc Bonferroni analysis or Kruskal-Wallis (non-parametric distribution) tests. χ2Tests were used to compare categorical variables.
Cox regression survival analysis was used to evaluate the association of ethnicity and mortality, both before and after adjusting for covariates. Data are presented using survival plots, HRs with 95% CI and p values. Both univariate (unadjusted) and multivariate (adjusted) regression analyses are presented. The proportionality hazard assumption, assessed using log(−log(survival function)) plots, was met for all covariates.
The association between comorbidity, ethnicity and mortality was assessed by univariate analyses for all risk factors and then presented as three models. The choice of model variables was determined by the availability in the dataset of demographic and clinical risk factors consistent with those utilised by other investigators in previous work in similar populations,34 ,35 where the variable was available in our target population. Model 1 incorporates the number of identified vascular comorbidities (0–7), ethnicity, age, gender, smoking status and SES. Model 2 includes the eGFR level with removal of CKD from the comorbidity score (the possible scores are therefore 0–6) in order to avoid the association between declining renal function and the likelihood of being on the CKD register. Model 3 added ACR to the variables in model 2.
A complete case model was used in the analyses. All data were complete with the exception of ACR. Therefore, data were analysed for all individuals identified (unadjusted, models 1 and 2) and then repeated for individuals who had an ACR recorded (unadjusted and models 1–3). An ‘enter’ technique was used for the regression analysis.
Results
Complete cohort
At inception (May 2008), 31 254 individuals fulfilled the inclusion criteria for analysis. People of South Asian ethnicity formed the largest ethnic group (16 724, 53.4%), followed by people of white ethnicity (9146, 29.3%) and black ethnicity (5384, 17.2%). Baseline characteristics of the study population are shown in table 1. The age distribution differed between groups with South Asians significantly younger than the other two ethnic groups. There was no significant difference in gender between the three ethnic groups. Smoking was least common in the South Asian group. The majority of all three ethnic groups resided in the most deprived quintile, with a higher proportion of people of South Asian and black ethnicity in this quintile than people of white ethnicity.
Baseline characteristics by ethnicity: complete cohort
The number of vascular comorbidities was similar between groups, with 11–13% of each ethnic group having three or more comorbidities. Prevalence of different vascular comorbidities varied between groups: the white group had a lower reported prevalence of diabetes but a higher prevalence of CKD, atrial fibrillation, heart failure and stroke.
Median eGFR (corrected for ethnicity as appropriate) was 80.2 mL/min and was lowest in the white group (74.9 mL/min compared to 81.3 mL/min for South Asian individuals and 85.5 mL/min for those of black ethnicity; p<0.001). 21.5% of white, 13.8% of South Asian and 11.5% of black individuals had an eGFR between 15 and 59 mL/min, consistent with stages 3–4 CKD.
At the end of the study period, a higher proportion of white individuals had died (7.4%) compared to the two other ethnic groups (South Asian 3.2%, black 4%; p<0.001).
Albumin creatinine ratio cohort
An ACR cohort had been tested in 7022 (42%), 2275 (24.9%) and 1908 (20.9%) South Asian, black and white individuals, respectively. Table 2 lists the baseline characteristics for this subgroup. The median ACR was 1.1 mg/mmol and was highest in the South Asian group (1.2 compared to 1.0 mg/mmol for both white and black individuals; p<0.001). There were similar trends to the whole cohort for age distribution, eGFR, smoking status and deprivation.
Baseline characteristics by ethnicity: ACR-tested cohort
Those with an ACR tested were more likely to have a greater vascular comorbid burden (18–20% having three or more comorbidities). A higher proportion of individuals of South Asian descent, male gender and with diabetes had their ACR tested.
In concordance to the whole group analyses, deaths in the ACR cohort were highest among white individuals (7.8%) compared to the South Asian (3.6%) and black individuals (3.7%; p<0.001).
Univariate analysis
The univariate (unadjusted) analysis for the complete cohort (table 3a) demonstrated unadjusted HRs for death of 0.421 (95% CI 0.376 to 0.471, p<0.001) for people of South Asian ethnicity and 0.522 (95% CI 0.447 to 0.609, p<0.001) for people of black ethnicity compared to people of white ethnicity. The mortality rate increased exponentially with age and a higher HR was observed for male gender, current smokers and total number of comorbidities. No difference in mortality was found between deprivation quintiles. Using an eGFR of 90–119 mL/min as the reference, a J-shaped relationship was observed with a higher risk of death seen for higher and lower eGFR values. The HR for death increased progressively by stage of CKD with an eGFR<90 mL/min.
Cox proportional hazard regression analysis: univariate (unadjusted) analyses
The univariate analysis was repeated for those individuals who had their ACR reported (table 3b) with similar trends identified in the whole population analysis with the exception of no observed difference between individuals with an eGFR of ≥120 compared to 90–119 mL/min. A progressive increase in HR for death was seen with each increasing category for ACR.
Multivariate analysis
Following adjustment for covariates, the differences in ethnicity remained; people of South Asian and black ethnicities had a lower HR for death in all analyses.
Model 1 (complete cohort, incorporating the number of identified comorbidities, see online supplementary table I) analysed the complete cohort and showed an adjusted HR for death of 0.673 (95% CI 0.595 to 0.761, p<0.001) for people of South Asian ethnicity and 0.592 (95% CI 0.504 to 0.696, p<0.001) for people of black ethnicity compared to people of white ethnicity. When the analysis was restricted to the cohort with ACR tests available, the HR for death was 0.757 (95% CI 0.61 to 0.939, p=0.011) for people of South Asian ethnicity and 0.526 for people of black ethnicity (95% CI 0.4 to 0.692, p<0.001) compared to people of white ethnicity. For the complete cohort, mortality risk was lower in IMD quintiles 3 and 4 (compared to the most deprived quintile 5). No significant difference between IMD quintiles was identified in the ACR cohort. Increasing age (51 and over in the complete cohort, 61 and over in the ACR cohort), smoking status and male gender was significant in analyses for both cohorts. An increased HR for death was observed for two or more comorbidities, with the HR increasing as the number of comorbidities increased.
Kidney function (eGFR) was incorporated into model 2 (with the removal of CKD from the comorbidity score, see online supplementary table I), and in the complete cohort HR for people of South Asian ethnicity was 0.678 (95% CI 0.6 to 0.767, p<0.001) and for people of black ethnicity it was 0.614 (95% CI 0.522 to 0.722, p<0.001) compared to people of white ethnicity. Similarly, when the analysis was restricted to the cohort of patients with ACR tests available, people of South Asian and black ethnicity had a lower proportion of deaths compared to people of white ethnicity with HRs of 0.789 (95% CI 0.635 to 0.98, p=0.032) and 0.575 (95% CI 0.435 to 0.759, p<0.001), respectively. In the complete cohort, mortality risk was lower in the IMD quintile 4. More than two comorbidities were associated with an increasing HR and an increased HR of death compared to the reference eGFR range (90–119 mL/min) was seen with an eGFR ≥120 and ≥45 mL/min. An eGFR of 60–89 mL/min was associated with a lower HR. In the analysis of those with ACR tested, an eGFR <60 mL/min was associated with progressively higher HR by CKD stage.
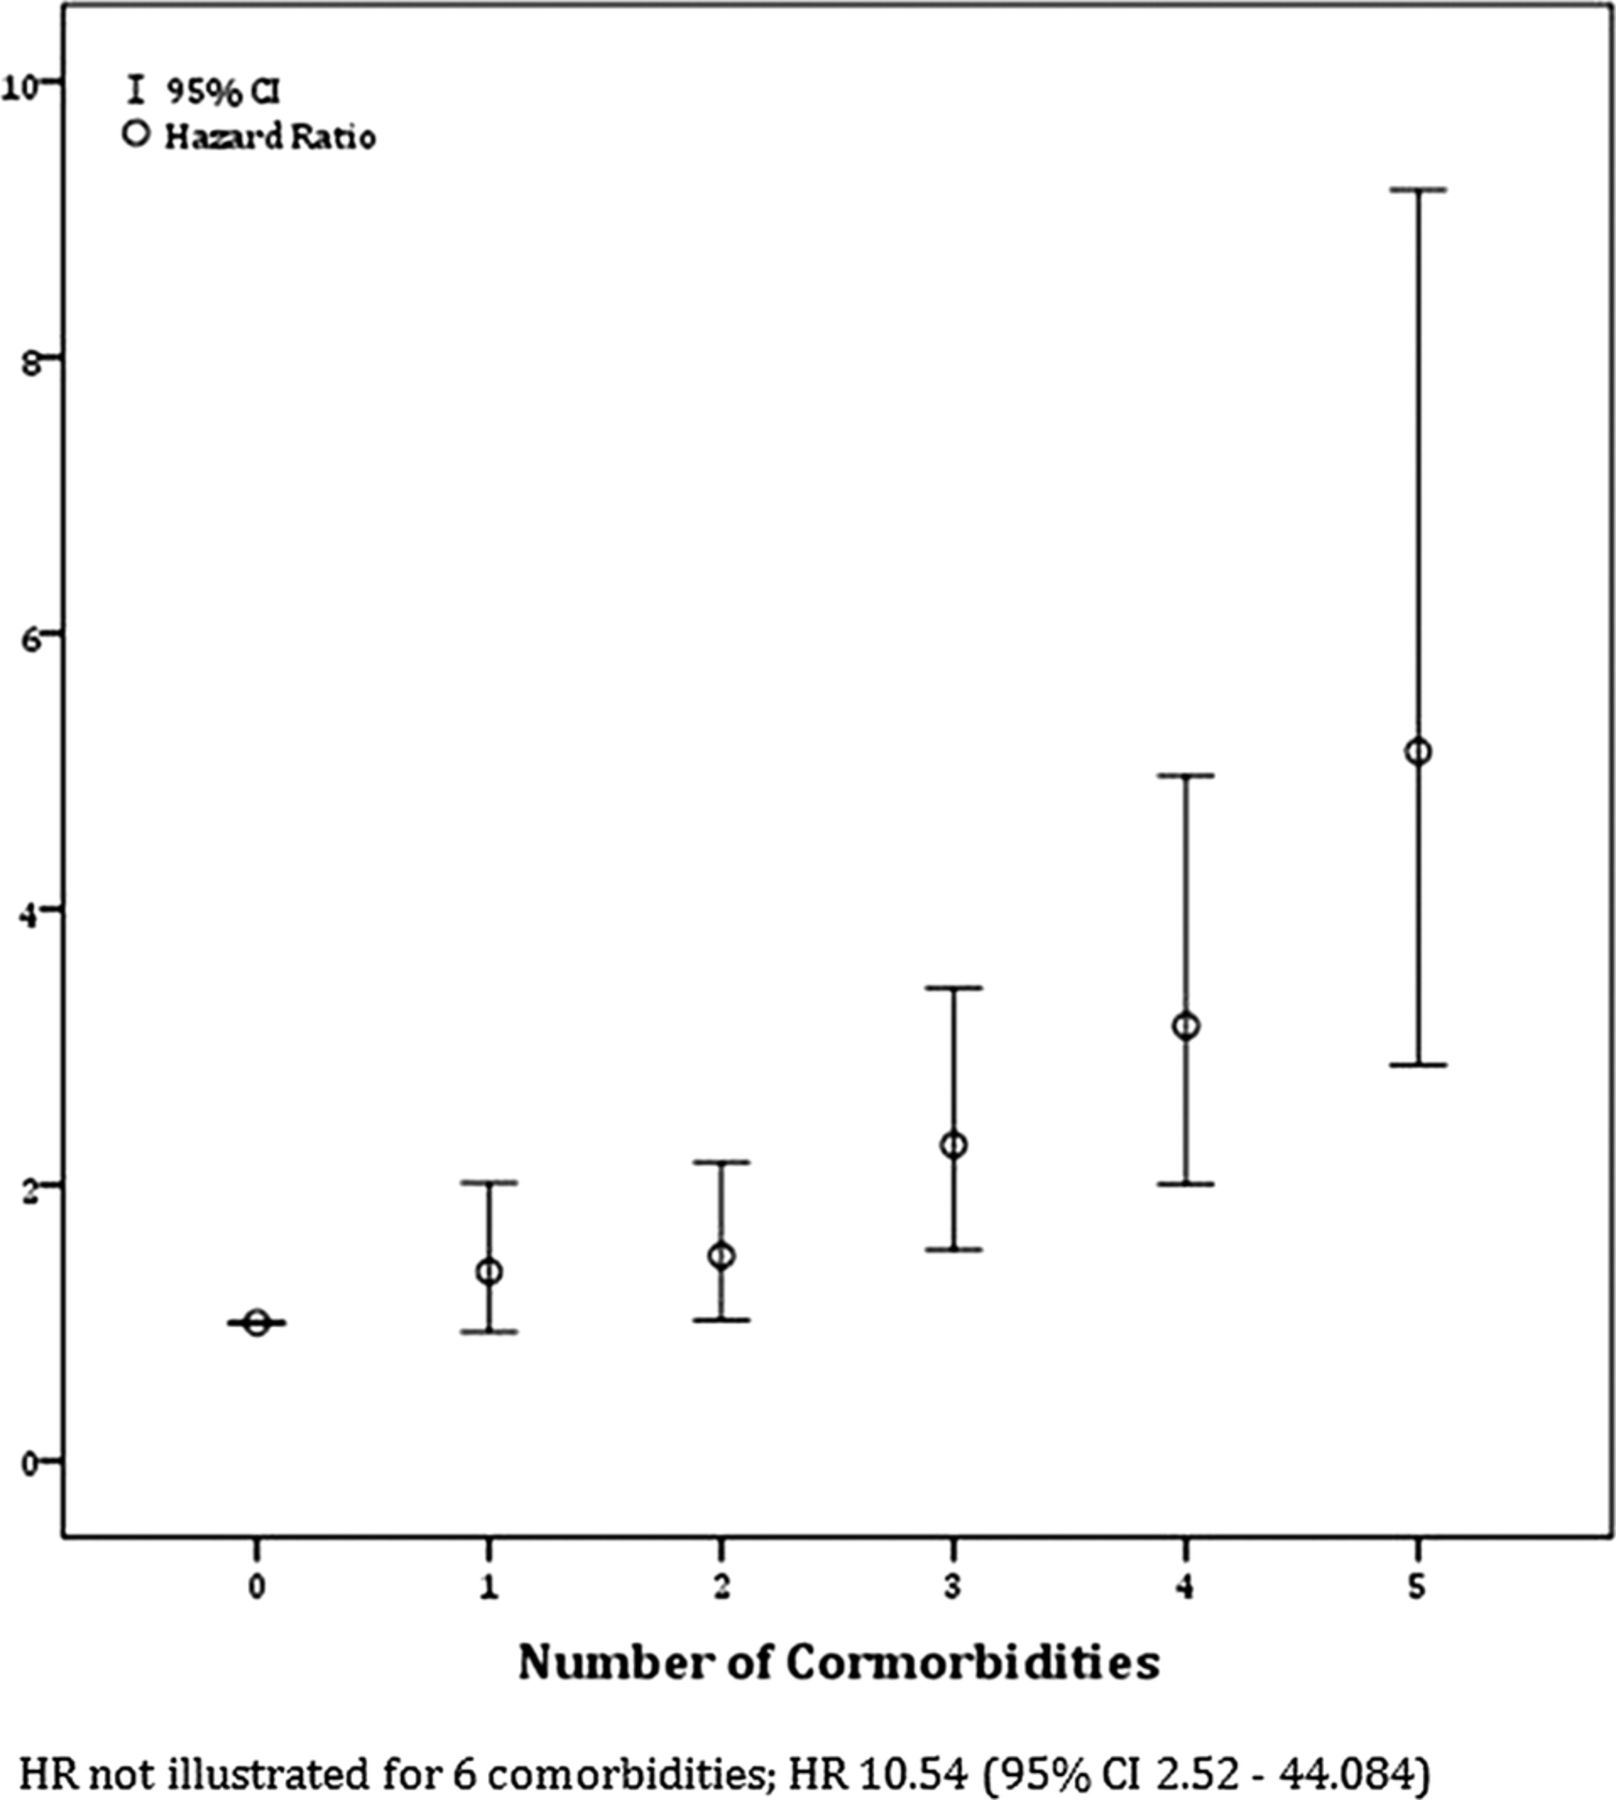
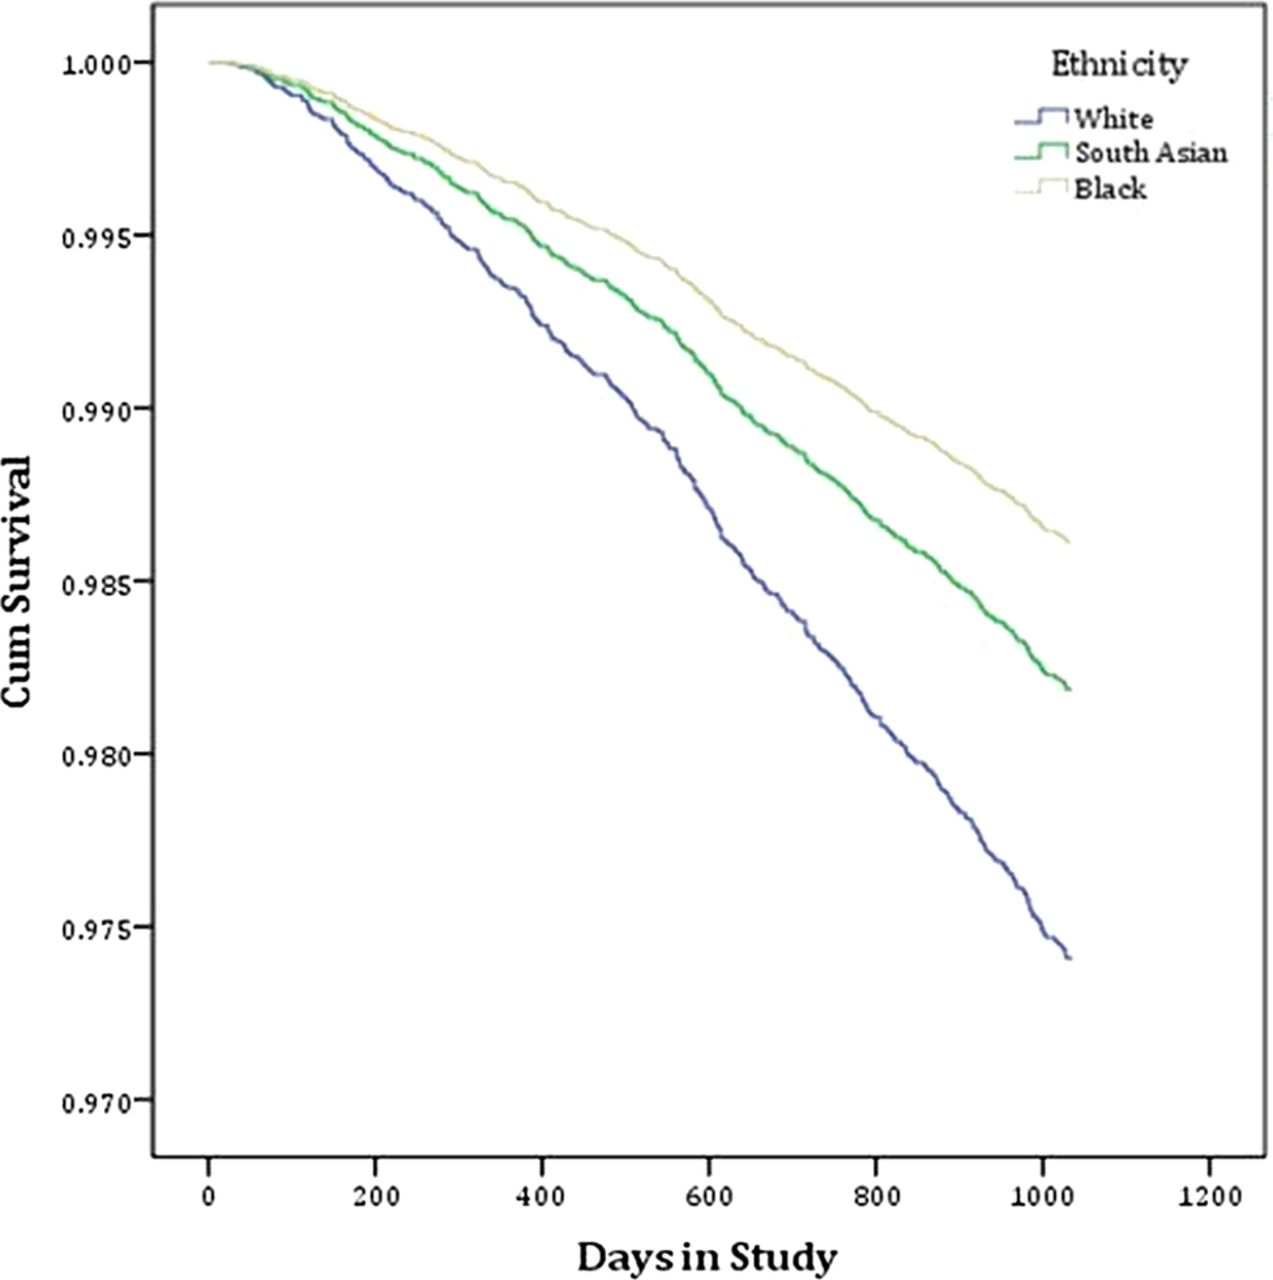
In model 3 (all vascular comorbidities except CKD and the addition of eGFR and ACR, table 4), the HR for death for people of South Asian ethnicity was 0.697 (95% CI 0.56 to 0.868, p=0.001) and for people of black ethnicity it was 0.533 (95% CI 0.403 to 0.704, p<0.001) compared to people of white ethnicity (figure 2). Older age, male gender, being a current smoker and increasing comorbidity (two or more) were associated with an increased HR of death (figure 3). An ACR of ‘high’ or greater (ie, ≥3.0 mg/mmol) and an eGFR <45 mL/min was also associated with an increased HR for death. No significant differences in HRs were observed between deprivation quintiles.
Cox proportional hazard regression analysis: multivariate (adjusted) analyses (model 3)

Cox regression survival plot indicating cumulative survival between ethnicities in model 3 (comorbidities, estimated glomerular filtration rate and albumin : creatinine ratio). Table below survival plot demonstrates the number of individuals who remained in follow-up at each time point.
HR for death by number of comorbidities. Multivariate (adjusted) analysis: model 3.
Discussion
This study utilised routinely available clinical and laboratory data, including kidney function assessed by eGFR and ACR, from a large primary care population. We included in the analysis detailed SES and, importantly, studied three ethnic groups, South Asian, black and white. Prior to this research, there has been uncertainty about the impact of ethnicity and SES on clinical outcomes in people with significant comorbidities including CKD. The comprehensive nature of the dataset coupled with the ability to utilise the Primary Care Mortality Database has allowed us to assess the relative impact of these factors on survival.
We found that previous associations between lower eGFR and higher ACR and increased mortality applied to this population. Furthermore, these associations remained significant when adjusted for ethnicity, age, gender, CV risk factors and SES. These results add weight to the risk stratification benefit of measuring ACR has in high-risk groups.
A strong cumulative impact of comorbidity on CKD and ethnicity was shown. Whereas traditional comorbidity scores such as the Charlson Comorbidity Index36 are difficult to calculate accurately in a large primary care setting, our study demonstrates that a simple cumulative score provides prognostic information. Individual comorbidities were present in varying frequencies within different ethnic groups, a finding consistent with that found in other ethnically diverse populations.37 While individual comorbidities were associated with different mortality risks, we found that the cumulative effect of comorbidities conveyed the greatest prognostic implication. A similar approach, but also including non-CV risk factors, has recently been described.38 Our study suggests that routinely collected clinical data concerning cumulative comorbidity may be utilised to quantify risk; however, further work would be required to validate this as a tool for use in clinical care.
SES was measured by the IMD 2007 score, a cumulative deprivation index score incorporating seven areas of deprivation which has been validated as superior to other deprivation scores.31 One notable finding is that we did not demonstrate any association between mortality when corrected for all other factors including comorbidity and ethnicity. This is not consistent with several other studies, which have shown that there is an independent relationship between SES and mortality across disease states and ethnic groups within the UK.39–42 This relationship varies by population group studied43 and there have been limited studies investigating health disparities in similar inner-city populations. While we studied a healthcare system that is free at the point of care, limiting possible health access issues, the majority of individuals were from the most deprived national quintile and our study may therefore underestimate the influence of the complete spectrum of SES on mortality. To attempt to correct for this, we reran the analyses dividing the cohort into equal quintiles. All analyses continued to indicate the effect of ethnicity and the importance of CV comorbidity and renal function. The univariate analysis (see online supplementary table II) and the most comprehensive multivariate analysis (model 3, see online supplementary table III) did not show any differences between the most and least deprived quintiles.
One of the seven areas included in the IMD is health deprivation, raising the possibility of an inbuilt relationship between deprivation and health even before analyses are undertaken. The possible implication of this was investigated by Adams and White44 who analysed data having removed the health domain from IMD 2004 and found that its removal had little practical effect. This suggests that the presence of the health domain is unlikely to influence our result.
We found that the risk of death was lower for people of South Asian and black ethnicity compared to people of white ethnicity, and this remained in all analyses (adjusted and unadjusted) performed. Previous studies comparing the outcomes of different ethnic groups have been limited in their generalisability. They have either looked at disease-specific mortality8 ,18 ,20 ,21 or have been based in populations that do not have access to free-comprehensive healthcare. The finding that differences in mortality risk between ethnic groups is independent of age, gender, SES, kidney function and comorbidities requires further work. Variables such as health promotion targeted at specific groups, differences in medication usage or factors related to genetic diversity may offer potential explanations for this variation.45 ,46
A major strength in this study is the sample size, which included 62 practices of varying list size and a number of practitioners. Ethnicity was documented in over 80% of the population studied; this is much higher than is normally found in primary care records.47 Self-reporting is considered the ‘gold standard’ method of assessing ethnicity,27 taking into account an individual's culture and self-identity. Renal function was described in terms of eGFR and ACR, the latter assuming increased prominence in the stratification of CV risk.
Our analyses have used data from primary care coding and recording systems, which formed part of the electronic downloads. These downloads indicate who is on a specific CV risk register and therefore may not classify people correctly. There is a relative paucity of published literature regarding the correct identification of people onto the correct risk registers.23 ,48–50 Surrogate measures of accuracy of the data include previous studies looking at gaming for QOF points (falsely classifying people with conditions they do not have, thereby increasing revenue) or exception reporting (excluding individuals who have not had the appropriate monitoring completed) suggesting that both these are rare.23 ,51 ,52
When comparing the breakdown of the population studied in these analyses with the source population, it is important to highlight two key differences. First, there is a relative underrepresentation of individuals of white ethnicity, consistent with previous research.53 This is most marked in those who had their ACR measured; a higher number of men and individuals with diabetes or of South Asian ethnicity had their ACR measured. Comparing the whole cohort to those who had their ACR reported showed similar trends for mortality in respect of age, eGFR, smoking status and SES, suggesting a generalisability of results. Second, one criterion for inclusion was the recording of renal function within the previous 12 months. This is likely to have resulted in an overrepresentation of comorbidity as people with CV conditions would be more likely to have their renal function checked. A further consideration is that the accuracy and applicability of creatinine-based eGFR equations, such as the formula used in this analysis, in non-white ethnic groups is a subject of ongoing research.54–56 Cystatin-based equations may be more accurate,57 but are not routinely measured in clinical practice.
In summary, we have shown that the determinants of mortality were multifactorial in a high-risk population and that ethnicity should be considered as a non-traditional risk factor for mortality; the HR for death was lower for South Asian and black individuals compared to white individuals, which was, in part, independent of age, gender, SES, renal function and comorbidities. Furthermore, a simple cumulative comorbidity system may have prognostic utility. Renal function (eGFR and ACR) provides additional information and gender, while age and smoking status remain significant risk factors for mortality.
References
Supplementary materials
Supplementary Data
This web only file has been produced by the BMJ Publishing Group from an electronic file supplied by the author(s) and has not been edited for content.
Files in this Data Supplement:
- Data supplement 1 - Online tables
Footnotes
-
Contributors MJ participated in the study design, data analysis and preparation of the manuscript. AL participated in the study design, data acquisition and analysis and review of the manuscript. ACFB participated in the study design, data acquisition and review of the manuscript. PC participated in the study design, data analysis, preparation and review of the manuscript.
-
Funding This research received no specific grant from any funding agency in the public, commercial or not-for-profit sectors.
-
Competing interests MJ has received funding from the JABBS Foundation. ACFB has advised and received honoraria from Enhanced Healthcare Services Ltd.
-
Ethics approval The data were fully anonymised and were available as a component of an ongoing clinical development programme. The responsible NHS R&D Consortium stated that this study did not require ethical submission to an NHS research ethics committee as it represented an evaluation of part of an ongoing primary care trust (PCT) programme. For PCT data extraction, the PCT professional executive committee and GP locality leads provided approval for the programme, including evaluation and publication.
-
Provenance and peer review Not commissioned; externally peer reviewed.
-
Data sharing statement No additional data are available.