Article Text

Abstract
Objective To assess the cost-effectiveness of a structured education pulmonary rehabilitation programme (SEPRP) for chronic obstructive pulmonary disease (COPD) relative to usual practice in primary care. The programme consisted of group-based sessions delivered jointly by practice nurses and physiotherapists over 8 weeks.
Design Cost-effectiveness and cost-utility analysis alongside a cluster randomised controlled trial.
Setting 32 general practices in Ireland.
Participants 350 adults with COPD, 69% of whom were moderately affected.
Interventions Intervention arm (n=178) received a 2 h group-based SEPRP session per week over 8 weeks delivered jointly by a practice nurse and physiotherapist at the practice surgery or nearby venue. The control arm (n=172) received the usual practice in primary care.
Main outcome measures Incremental costs, Chronic Respiratory Questionnaire (CRQ) scores, quality-adjusted life years (QALYs) gained estimated using the generic EQ5D instrument, and expected cost-effectiveness at 22 weeks trial follow-up.
Results The intervention was associated with an increase of €944 (95% CIs 489 to 1400) in mean healthcare cost and €261 (95% CIs 226 to 296) in mean patient cost. The intervention was associated with a mean improvement of 1.11 (95% CIs 0.35 to 1.87) in CRQ Total score and 0.002 (95% CIs −0.006 to 0.011) in QALYs gained. These translated into incremental cost-effectiveness ratios of €850 per unit increase in CRQ Total score and €472 000 per additional QALY gained. The probability of the intervention being cost-effective at respective threshold values of €5000, €15 000, €25 000, €35 000 and €45 000 was 0.980, 0.992, 0.994, 0.994 and 0.994 in the CRQ Total score analysis compared to 0.000, 0.001, 0.001, 0.003 and 0.007 in the QALYs gained analysis.
Conclusions While analysis suggests that SEPRP was cost-effective if society is willing to pay at least €850 per one-point increase in disease-specific CRQ, no evidence exists when effectiveness was measured in QALYS gained.
Trial Registration Current Controlled Trials ISRCTN52 403 063.
This is an Open Access article distributed in accordance with the Creative Commons Attribution Non Commercial (CC BY-NC 3.0) license, which permits others to distribute, remix, adapt, build upon this work non-commercially, and license their derivative works on different terms, provided the original work is properly cited and the use is non-commercial. See: http://creativecommons.org/licenses/by-nc/3.0/
Statistics from Altmetric.com
Strengths and limitations of this study
-
Strengths include the study design, the sample size and the range of resource, cost and economic patient level data collected for analysis.
-
The statistical analysis was conducted in accordance with current guidelines for clinical and cost effectiveness analysis alongside cluster trials; thereby accounting for both clustering and correlation in the cost and effect data.
-
Limitations include the time horizon of the analysis which was confined to the trial follow-up period, thereby reducing the ability to gauge the longer term effects of treatment.
Introduction
Pulmonary rehabilitation is a key strategy in the clinical management of chronic obstructive pulmonary disease (COPD) and has been shown to be effective in improving patients’ health-related quality of life.1–3 While much of the established evidence relates to programmes delivered in hospital, outpatient or home settings,2 ,4 there are growing calls for the provision of such services in the primary care setting.5 ,6 Nonetheless, further evidence on clinical and cost-effectiveness is required before primary care provision can be recommended. The PRINCE study sought to examine the clinical and cost-effectiveness of pulmonary rehabilitation for COPD delivered at the level of general practice in Ireland.7 To this end, the study evaluated a structured education pulmonary rehabilitation programme (SEPRP) intervention based on evidence collected alongside the cluster randomised controlled trial (RCT).7 The SEPRP consisted of a 2 hour group-based session each week for 8 weeks delivered jointly by practice nurses and physiotherapists and was compared in the trial to usual practice in primary care. The primary outcome in the clinical analysis was change in disease-specific health status from baseline to follow-up, as measured using the Chronic Respiratory Questionnaire (CRQ) instrument,8 with results indicating a significant improvement in health status for patients who received the intervention relative to the control of usual care.9
In addition to clinical effectiveness, any decision regarding the adoption of a healthcare intervention in clinical practice will depend on its expected cost-effectiveness.10 The technique of economic evaluation compares the relative cost-effectiveness of alternative treatment strategies by relating their mean differences in cost to their mean differences in effectiveness, and by quantifying the uncertainty surrounding these incremental point estimates. Central to this process is the selection of suitable outcome measures which enable the detection of clinically important treatment effects. In addition, and in order to more fully inform priority setting, generic outcome measures are preferable as they enable the comparison of a wide range of programmes across multiple patient populations, all of which may be competing for limited healthcare resources. Notably, however, recent evidence has cast doubt on the ability of generic outcome measures to adequately capture meaningful differences in clinical severity for COPD patient populations.11 Indeed, the adoption of generic rather than disease-specific measures in this context may lead to the underestimation of treatment benefits, biased cost-effectiveness results and ill-informed policy decisions.12 With this in mind, we present and compare the cost-effectiveness results for disease-specific health status, as measured by CRQ, and generic health status, as measured by quality adjusted life years (QALYs) gained.
Methods
The PRINCE cluster RCT
Full details of the study methods are published elsewhere.7 In brief, a cluster RCT recruited 32 general practices and 350 patients with a diagnosis of COPD as defined by the GOLD guidelines.1 Ethical approval was provided by the local ethics committees at the participating study centres. Practices were randomised to the control group, where patients (n=172) received usual care in general practice, or the intervention group, in which patients (n=178) received an SEPRP. The SEPRP consisted of an 8-week programme with a group 2 hour session each week delivered jointly by a practice nurse and physiotherapist at the practice surgery or nearby venue. The practice nurse facilitated the educational content of the programme and the physiotherapist focused on delivering the exercise component. The practice nurse also provided ongoing advice and support to participants as required throughout the intervention period. In addition, participants were followed up formally via telephone call at 4 weeks after completion of the SEPRP and via a 1 h group session at 10 weeks. To facilitate the delivery of the intervention, educators received training via specialised preparation programmes and ongoing support from the research team. To ensure standardisation of the programme content and delivery, all training was provided by research staff and educators were audited to ensure adherence to the programme principles and content. The control arm in this study was usual care in Irish general practice. However, pulmonary rehabilitation is not currently offered in a systematic manner in primary care in Ireland. A descriptive qualitative analysis revealed that usual care involves patients with COPD attending their general practitioner (GP) if they feel unwell and taking their prescribed medications.9 Indeed, the data we present for the control arm in relation to their healthcare services and medications usage go to highlight the nature of usual practice in the primary care setting.
Details on the characteristics of the study participants are presented in online supplementary appendix table S1 and were broadly similar across treatment arms.9 Two patients in the intervention group and six patients in the control group died over the course of the trial and are excluded from the analysis, leaving 342 (98%) for the statistical analysis.9 The primary outcome in the clinical analysis was change in disease-specific health status from baseline to follow-up, as measured using the CRQ.8 At the trial follow-up, the intervention was associated with statistically significant improvements in CRQ Dyspnoea scores (0.49; 95% CIs 0.20 to 0.78), CRQ Physical scores (0.37; 95% CIs 0.14 to 0.60) and CRQ Total score (1.11; 95% CIs 0.35 to 1.87) relative to the control.9 There were concerns, however, that the CIs did not exclude differences in effect that were prespecified as clinically insignificant.9
Economic evaluation
The economic evaluation consisted of a trial-based analysis with a time horizon of 22 weeks, the trial follow-up period. The perspective of the healthcare provider was adopted with respect to costing and health outcomes were expressed in terms of disease-specific and generic health status. Data are also presented for private patient expenses. Evidence on resource use and health status, specifically CRQ and EQ5D, was collected via structured questionnaires and practice note searches at baseline (for the 26 weeks prerandomisation) and follow-up (at 22 weeks postrandomisation). Given the length of follow-up, neither costs nor outcomes were discounted. The statistical analysis was conducted on an intention-to–treat basis and in accordance with current guidelines for clinical and cost-effectiveness analysis alongside cluster RCTs.13 ,14 That is, we adopt statistical techniques which recognise the clustering and correlation of cost and effect data. The incremental analyses were undertaken using generalised estimating equations (GEE), a flexible multivariate regression framework that explicitly allows for the modelling of normal and non-normal distributional forms of clustered data.15 Uncertainty in the analysis was addressed by estimating 95% CIs and cost-effectiveness acceptability curves, which link the probability of a treatment being cost-effective to a range of potential threshold values (λ) that the health system may be willing to pay for an additional unit of effect.10 In addition, sensitivity analysis was undertaken to examine the effect of conducting a complete case only analysis and of varying the cost of delivering the intervention in practice. All analysis was undertaken using STATA and EXCEL statistical packages.
Cost analysis
Three cost components were included in the analysis, all of which were expressed in Euros (€) in 2009 prices. The first was the cost of implementing the intervention in clinical practice and included resources relating to: educator and patient recruitment; educator, administrator and patient time input; venue and equipment rental; educational materials and consumables; and post, packaging, telephone and travel expenses (see online supplementary appendix table S2).These costs were allocated to all 178 patients who participated in the SEPRP intervention. In sensitivity analysis, we explore the effect of expanding the number of patients per SEPRP session from an average of 11 to 15, or 240 in total, and 20 or 320 in total, respectively; thereby reducing the intervention cost per patient.
Second, costs relating to the use of primary and secondary healthcare services over the course of the trial were estimated. This included the costs of GP, practice nurse, physiotherapist, dietician, public health nurse, home help and social worker consultations, outpatient services, accident and emergency (A&E) visits, hospital admissions, COPD medications and oxygen therapy. Third, private costs to patients, in terms of time input and travel expenses over the course of the trial, were included.
Resource use was captured via a combination of electronic chart searches and patient questionnaires conducted by research staff at baseline and follow-up. A vector of unit costs was applied to calculate the cost associated with each resource activity at baseline and follow-up (see table 1). Unit cost estimates for each activity were based on national data sources and, where necessary, were transformed to Euros (€) in 2009 prices using appropriate indices.16 ,17 In particular, unit costs per consultation were obtained from published health service documents while drugs were costed using the monthly index of medical specialties for Ireland. Two total cost variables were constructed for the incremental analysis (1) total healthcare cost and (2) total patient cost. To facilitate this process, imputation, conditional on age, gender and treatment arm, was undertaken to estimate missing values for individual resource use at follow-up. Imputation for resource use was undertaken using the uvis command in STATA V.11, based on a single imputed dataset, and assuming a non-normal distribution for each dependent variable. While the amount of missing data was very low, we adopted this approach to ensure a more complete analysis. Estimation of incremental costs at follow-up was undertaken using GEE regression models controlling for treatment arm, baseline cost and clustering. To account for the non-normal nature of the cost data, multilevel regression models assuming a γ variance function were estimated.18
Categories of resource use and unit cost estimates in 2009 (€) prices
Effectiveness analysis
Health outcomes in the analysis were expressed in terms of disease-specific and generic measures of health status. COPD-specific health status was measured using the CRQ instrument,8 which consists of 20 items which are subdivided into four domains: dyspnoea, fatigue, emotional function and mastery. The self-administered version of the CRQ with an individualised dyspnoea domain was used. Individuals were asked to rate each item on a seven-point scale from 1 (maximum impairment) to 7 (no impairment). Each domain is scored as the sum of the individual items.8 Based on the patient responses, three CRQ aggregate scores can be calculated: (1) CRQ Physical score, which is an aggregate of the dyspnoea and fatigue domains; (2) CRQ Psychological, which is an aggregate of the emotional function and mastery domains and (3) CRQ Total, which is an aggregate of all four domains.8 For the purposes of the economic evaluation, only the CRQ Total score variable was included in the incremental cost-effectiveness analysis.
Generic health status was expressed in terms of QALYs gained, calculated on the basis of patient responses to the EuroQol EQ5D 3 L instrument.19 ,20 The EQ5D consists of five dimensions: mobility, self-care, usual activities, pain or discomfort and anxiety or depression; and each dimension has three levels of severity: no problems, moderate problems or extreme problems. EQ5D responses are transformed using an algorithm into a single health state index score, based on values elicited via the time trade-off approach for the UK population,21 ,22 which typically range from 0 (equivalent to death) to 1 (equivalent to good health), although a small number of health states are valued as worse than death. EQ5D scores at baseline and follow-up were used to calculate patient-specific QALYs gained over 22 weeks using the area under the curve method.23 Once again, to facilitate this process, imputation, conditional on age, gender and treatment arm, was undertaken to estimate missing values at follow-up. Imputation was undertaken using the uvis command in STATA V.11 and based on a single imputed dataset. Estimation of incremental effectiveness at follow-up was undertaken using GEE regression models, assuming a Gaussian variance function and controlling for treatment arm, baseline EQ5D score and clustering.
Cost effectiveness analysis
To undertake the cost-effectiveness analysis, we adopt techniques which recognise the clustering and correlation of cost and effect data collected alongside cluster RCTs. In economic evaluation, one treatment is defined as more cost-effective than its comparator if one of the following conditions apply: (1) it is less costly and more effective; (2) it is more costly and more effective, but its additional cost per additional unit of effect, known as the incremental cost-effectiveness ratio (ICER), is considered worth paying by decision-makers; or (3) it is less costly and less effective, but the additional cost per additional unit of effect of its comparator is not considered worth paying by decision-makers.10 We employ the net benefit framework,24 which allows for costs and effectiveness, and their correlation, to be combined into a single variable for each individual, to identify which of these three conditions applies in this case.
We define net benefit (nb) as,
where eijk is the health outcome for the ith person in the jth cluster in treatment arm k, λ is the cost-effectiveness threshold value, and cijk is their cost. Using this framework, the intervention is defined to be cost-effective at a given threshold value, λ, if its corresponding net benefit is greater than that of the control: that is, if the incremental net benefit for the intervention minus control is greater than 0.
The net benefit statistics for CRQ Total score and QALYs gained were calculated by relating total healthcare costs to the outcome measures of interest for a series of threshold values (ranging from λ=€0 to €70 000). Imputation, conditional on age, gender and treatment arm, was undertaken to estimate the missing CRQ values at follow-up. Estimation of incremental net benefit was undertaken using GEE regression models, assuming a Gaussian variance function, and controlling for treatment arm, baseline CRQ or EQ5D score, baseline healthcare cost and clustering. The incremental cost-effectiveness results are presented using ICERs and cost-effectiveness acceptability curves, which were estimated parametrically,24 and report the probability that the intervention is more cost-effective than the control. The curves incorporate the sampling uncertainty around the ICER estimates as well as the uncertainty around the true threshold value, λ,25 which is not explicitly known for Ireland.26
Results
Raw data estimates for resource use, costs and health outcomes at follow-up are summarised in table 2 (for the equivalent baseline results, see online supplementary appendix table S3). Information on missing data is presented in the table footnotes. The cost of the intervention was estimated at €822 per participant, which consisted of €564 in healthcare costs and €258 in patient costs (see online supplementary appendix table S2). Individual resource costs were combined to calculate total costs of care and are presented in table 3. In terms of total costs over 22 weeks of follow-up, the mean unadjusted healthcare cost per patient was €1505 (SD 1872) in the control arm and €2357 (SD 3532) in the intervention arm. The equivalent results for unadjusted total patient cost over 22 weeks of follow-up were €129 (SD 113) and €380 (SD 111), respectively.
Raw data estimates at Follow-up for resource use and costs (both estimated for the 22 weeks following randomisation) and health outcomes
Incremental cost effectiveness results
In terms of disease-specific health status, the mean unadjusted CRQ Total score per patient at 22 weeks of follow-up was 19.10 (SD 4.83) in the control arm and 20.82 (SD 3.88) in the intervention arm (see table 3). Further results for CRQ domain scores are presented in table 2 and in Casey et al9 In terms of generic health status, the mean unadjusted QALYs gained per patient at 22 weeks was 0.305 (SD 0.106) in the control arm and 0.337 (SD 0.081) in the intervention arm (see table 3).
The results from the incremental analyses are also presented in table 3. These indicate that the intervention was, on average, associated with higher costs and improved health outcomes, as measured using the CRQ and QALYs, when compared to the control. The intervention was estimated to result in a statistically significant increase in mean cost per patient of €944 (95% CIs 489 to 1400) in total healthcare costs and €261 (95% CIs 226 to 296) in total patient costs. Both estimates were adjusted to account for differences in baseline costs across groups. In respect of effectiveness, the intervention was associated with a statistically significant increase in the mean CRQ Total score of 1.11 (95% CIs 0.35 to 1.87) per patient and a non-significant increase in the mean QALYs gained of 0.002 (95% CIs −0.006 to 0.011) per patient. Similarly, both estimates were adjusted to account for baseline differences across groups.
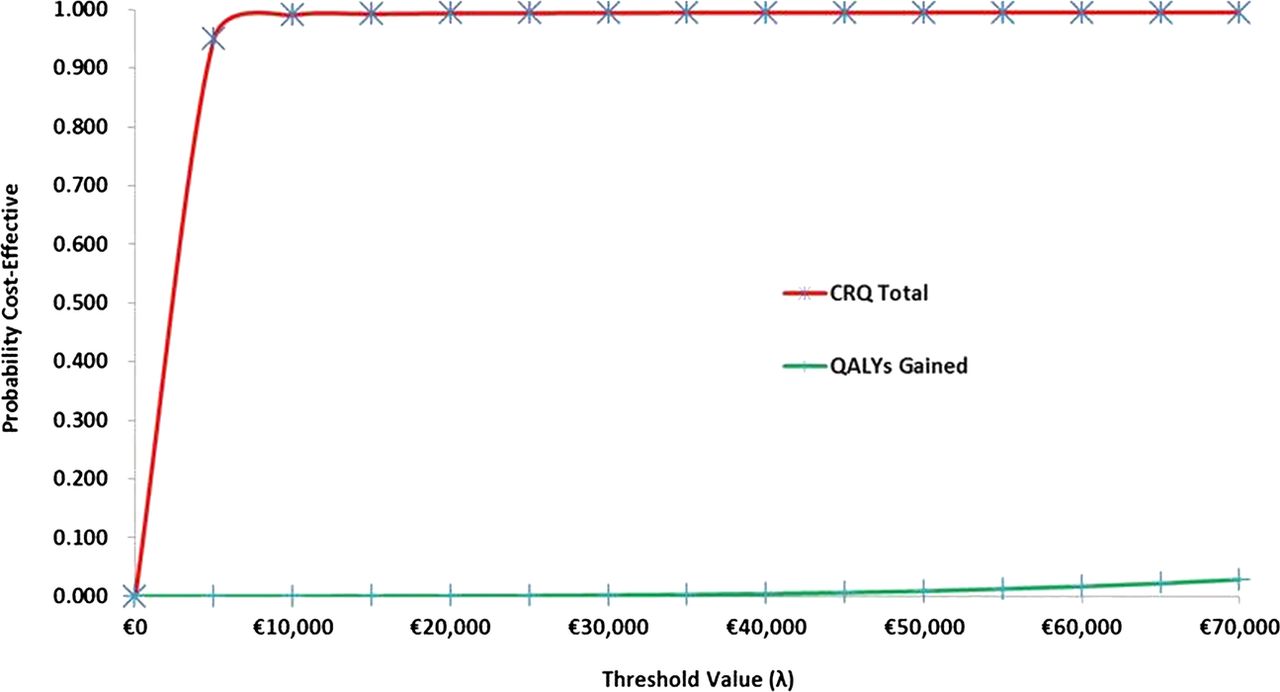
These results translated into incremental cost-effectiveness ratios of €850 per unit increase in the CRQ Total score and €472 000 per additional QALY gained. In terms of the expected cost-effectiveness, the probabilistic results are summarised in table 3 and presented graphically in figure 1 in the Appendix. These indicate that, for the CRQ Total score analysis, the probability of the intervention being more cost-effective than the control was 0.980, 0.992, 0.994, 0.994 and 0.994 at threshold values of €5000, €15 000, €25 000, €35 000 and €45 000, respectively. For the QALYs gained analysis, the equivalent probability estimates were 0.000, 0.001, 0.001, 0.003 and 0.007, respectively. The results from the sensitivity analysis are presented in the appendix and generally conform to the expected cost-effectiveness results reported for the primary analysis.
Discussion
On the basis of the evidence collected alongside a cluster RCT, a structured education pulmonary rehabilitation programme for COPD delivered in primary care was, on average, more costly and more effective than the usual general practice care. Notably, however, while the intervention was associated with statistically significant improvements in disease-specific health status, this was not reflected in generic health status. Moreover, the CIs for the disease-specific analysis included differences in effect that were deemed clinically insignificant.9 Given the uncertainty relating to the effectiveness data, there is unsurprisingly conflicting evidence regarding the value for money of the programme. While the cost-effectiveness evidence suggests that the programme may be cost-effective when outcomes are measured in terms of disease-specific health status and if society is willing to pay at least €850 per one-point increase in CRQ, no such evidence exists in relation to generic health status. More specifically, in the cost per CRQ Total score analysis, the probability that the intervention was more cost-effective than usual care was 0.980 or greater for a range of potential threshold values, notwithstanding concerns relating to clinical insignificance. In stark contrast, the cost per QALY-gained analysis indicates that the intervention is highly unlikely to be deemed cost-effective relative to usual care or, indeed, other programmes inside and outside of COPD medicine.
The ceiling ratios per QALY gained presented provide a useful range for comparison, given the lack of implicit or explicit values for Ireland and the current weak evidence base with respect to this type of health economic analysis for Ireland. However, the approach of applying the same ceiling rates per unit increase in CRQ is problematic as these values may, or may not, be much lower than those presented. The range of ceiling ratios presented may be too high for CRQ in particular, and it might have been more useful, if somewhat more cumbersome, to present a different range of ceiling ratios for each of the two outcomes. For example, the shape of the cost effectiveness acceptability curve for CRQ is likely to be different if additional points between €0 and €5000 were evaluated. Indeed, the probability of the intervention being more cost-effective than the control was 0.087, 0.571, 0.900 and 0.995 at threshold values of €500, €1000, €2000 and €4000, respectively. The difficulty is that, in the absence of evidence in regard to the appropriate range of ceiling ratios, any decision will appear arbitrary and be open to criticism. As usual, it will ultimately be the responsibility of the relevant decision-maker to determine whether the evidence presented is sufficient to justify the adoption of the SEPRP intervention in clinical practice. What is clear is that there were improvements in CRQ after adjusting for differences in baseline values between the intervention and control groups.
This study highlights the complexity of resource allocation decision-making in this context as variations in estimated incremental effectiveness have markedly different implications for policy depending on the specificity of the outcome. Indeed, the central question is whether our findings reflect an absence of a clinically significant treatment effect or, alternatively, a lack of sensitivity in the ability of the generic EQ5D instrument to detect a clinically meaningful improvement in COPD health status. In the case of the former, it is worth noting that, in contrast to the majority of trials included in a Cochrane systematic review,2 most of the participants in our study had moderate COPD (FEV1 around 55–60% predicted).9 This is not surprising given that the target COPD population in a primary care setting is, by definition, likely to be less severely affected than hospital-based populations. Overall, our results highlight the need for a better understanding of the relationship between COPD disease-specific and generic outcome measures, the importance of exploring cost-effectiveness in terms of disease-specific and generic health status for this patient population, as well as the need to consider both measures in the resource allocation decision-making process. Indeed, our findings can be added to those of existing studies which explore how the adoption of generic rather than disease-specific measures in this context may lead to the underestimation of treatment benefits, biased cost-effectiveness results and ill-informed policy decisions.11 ,12 Moreover, this study highlights the difficulty of identifying an appropriate ceiling ratio and drawing conclusions based on ICERs using non-preference-based measures.
That said, our study adds to the existing literature on the cost-effectiveness of pulmonary rehabilitation for COPD by evaluating a programme delivered on primary care. There is a broad literature showing that such programmes are cost-effective in various hospital, outpatient and home settings.27–,35 Moreover, it also adds to the growing evidence of cost-effectiveness gains from rehabilitation and self-management programmes delivered in primary care settings for other diseases such as diabetes36 ,37 and heart disease.38 Keeping people out of hospital has been shown to be the key driver in lowering costs in the majority of these studies. Moreover, those studies which have reported cost savings generally adopted time horizons for analysis of 1 year or more, while we were restricted to a follow-up of only 22 weeks. The short-time horizon for our study is therefore a significant weakness to exploring the sustainability of the intervention. Extending the time horizon would most likely improve the cost-effectiveness of the intervention, linked to lower hospital admissions, if the evidence of other studies can be used as a guide to future resource use in Ireland. It should also be noted that the use of 2009 prices in the analysis may have inflated costs. Medical inflation in the period since would most likely contribute to an improvement in the cost-effectiveness results in the future.
A few other points should be noted as having potential effects on the results of this study. Participants were randomised to control and intervention following the collection of baseline data and the demographic data indicated that both groups were well matched.9 However, there was no feasible way to blind the intervention group to participants or to those facilitating the programme and the study is open to a risk of performance bias. Nevertheless, outcome assessment was blinded, thus minimising risks to detection bias. In addition, patients with very severe COPD were excluded due to concerns for their safety and health risks.7 This is not unusual for trials, in which obtaining a homogeneous sample is prioritised, although it does raise concerns as to the generalisability of the findings presented. From an equity perspective, the programme was delivered free at the point of use to all participants, ensuring that no one was excluded on the basis of inability to pay. Importantly, patients who died over the course of the trial were excluded from the statistical analysis. This was a pragmatic decision by study researchers on the basis of the trial follow-up being limited to 22 weeks and the need to explicitly avoid ascribing differences across groups to the alternative treatments. While this may introduce bias, we do not believe that it would fundamentally alter the results as presented.
The conduct of economic evaluation in Ireland is complicated by a paucity of relevant data. In particular, given the lack of utility data, the EQ5D scoring algorithm was adopted and assumed to be relevant for an Irish population. This may not be the case. The process of conducting cost analysis in Ireland is also compromised by the lack of nationally available unit cost data. In estimating unit costs for individual resource activities, we endeavoured at all times to be conservative in any assumptions adopted. Furthermore, while we employ an appropriate multilevel net benefit regression approach to account for the correlation and clustering in the cost and effect data, arguments could be made for alternative bivariate or non-parametric approaches.14 Moreover, while imputation was deemed necessary for the analysis, the approach adopted may be criticised as we imputed values for costs and effects independently. Finally, our analysis is limited by the fact that it is based mainly on data collected using a single trial. While this was deemed sufficient to consider the research question from an Irish perspective, our results would need to be analysed in combination with other international studies to more robustly explore the cost-effectiveness of pulmonary rehabilitation for COPD in primary care.
In conclusion, the evidence is contradictory in regard to the cost-effectiveness of a structured education programme for COPD delivered in primary care in Ireland. While there appears to be evidence in support of the programme if society is willing to pay at least €850 per one-point increase in disease-specific COPD health status, there is no such evidence in relation to generic health status as measured by QALYs. As a result, uncertainty surrounds the policy implications of this analysis. Nonetheless, the study confirms the importance of calculating incremental cost-effectiveness results for the disease-specific and generic outcome measures for patient with COPD populations.
Acknowledgments
The authors would like to thank the people with COPD who chose to join this study, the practice nurses and physiotherapists for enthusiastically taking on the role of providing the SEPRP and the general practitioners for supporting the study. They would like to thank Joan Kavanagh, Eimear Burke, Denise Healy, Eiginta Vitienne Jill Murphy, Roisin Ui Chiardha, Stella Kennedy and Caoimhe Ui Chiardha. They would also like to acknowledge the assistance and advice provided by the members of the Steering and Advisory Groups for their continued support and guidance. Finally, the authors would like to thank the Health Research Board of Ireland and Pfizer who provided unconditional funding for the study.
Appendix

Cost-effectiveness acceptability curves.
References
Supplementary materials
Supplementary Data
This web only file has been produced by the BMJ Publishing Group from an electronic file supplied by the author(s) and has not been edited for content.
Files in this Data Supplement:
- Data supplement 1 - Online supplement
- Data supplement 2 - Online appendix
Footnotes
-
Contributors KM, DC, DD, BMC, AC, LM and CK conceived the study and, together with JN and EO, participated in the design of the trial and intervention. PG and EO undertook the acquisition, analysis and interpretation of the health economic data and the drafting of the research article. All authors participated in a critical revision of the manuscript and have approved the final version.
-
Funding This project was funded by the Health Research Board of Ireland (grant number NMRPS/07/01) and by an unconditional educational grant from Pfizer.
-
Patient consent Obtained.
-
Ethical approval Ethical approval has been granted by the Research Ethics Committee of the National University of Ireland, Galway and the Irish College of General Practitioners (ICGP).
-
Provenance and peer review Not commissioned; externally peer reviewed.
-
Data sharing No additional data are available.