Article Text

Abstract
Objective In 2001, Thailand implemented the Universal Coverage Scheme (UCS), a public insurance system that aimed to achieve universal access to healthcare, including essential medicines, and to influence primary care centres and hospitals to use resources efficiently, via capitated payment for outpatient services and other payment policies for inpatient care. Our objective was to evaluate the impact of the UCS on utilisation of medicines in Thailand for three non-communicable diseases: cancer, cardiovascular disease and diabetes.
Design Interrupted time-series design, with a non-equivalent comparison group.
Setting Thailand, 1998–2006.
Data Quarterly purchases of medicines from hospital and retail pharmacies collected by IMS Health between 1998 and 2006.
Intervention UCS implementation, April–October 2001.
Outcome measures Total pharmaceutical sales volume and percent market share by licensing status and National Essential Medicine List status.
Results The UCS was associated with long-term increases in sales of medicines for conditions that are typically treated in outpatient primary care settings, such as diabetes, high cholesterol and high blood pressure, but not for medicines for diseases that are typically treated in secondary or tertiary care settings, such as heart failure, arrhythmias and cancer. Although the majority of increases in sales were for essential medicines, there were also postpolicy increases in sales of non-essential medicines. Immediately following the reform, there was a significant shift in hospital sector market share by licensing status for most classes of medicines. Government-produced products often replaced branded generic or generic competitors.
Conclusions Our results suggest that expanding health insurance coverage with a medicine benefit to the entire Thai population increased access to medicines in primary care. However, our study also suggests that the UCS may have had potentially undesirable effects. Evaluations of the long-term impacts of universal health coverage on medicine utilisation are urgently needed.
- Essential Medicines
- Cardiology
- Diabetes & Endocrinology
- Oncology
This is an open-access article distributed under the terms of the Creative Commons Attribution Non-commercial License, which permits use, distribution, and reproduction in any medium, provided the original work is properly cited, the use is non commercial and is otherwise in compliance with the license. See: http://creativecommons.org/licenses/by-nc/2.0/ and http://creativecommons.org/licenses/by-nc/2.0/legalcode.
Statistics from Altmetric.com
Article summary
Article focus
-
Medicines present a key challenge to achieving universal coverage.
-
Health insurance systems have the potential to improve cost-effective use of medicines, yet there is little evidence about their impact on medicine use in low-income and middle-income countries.
-
The rapid implementation of universal health coverage in Thailand presents a unique opportunity to measure the impact of health insurance expansion and capitated payment on utilisation of medicines.
Key messages
-
Expanding health insurance coverage with a medicines benefit to the entire Thai population increased access to medicines in primary care.
-
The universal coverage scheme did not seem to have increased use of medicines for diseases that are typically treated in secondary or tertiary care settings, or increased generic market penetration.
-
In the future, it will be important for countries to assess quality and equity of medicines use as they pursue policies to achieve universal coverage.
Strengths and limitations of this study
-
We used an interrupted time-series design, the strongest quasi-experimental approach for evaluating the effects of interventions, increasing internal validity.
-
It is impossible to examine population subgroups in national IMS Health market data, but we are reasonably confident that universal coverage scheme enrolees are responsible for observed changes.
Introduction
Universal health coverage
In 2005, member states of the World Health Organization (WHO) made a commitment to work towards universal healthcare coverage.1 The 2010 WHO World Health Report provides a roadmap for countries to achieve this goal.2 Universal coverage requires the restructuring of healthcare and financing systems to improve access to healthcare services, reduce financial hardship and increase the efficiency and equity of the health system.2
Medicines, which consume 25–65% of total public and private spending on health in developing countries,3 present a key challenge to achieving universal coverage. The high spending on medicines, and inefficient use of them, threaten the financial sustainability of a universal coverage scheme. According to the WHO, 3 of the top 10 sources of healthcare inefficiency involve medicines: high medicine prices and underuse of generics; use of substandard and counterfeit medicines; and inappropriate and ineffective use of medicines.2 Health insurance systems have several features (eg, a defined population, access to utilisation data and financial leverage) that give them a unique advantage to reduce out-of-pocket (OOP) expenditures and improve the costeffective use of medicines through active management strategies involving medicine selection, purchasing, contracting (eg, physician payment) and utilisation management.4 However, there is little evidence about the impact of health insurance on access to and use of medicines in the low-income and middle-income countries (LMICs).4
The recent implementation of universal health coverage in Thailand presents a unique opportunity to measure the impact of health insurance expansion and hospital payment changes (the majority of the population is now covered under a closed-ended payment scheme5) on utilisation of medicines.
Universal health coverage in Thailand
With the implementation of the Universal Coverage Scheme (UCS) in 2001, Thailand became one of the first LMICs to achieve universal coverage.6 ,7 The reform preserved the formal sector workforce schemes: the Social Security Scheme (SSS) for private sector employees (7.2% of the total population in 2001) and the Civil Service Medical Benefit Scheme (CSMBS) for government employees and their dependents (8.5%).8 The UCS covered those previously enrolled in a voluntary health card scheme (20.8%), in private health insurance (2.1%), or in a tax-based, means-tested Low Income Scheme for the poor, elderly, children and disabled (32.4%)8 ,9 as well as more than one-quarter (29.0%) of the population without previous insurance.8 The UCS was rolled out to all provinces between April and October 2001.6 By 2004, 95.5% of the population was insured, with three-quarters (75.2%) of the population covered by the UCS.6
In addition to coverage expansion, the reform also dramatically altered the mechanism for hospital payment. Before the reform, hospitals were accustomed to fee-for-service (FFS) payments from most insurance schemes, aside from SSS, and the uninsured, who paid OOP per service (ie, user fees).10 The majority of user fee spending was on medicines.11 After the reform, FFS payment only applied to CSMBS patients and for the majority of patients, now UCS enrolees, hospitals were paid on a closed-ended basis5 for all covered services, including medicines.
The UCS is a compulsory, tax-financed scheme with comprehensive coverage of inpatient and outpatient services, including medicines on the National List of Essential Medicines (NLEM).6 Individuals must enrol in the scheme at a local Contracting Unit for Primary Care (CUP),6 primarily housed in government-owned hospitals.12 Each CUP receives a capitated payment per registered member to provide outpatient services and medicines.6 CUPs initially served as gate-keepers for secondary and tertiary hospitals. At the beginning of the scheme, when patients were referred, diagnosis-related payments for higher level care had to come out of the CUP's capitated payment, so CUPs had a financial disincentive to refer patients.6 Shortly after the reform was implemented, a separate fund (ie, a global budget) for inpatient services was created, which likely reduced disincentives to refer created by the capitated payment scheme.6 A capitated payment also creates financial incentives for the use of lower cost medicines (eg, generics or less-expensive therapeutic alternatives).
Our objective was to evaluate the immediate, short-term (1 year) and long-term (5 year) impacts of the UCS on pharmaceutical market size and composition for medicines for three non-communicable diseases (NCDs): cancer, cardiovascular disease and diabetes. We hypothesised that the UCS would result in a gradual increase in sales volume, particularly of products used in primary care, as enrolment into the scheme increased and likely made access to health services and medicines more affordable for the majority of the population. We also hypothesised that there would be an immediate shift in market share from more expensive brand name to less-expensive generic or branded generic products and to medicines on the NLEM in response to closed-ended reimbursement rules. We focused on medicines for NCDs since these illnesses represent a large and growing healthcare burden in Thailand13–16 and other LMICs17 and most, but not all, medicines for NCDs would be prescribed and dispensed in primary care settings.
Methods
Data
We used data on quarterly pharmaceutical sales in Thailand from 1998 to 2006 provided by IMS Health.18 The sales data are generated from reports to IMS Health by multinational pharmaceutical companies and surveys of purchases by hospital and retail pharmacies. IMS surveys approximately 200 hospitals (including general and specialised, public and private) and 350 retail pharmacies in Thailand. These facilities constitute a stratified random sample of the over 1100 hospitals and 14 000 retail pharmacies in Thailand to enable national projections. Documentation on the IMS data collection and validation process is available upon request from the authors. Medicines were classified according to the European Pharmaceutical Research Association Anatomical Therapeutic Chemical (ATC) system.19
Outcomes
We used two outcome measures: total volume and per cent market share. Total volume is the number of standard units purchased per capita per quarter (ie, ‘sales’). We analysed total volume by sector (ie, retail versus hospital). A standard unit, as defined by IMS Health, is the smallest dose of a product, which equates to one tablet or capsule for an oral dosage form, one teaspoon (5 ml) for a syrup and one ampoule or vial for an injectable product. For the total volume analyses, we divided total volume by size of the population over 15 years old to control for population growth (using yearly population estimates from the World Bank20). We used the entire population as denominator for insulins, since they are also used for type 1 diabetes, a chronic disease that affects children. Per cent market share is the per cent of total volume in four mutually exclusive categories of licensing status: originator brand products, branded generic products (products sold under a brand name other than the originator brand name of the molecule), generic products (products that are sold under the generic molecule name) and products manufactured by Thailand's Government Pharmaceutical Organization (GPO). We also assessed per cent market share by NLEM status (based on the 1999 and 2004 Thai NLEM).
We analysed total volume and market share for medicines in eight therapeutic classes: two classes of diabetes products (oral antidiabetics and insulins), three classes of cardiovascular disease products (antihypertensives, lipid-regulating and cardiac therapy products) and three classes of cancer products (antineoplastics, immunostimulating agents and cytostatic hormone therapy products); table 1 in the online appendix lists all medicines by ATC code. We assigned each therapeutic class to one of two categories: medicines usually used to treat primary care health conditions and medicines usually used to treat more complicated conditions, typically in secondary/tertiary, often inpatient care, settings. Antidiabetic, insulin, antihypertensive and lipid-lowering products are usually used for primary care conditions (ie, diabetes, high blood pressure and high cholesterol), whereas cardiac therapy and cancer products are usually used for more severe conditions that more likely require treatment by a specialist and/or in an inpatient setting.
Summary of the impact of the Universal Coverage Scheme on volume of medicine sales in the hospital sector (from segmented regression results)*
Research design
We used an interrupted time-series design, the strongest quasi-experimental approach for evaluating effects of interventions, which has been used extensively for medication use research.21 Although we did not have an equivalent control group, we used medicines sold in the retail sector as a non-equivalent comparison group,22 assuming that the retail market should be relatively unaffected by the reforms since UCS enrolees could only obtain covered medicines through their local, hospital-based CUP.
Statistical analysis
The intervention was the UCS roll-out from April to October 2001. We defined three distinct periods: 12-quarters prereform (1998Q2–2001Q1), a three-quarter UCS roll-out period (2001Q2–2001Q4; grey box in figures) and 19-quarters postreform (2002Q1–2006Q3). We ended analysis prior to 2006Q4 since there was a policy change at that time (the removal of an initial 30 Baht co-payment per visit) which may have impacted outcomes. In sensitivity analyses, we extended the intervention roll-out period, through 2002 and through 2003, to account for potentially delayed implementation and lag of actual enrolment into the scheme.
We used segmented linear regression to measure the prereform trend, the immediate level change following the intervention period, and the postreform change in trend (as compared to the prereform trend). For the NLEM analysis, we reclassified NLEM status in 2005Q1 (when the 2004 list was implemented) and included a pre–post term (‘NLEM’) in the model to account for possible discontinuity due to the reclassification. We report two estimates from the segmented regression models—the postreform change in trend and the immediate level change following the reform. We controlled for serial autocorrelation using an autoregressive error model. We retained all terms in the models, even if non-significant. We used the models to estimate absolute and relative differences (with 95% CIs)23 in observed versus predicted total volume at 1 and 5 years postreform. In sensitivity analyses, we included a quadratic term for the postreform trend and used a likelihood ratio test to determine the best-fitting model. We report below results from the best-fitting model of the shortest (ie, three-quarter) intervention period and mention differences in model results where they existed. Results from sensitivity analyses are available upon request. We used the AUTOREG procedure in SAS V. 9.3 for all analyses.
Results
Hospital sector volume
The majority of sales in Thailand for all cancer, cardiovascular disease and diabetes medicines studied were in the hospital sector and were for medicines on the NLEM. After implementation of the UCS, there was a significant increase in the level of sales of insulins and a significant increase in the trend in sales of antidiabetic, insulin, antihypertensive, lipid-regulating and cytostatic hormone products (table 1, figures 1 and 2). There was a significant reduction in the level of sales immediately following the reform for three medication classes: antihypertensive, cardiac therapy and immunostimulating agents (although only the latter was significant in the sensitivity analyses using a longer intervention period; table 1, figures 1 and 2).

Standard units per capita by quarter: insulin (hospital vs retail sector). The grey box in the figure represents the three-quarter Universal Coverage Scheme roll-out period.

Standard units per capita by quarter: antihypertensives (hospital vs retail sector). The grey box in the figure represents the three-quarter Universal Coverage Scheme roll-out period.
The UCS was associated with increased sales of diabetes medicines. One year after the policy, the sale of insulin was 35% (95% CI 15% to 55%) higher and, at 5 years, 174% (95% CI 114% to 235%) higher than what would have been expected in the absence of the UCS (table 2). The increase in insulin sales was driven primarily by human insulins, which are on the NLEM and marketed as branded generics by two manufacturers. The policy was associated with a 39% (95% CI 14% to 64%) increase in antidiabetic product sales 5 years after implementation (table 2). This was largely due to increased sales of generic and branded generic metformin and glibenclamide products, both of which are on the NLEM.
Relative impact of UCS on sales of medicines by class (1 and 5 years postpolicy)*
Implementation of the UCS appears to have had a mixed impact on sales of cardiovascular medicines. Five years after the policy, the sale of lipid-lowering agents was nearly double (108% increase; 95% CI 60% to 157%) what would have been expected in the absence of the scheme (table 2). The increase was primarily due to sales of branded generic simvastatin and gemfibrozil products, which are on the NLEM, and a small but steady increase in sales of originator atorvastatin products, which were not on the NLEM until 2004. For antihypertensives, the significant increase in postpolicy trend compensated for an initial drop in sales, resulting in a slight increase in sales 5 years after the policy (19% increase; 95% CI −3% to 40%) (figure 2, table 2). The increased trend was primarily due to the sales of enalapril, atenolol and amlodipine, all of which are on the NLEM and predominately sold as branded generics. The reform had no significant impact on sales of cardiac therapy medicines 1 or 5 years after the policy.
The results were also mixed for cancer medicines. The UCS had no significant 1-year or 5-year impact on the sale of antineoplastics or cytostatic hormones (although the latter class did experience a significant postpolicy increase in trend). However, the policy was associated with an immediate reduction in sales of immunostimulating agents that did not recover in the postpolicy period. One year after implementation, the sale of immunostimulating agents was 35% lower (95% CI −45% to −25%) than expected from prepolicy trends, and 26% lower (95% CI −45% to −8%) 5 years postpolicy. This drop is almost entirely due to a sharp reduction in sales of interferon α-2b, a non-NLEM medicine, around the time of UCS implementation, which could have been due to a coincidental recall of an interferon α-2b product.24
Finally, as expected, the reform had little impact on sales volume in the retail sector—there were few significant postimplementation changes, and the changes that were significant were small in magnitude (see online appendix, table 2).
Hospital sector market share
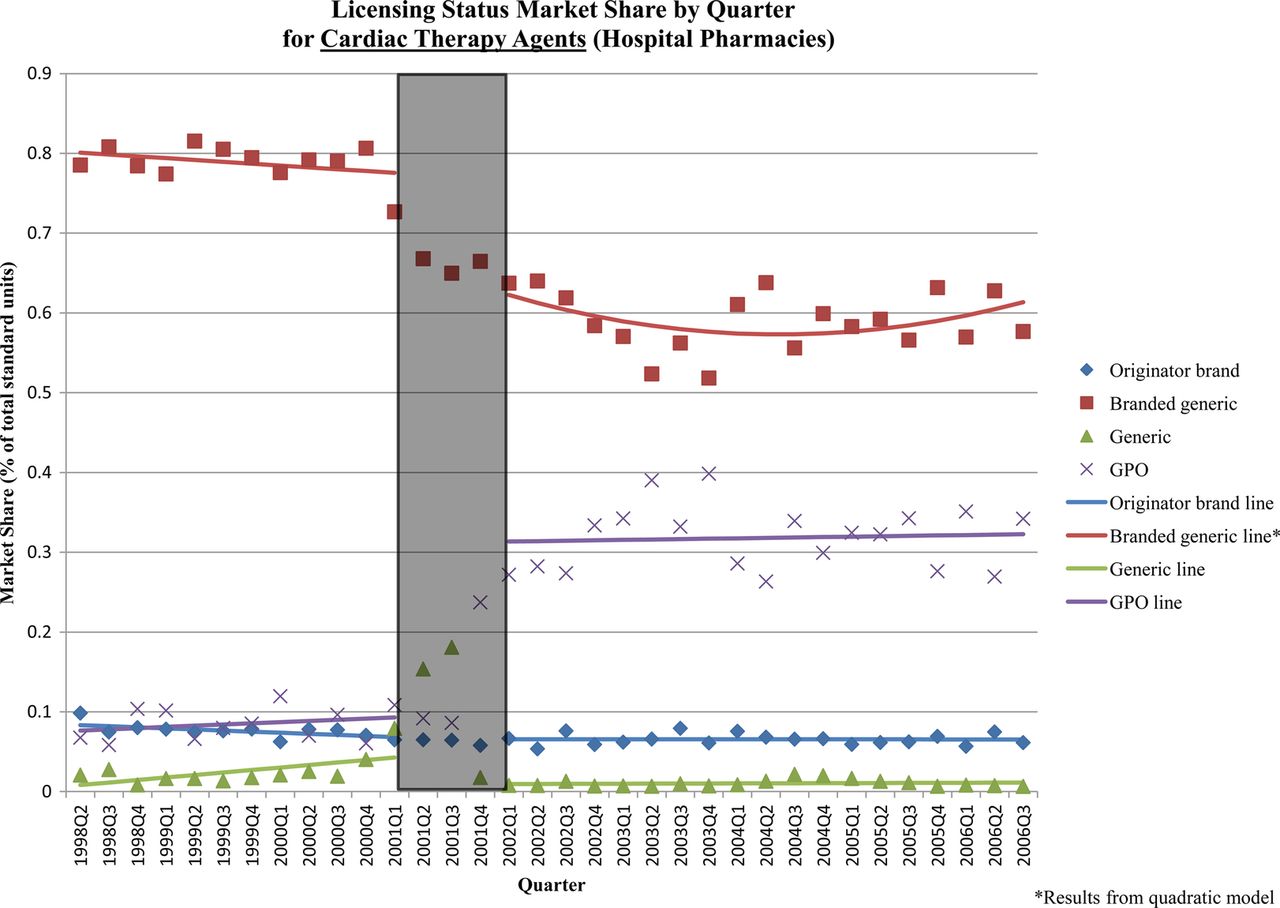
Immediately following the reform, there were significant shifts in hospital sector market share by licensing status for most classes (table 3). The changes for antidiabetics and cardiac medicines—the two therapeutic classes with the largest shifts—were due to significant increases in GPO-produced medicines, primarily at the expense of branded generics and, to a lesser extent, generics. There was a significant increase in GPO antidiabetic products (+16% of market; 95% CI 12% to 20%), and decreases in branded generic (−12%; 95% CI −16% to −9%) and generic (−4%; 95% CI −6 to −1%) products immediately after the policy (figure 3). Similarly, there was a significant increase in GPO cardiac therapy products (+22%; 95% CI 15% to 28%) and significant decreases of branded generic (−14%; 95% CI −21% to −7%) and generic (−4%; 95% CI −6% to −2%) products immediately after the policy (figure 4). There was also a small decrease in market share of generic antihypertensives (−6%; 95% CI −8% to −3%), which was compensated for by a marginally significant increase in GPO products.
Immediate impact of Universal Coverage Scheme on hospital sector market share*

Licensing status market share by quarter: antidiabetics (hospital sector). The grey box in the figure represents the three-quarter Universal Coverage Scheme roll-out period.
Licensing status market share by quarter: cardiac therapy products (hospital sector). The grey box in the figure represents the three-quarter Universal Coverage Scheme roll-out period.
The market for lipid-regulating agents experienced an immediate shift from originator products (−8% market share; 95% CI −10% to −5%) to branded generics (+8%; 95% CI 5% to 10%). A similar shift was seen in the market for immunostimulating agents (6% decrease in originator products (95% CI −10% to −3%) and a 5% increase in branded generics (95% CI 2% to 7%)). The cytostatic hormone market experienced an immediate shift from branded generic (−8%; 95% CI −12% to −4%) to generic products (+6%, 95% CI 1% to 11%). Generic insulins experienced a slight decrease in market share caused by the market exit of the sole generic manufacturer just before the policy. There were no immediate changes in market share for antineoplastics. Aside from the immediate level changes following the policy, there were few major changes in market share for all classes.
The UCS did not have a major impact on NLEM market share, likely because the share of NLEM medicines was already quite high (see online appendix table 6 and figure 17). The only notable level change, for immunostimulating agents, was likely due to the coincidental recall of a non-NLEM interferon α-2b product.24 Whereas all medicine classes had significant postreform trends, these trends were small in magnitude and NLEM market share remained fairly stable over the study period until the 2004 NLEM was introduced. There were large changes in NLEM market share for three classes—antihypertensives, lipid-regulating agents and cytostatic hormones—at the time of the 2004 NLEM implementation in 2005Q1 (see online appendix table 6 and figure 17). Given the increase in postreform volume for many medicine classes, a stable NLEM market share in the short-term (ie, pre-2005) following the UCS implementation suggests a postreform increase in both NLEM and non-NLEM medicines.
Discussion
The UCS was associated with long-term (ie, 5 years) increases in hospital sector sales of medicines for chronic diseases that are usually treated in primary care settings, such as diabetes, high blood pressure and high cholesterol. We hypothesised this gradual increase in volumes since the UCS expanded access to primary care25 and actual enrolment into the scheme occurred gradually from implementation in 2001 until around 2004, by which time 95.5% of the population had insurance coverage.6 The UCS, which radically changed hospital financing and reimbursement, was also associated with an immediate market shift to locally produced or branded generic products for most therapeutic classes.
Despite these increases in access, the policy did not appear to increase the sales of medicines for more severe diseases like heart failure, arrhythmias and cancer, which are often treated in secondary or tertiary settings. This finding is consistent with evidence that the capitated payment system initially discouraged referrals of UCS patients to higher level care.6 ,25 ,26 The UCS also appears to have had a mixed impact on the utilisation of essential medicines. There were increases in NLEM medicines, which are covered, as well as non-NLEM medicines. Similarly, given the capitated UCS payment system, we expected to see an increase in sales of generic medicines, which are typically less expensive. However, the majority of sales in most classes were for branded generic products, many of which had generic alternatives in the market. Interestingly, substantial market share shifts occurred towards products manufactured by the Thai GPO, which have been noted to have higher than market prices.27 By law, GPO products received preferential status by hospital purchasers,28 which negates the incentive to prescribe cheaper alternatives under the capitated payment system. While the increase in GPO products and the UCS implementation may be a coincidence in timing, it is noteworthy that the GPO expanded its product line at a time when the UCS policy expanded the market of people who could afford medicines.
Our study demonstrates the value of IMS Health market intelligence data for rigorous health policy evaluation. Unlike other sources of data on pharmaceutical utilisation (ie, national health surveys or ad hoc hospital surveys), IMS data represent country pharmaceutical markets consistently over time and are useful for the evaluation of system-wide interventions. Nevertheless, the data pose some limitations. Aggregate national sales data do not allow us to determine whether observed increases in medicines sales occurred preferentially among UCS enrolees or enrolees in the SSS and CSMBS schemes, conceivably to compensate for financial strain of the UCS on hospital budgets.6 CSMBS expenditures increased following UCS implementation29 and increased medicines sales among CSMBS enrolees, reimbursed on a fee-for-service basis, could explain increases in non-NLEM medicines and medicines with less-expensive therapeutic alternatives.5 However, it is unlikely that increased utilisation among CSMBS enrolees explains most of the observed volume changes since this would imply that one-half (for diabetes) to three-quarters (for hypertension) of CSMBS members (7.1% of the total population in 20046) were on these treatments in 2004. Even the CSMBS and SSS schemes combined (20.3% of the total population in 20046) are unlikely to be responsible for the observed changes since this would imply that one-quarter (for diabetes) and one-third (for hypertension) of enrolees in the two schemes were on these treatments in 2004. These estimates are much higher than the national prevalence (6.7% for diabetes30 and 22% for hypertension31 in 2004) and unlikely in the civil servant and private sector workforce populations, which are likely to be healthier and wealthier than the national average.
Our interpretation of the observed changes assumes that pharmaceutical sales to hospital and retail pharmacies reflected total market utilisation, and that hospital sales volumes included utilisation at affiliated primary care units. This assumption seems justified in light of the estimated 91% accuracy of IMS Health data in representing the Thai pharmaceutical market.32 For local generic products, including those produced by the GPO, IMS Health data are based on pharmacy surveys only (as opposed to pharmacy surveys and manufacturer reports), so we may have underestimated utilisation. However, unless this systematic underestimation changed at the point of the UCS implementation, it would not have impacted our results. Finally, since we did not convert standard units of product sold to defined daily doses, we do not describe sales changes in terms of average adult doses.
There are also potential limitations owing to study design and statistical analysis. We addressed the main threat to the internal validity of the interrupted time-series design—a concurrent event that affects the outcome of interest—by assessing other policies or market events that occurred at the time of the UCS, through literature reviews, discussions with in-country experts, and by including the retail sector as a comparison. The statistical approach, segmented regression analysis, usually assumes a linear trend and well-defined break point. Sensitivity analyses that varied model specification and intervention duration did not change the findings. By reporting results from fully specified models, we may have underestimated the statistical significance of 1-year and 5-year change estimates.
While both the context and the implementation of universal coverage in Thailand are unique and not necessarily generalisable to other LMICs, our findings suggest that expanding health insurance coverage with a medicines benefit to the entire population, together with changes in the payment system and increased local manufacturing, increased the per capita volume of medicines sold and, by inference, improved access to medicines in the primary care sector in Thailand, presumably by making medicines more affordable. Since the study period, Thailand has enacted further policies to address pharmaceutical sector cost escalation (eg, strict enforcement of reimbursement for only NLEM medicines in the CSMBS33) and to ensure appropriate access to non-NLEM medicines (eg, coverage of medicines for HIV, renal replacement therapy and mental health conditions).34–36 In the future, it will be important for Thailand and other countries to assess equity in access to and quality of use of medicines, availability of medicines in health centres and hospitals, out-of-pocket and system expenditures and affordability, and health outcomes as they pursue policies to achieve universal coverage.
Acknowledgments
We gratefully acknowledge support of statistical analyses by Dr Fang Zhang, Department of Population Medicine, Harvard Medical School and Harvard Pilgrim Health Care Institute, Boston, USA; Dr Sanita Hirunrassamee, Phramongkutklao Hospital, Bangkok, Thailand and Ms. Rosarin Sruamsiri and Dr Nathorn Chaiyakunapruk, Naresuan University, Phitsanulok, Thailand, provided helpful input on Thai essential medicines listings and coverage policies. Mr. Amit Backliwal, at the time of the study at IMS Health, Bangkok, Thailand, shared valuable insights on the Thai pharmaceutical market.
References
Supplementary materials
Supplementary Data
This web only file has been produced by the BMJ Publishing Group from an electronic file supplied by the author(s) and has not been edited for content.
Files in this Data Supplement:
- Data supplement 1 - Online supplement
Footnotes
-
Contributorship: LFG, DRD and AKW designed the study and developed the analytic approach. PS assembled the data files. LGF analysed the data. SR provided the Thai national list of essential medicines and information on relevant Thai policies and the context surrounding the reform. All authors participated in the interpretation of the results. LFG wrote the first draft of the paper. All authors contributed to the writing of the manuscript. Opinions expressed are solely those of the authors and not of the institutions they represent.
-
Funding IMS Health provided the data in-kind. The Harvard Medical School Fellowship in Pharmaceutical Policy Research and the Harvard University PhD Program in Health Policy supported LFG. AKW and DRD were supported in part by a grant from the Novartis Foundation for Sustainable Development to develop examples of research on access to medicines using IMS Health data for presentation at the Third International Conference for Improving Use of Medicines.
-
Competing Interests LFG had financial support from Harvard Medical School and Harvard University, AKW and DRD were supported in part by a grant from the Novartis Foundation for Sustainable Development, PS is an employee of IMS Health; no financial relationships with any organisations that might have an interest in the submitted work in the previous 3 years; no other relationships or activities that could appear to have influenced the submitted work.
-
Provenance and peer review Not commissioned; externally peer reviewed.
-
Data sharing statement Data available upon request, at the approval of IMS Institute for Healthcare Informatics.
-
Ethics approval Harvard Pilgrim Health Care Institute Office of Sponsored Programs.