Article Text

Abstract
Objectives To determine whether the obstetric pathways leading to caesarean section changed from one decade to another. We also aimed to explore how much of the increase in caesarean rate could be attributed to maternal and pregnancy factors including a shift towards delivery in private hospitals.
Design Population-based record linkage cohort study.
Setting New South Wales, Australia.
Participants For annual rates, all women giving birth in NSW during 1994 to 2009 were included. To examine changes in obstetric pathways two cohorts were compared: all women with a first-birth during either 1994–1997 (82 988 women) or 2001–2004 (85 859 women) and who had a second (sequential) birth within 5 years of their first-birth.
Primary outcome measures Caesarean section rates, by parity and onset of labour.
Results For first-births, prelabour and intrapartum caesarean rates increased from 1994 to 2009, with intrapartum rates rising from 6.5% to 11.7%. This fed into repeat caesarean rates; from 2003, over 18% of all multiparous births were prelabour repeat caesareans. In the 1994–1997 cohort, 17.7% of women had a caesarean delivery for their first-birth. For their second birth, the vaginal birth after caesarean (VBAC) rate was 28%. In the 2001–2004 cohort, 26.1% of women had a caesarean delivery for their first-birth and the VBAC rate was 16%. Among women with a first-birth, maternal and pregnancy factors and increasing deliveries in private hospitals, only explained 24% of the rise in caesarean rates from 1994 to 2009.
Conclusions Rising first-birth caesarean rates drove the overall increase. Maternal factors and changes in public/private care could explain only a quarter of the increase. Changes in the perceived risks of vaginal birth versus caesarean delivery may be influencing the pregnancy management decisions of clinicians and/or mothers.
- OBSTETRICS
- Maternal medicine
- Statistics & Research Methods
- SURGERY
- Adult surgery
This is an open-access article distributed under the terms of the Creative Commons Attribution Non-commercial License, which permits use, distribution, and reproduction in any medium, provided the original work is properly cited, the use is non commercial and is otherwise in compliance with the license. See: http://creativecommons.org/licenses/by-nc/2.0/ and http://creativecommons.org/licenses/by-nc/2.0/legalcode.
Statistics from Altmetric.com
Article summary
Article focus
-
Worldwide, caesareans section rates are increasing and have risen beyond that necessary for optimal maternal and neonatal health outcomes.
-
If rising caesarean rates are to be arrested, subpopulation trends (eg, first-birth, second-birth, intrapartum and prelabour caesareans) need to be quantified so that policies can be formulated to best target reductions.
-
Factors such as increasing maternal age and private obstetric care have been consistently associated with higher caesarean section rates.
Key messages
-
Rising rates of women having a first birth by caesarean, both prelabour and intrapartum, drove the increase in overall caesarean rate over time. Vaginal birth after caesarean rates fell, so that the increased first-birth rates were then compounded by increases in prelabour repeat caesarean among these women.
-
Only a quarter of the rise in the first-birth caesarean rate could be explained by changes in maternal factors (such as age, malpresentation and induction), infant factors (prematurity, birthweight ≥4000 g) or a shift towards delivery in private hospitals.
-
Parallel increases in caesarean deliveries in first and second births, intrapartum and prelabour caesareans, and public and private patients suggest general changes in attitudes to obstetric risk factors and delivery management are driving the caesarean increase.
Strengths and limitations of this study
-
Strengths include recent population-based data that are reliably reported with little missing information or loss to follow-up.
-
Women's first and second births were longitudinally linked so that individual obstetric history pathways could be examined.
-
Limitations include the lack of detailed clinical information in population data, such as the appropriateness of caesarean delivery and the stage of labour at intrapartum caesarean.
Introduction
The rates of caesarean delivery in many developed and developing countries have risen higher than necessary for optimal maternal and neonatal health outcomes.1–3 Upward trends in caesarean delivery rates are not fully explained by changes in maternal characteristics or pregnancy complications.4–6 Caesarean rates may be affected by clinicians’ and women's attitudes towards caesarean delivery, which may differ depending on how maternity services are delivered. Private care is associated with increased caesarean delivery.7 The Australian healthcare system is a mixture of public and private care. All women are covered by national health insurance which provides free maternity care for public patients in public hospitals but about one-third take out private medical insurance or pay for private obstetric care (private patients). For private patients, antenatal care is provided by the women's chosen obstetrician, who also attends the birth which may be either at a private or public hospital. Public patients receive antenatal care and delivery in public hospitals and care is provided by rostered midwives, specialists in training and staff obstetricians. Owing to concerns about falling participation in private health insurance and rising public healthcare costs, starting in mid-1997 the Australian federal government enacted a series of measures designed to encourage the use of private healthcare.8 The aim of our study was to compare the obstetric histories of women giving birth in a lower caesarean rate era with the recent higher caesarean rate time period, to see where the greatest changes in the caesarean rates have been. We also used a regression model to examine how much of the change in caesarean rates at first-birth could be explained by changes in maternal and pregnancy factors and changes in private care.
Methods
The primary study population included all maternities in New South Wales (NSW) from 1994 through 2009. NSW is the most populous state in Australia and accounts for one-third of all Australian maternities (>90 000 per annum). Data were obtained from the Perinatal Data Collection (PDC), a statutory surveillance system covering all births ≥20 weeks gestation or ≥400 g birthweight9 and the Admitted Patient Data Collection (APDC), which contains summary discharge data for all hospital admissions in NSW. The PDC includes information on birth hospital, maternal characteristics, pregnancy, labour, delivery (including whether vaginal or by caesarean section) and infant outcomes. Payment status for deliveries (public or private) was determined from a combination of PDC and APDC records. The data were linked longitudinally to create obstetric histories for individual women. Record linkage was undertaken by the Centre for Health Record Linkage, and was approved by the NSW Population and Health Services Research Ethics Committee. Data were provided to researchers as de-identified records by the NSW Ministry of Health. The validity of the probabilistic record linkage is extremely high with less than 1% of records having an incorrect match.10 Details of labour and delivery are reliably reported on the PDC when compared with the medical records (98% and 99% agreement, respectively).11 ,12
Analysis was undertaken in three stages. First, among all maternities from 1994 to 2009, the annual caesarean delivery rates were determined overall and then by parity and labour onset. Second, using longitudinally linked data for two cohorts of women with first and second births, obstetric history paths were constructed to allow comparison of caesarean delivery rates in two different time periods, defined by first-birth during 1994–1997 (Cohort 1) and first-birth during 2001–2004 (Cohort 2). These time periods preceded and followed implementation of changes aimed at increasing private health insurance uptake in Australia: the Medicare levy surcharge (July 1997); private health insurance rebate (January 1999); and Lifetime Health Cover (July 2000). The year 1999 also marks a period when trial of labour (TOLAC) and vaginal birth after caesarean (VBAC) rates began to decline in NSW as prominent reports of increased risks of uterine rupture were published.13 ,14 Because women delivering in 2001–2004 could not be followed up for the same duration as women delivering in 1994–1997, we restricted the analysis of longitudinally linked births for both groups to women whose second birth occurred within 5 years of their first-birth.
We refer to women who had a caesarean delivery prior to the onset of labour (or attempt at labour induction) as ‘prelabour caesareans’. Prelabour caesarean sections are primarily performed for medical or pregnancy complications (eg, pre-eclampsia, diabetes, placenta praevia, fetal compromise) and also for elective repeat caesarean section. Caesarean delivery undertaken during labour is referred to as ‘intrapartum caesareans’. In the case of multifetal pregnancies (twins and higher order multiple pregnancies), if one or more of the infants were born by caesarean, this was counted as a caesarean delivery.
Finally, we used predictive modelling to ascertain whether the observed trend in first-birth caesarean section rates could be explained by changes in risk factors over time.15 A multivariable logistic regression model was used to evaluate the associations (the model beta estimates) of maternal age, country of birth (Australia yes/no), plural birth, breech and other malpresentation, maternal hypertension or diabetes, labour induction or augmentation, birthweight ≥4000 g, preterm birth (<37 weeks gestation) and type of care (private care in a private hospital, private care in a public hospital or public care in a public hospital) with caesarean delivery during the study period. Records with missing data (less than 0.3% of births) were excluded from the model. The model coefficients were then used to calculate expected adjusted OR (aOR) and expected rates for each year, accounting for changes in the listed covariates over time. If the observed and predicted trends are not different, this implies that the available explanatory variables account for all the increase in caesarean section rates. Conversely, any difference between the observed and predicted trends would be due to factors not included in the model. This analysis was restricted to first-births, as the predominant explanatory factor for second and later births is a prior caesarean.6
Results
From 1994 to 2009, the overall caesarean rates, both prelabour and intrapartum, increased among first and subsequent births with a sharper increase commencing around 2000 (figure 1). Among first-births, the rate of prelabour caesarean increased (from 6.5% to 11.7%) and was exceeded, almost twofold, by the rates of intrapartum caesarean in each year (12.5–20.2%). Among the subgroup of singleton cephalic-presenting first-birth women with spontaneous labour at ≥37 weeks, the proportion delivered by intrapartum caesarean rose from 10.9% to 16.7%. Among singleton term cephalic-presenting first-birth women who were induced, the proportion delivered by intrapartum caesarean rose from 20.4% to 33.9%. From 1994 to 2002, the highest rates were for intrapartum caesarean deliveries among first-births, but from 2003 onwards these rates were overtaken by the rate for prelabour caesareans for subsequent births. The single largest yearly rise in the overall caesarean rate took place in 2000–2001 (from 21.4% to 23.6%), with intrapartum caesareans rising from 8% to 9.4% of all first-births (a relative rise of 18%).
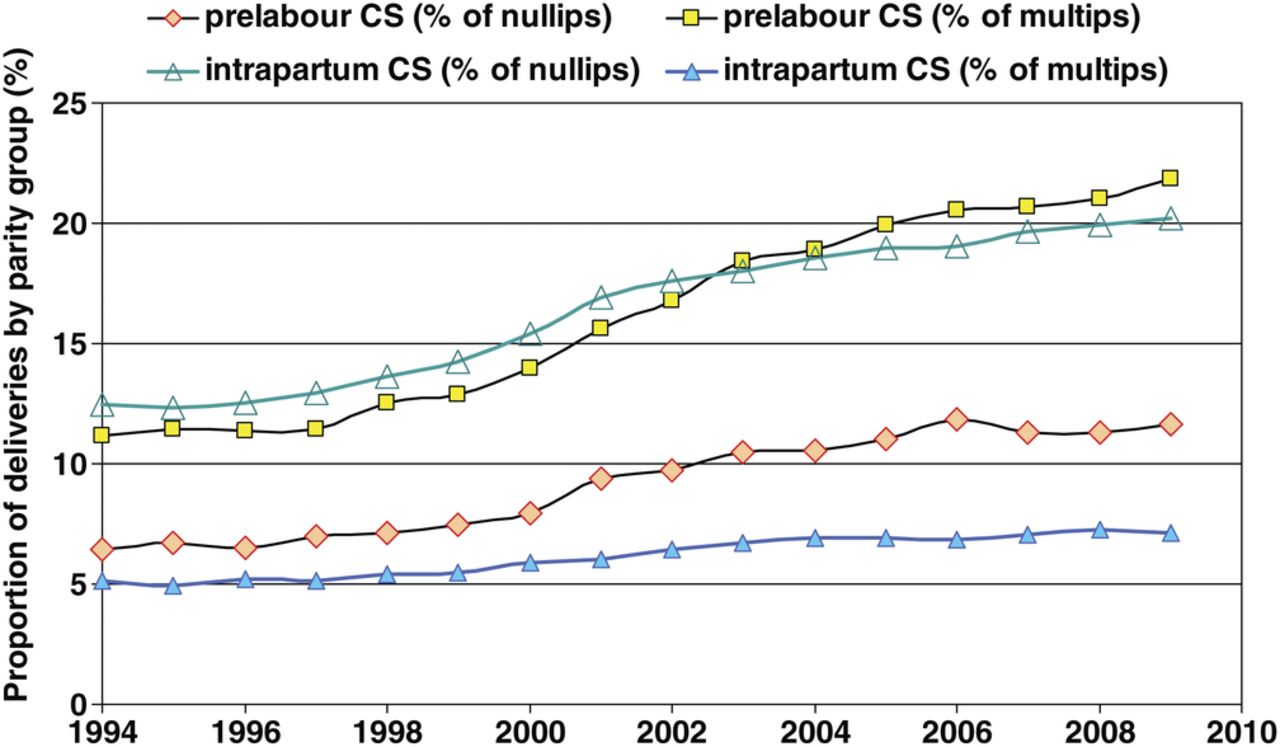
Proportion of all births delivered by prelabour and intrapartum caesarean section, by parity, NSW.
For the second stage of the analysis, we examined the obstetric history pathways for two cohorts of women who had a first birth followed by a second birth within 5 years. Table 1 shows how these two cohorts were formed, starting from 138 186 first-births in 1994–1997 and 141 863 first-births in 2001–2004. Ultimately, 82 988 women with a first-birth in 1994–1997 (60.1% of first-birth maternities) were included in Cohort 1 and 85 859 women with a first-birth in 2001–2004 were included in Cohort 2. Women whose first-birth was by caesarean section were significantly less likely to have a subsequent birth recorded (relative risk (RR)=0.90 (95% CI 0.89 to 0.91) for Cohort 1). The median interval between first and second births for Cohort 1 (which had ≥12 years follow-up) was 2.6 years (IQR 1.9–3.7).
Formation of the two first-birth cohorts of women, for the comparison between eras
Table 2 compares demographic characteristics of Cohorts 1 and 2 at the first-birth. The percentage of women aged ≥35 years increased from 5.1% in Cohort 1 to 8% in Cohort 2, a relative rise of 57%. Deliveries in private hospitals rose from 20% to 30.1%, with an off-setting decline of private patients in public hospitals. Comparisons between the two cohorts showed that first-birth caesarean delivery rates for breech presentation at term increased from 84.7% to 97.5% and for multifetal pregnancies from 43.7% to 62.9%.
First-birth pregnancy characteristics of the two cohorts of women with linked first and second births
Figure 2 shows the obstetric history pathways taken by the two cohorts of women. The overall caesarean delivery rate (across both first and second births) increased from 17.8% in Cohort 1 to 27.4% in Cohort 2 (a relative increase of 54%). Among first-births, the caesarean rate rose by a relative 47%, from 17.7% in Cohort 1 to 26.1% in Cohort 2. This was driven by rises in both prelabour caesareans (by 49%, from 5.9% to 8.8%), and intrapartum caesareans (by 46%, from 11.8% to 17.3% of all first-births). In both cohorts, intrapartum caesarean was the greatest contributor (67% and 66%) to the total first-birth caesarean rates. Intrapartum caesarean rates among first-births were higher following labour induction than spontaneous labour but increased at a similar rate: for induction by 41% (from 19.7% to 27.8%), and for spontaneous labour by 46% (from 10.2% to 14.9%).

Obstetric history paths for two cohorts of women with first and second births. TOL, trial of labour; VBAC, vaginal birth after caesarean; VD, vaginal delivery.
Among women with a first-birth caesarean, the percentage of women attempting a trial of labour in their second maternity and the percentage achieving a VBAC both fell over time (figure 2). In Cohort 1, 4143 (28%) birthed vaginally in their second birth, compared with 3502 (15.6%) of women in Cohort 2. Prelabour repeat caesareans increased by 25% and primary caesarean for the second birth increased by 56% between Cohorts 1 and 2. Consequently, among second-births, the caesarean rate rose by a relative 61%, from 17.9% in Cohort 1 to 28.8% in Cohort 2.
As the final stage of the analysis, the comparison of observed versus predicted caesarean rates for all first-births (not just the obstetric history cohorts) is shown in figure 3. The actual caesarean rate among all first-births showed a 13 percentage point increase, from 19% in 1994 to 32.1% in 2009. Despite starting from a lower base, the change in first-birth caesarean among public patients (from 16.5% to 27%) occurred in concert with that observed in private patients (from 22.9% to 40.5%). Compared to public patients, delivery in a private hospital was associated with caesarean first-birth: aOR=1.45 (1.42 to 1.47) while delivery as a private patient in a public hospital had an intermediate association with caesarean: aOR=1.12 (1.10 to 1.15). Using the predictive model, trends in public/private care accounted for only 0.4% of the increase in first-birth caesareans, while changes in maternal, pregnancy and infant factors accounted for an additional 2.7%. Together the modelled risk factors only explained 24% of the relative increase in first-birth caesarean sections.

Observed and predicted rates* of first-birth caesarean section. *Adjusted for changes in maternal age, country of birth, plurality, breech and other malpresentation, hypertension, diabetes, preterm, induction/augmentation, birthweight ≥4000 g and private/public care.
Discussion
Like many other high-income countries, caesarean rates have increased in Australia and there is great interest in how a reduction in rates might be achieved.16–18 In our study population, the fundamental feature has been a sharp rise in caesarean delivery at first-birth, which then feeds into increased repeat caesareans. Since 1994, intrapartum caesarean deliveries have accounted for two-thirds of all first-birth caesareans. This finding is consistent with a recent US study (2003–2007) where over 60% of primary caesarean births were for labour arrest disorders or non-reassuring fetal heart rate tracing, with relative increases of 21% and 62%, respectively, for caesarean delivery in these situations.19 Other international intrapartum rates are difficult to identify. A comparative analysis of international caesarean delivery rates from single hospitals in nine countries in 2005–2006 reported intrapartum caesarean rates for nulliparae with singleton, cephalic presentations ≥37 weeks with spontaneous labour ranging from 5.7% in Norway to 20.6% in New Zealand.20 The comparable rate of 16.7% in 2009 in our study population was at the high end of this range.
This population-based study illustrates how a rising caesarean delivery rate can develop a momentum that is difficult to reverse. Until 2003, caesarean rates for multiparous women lagged behind the rising first-birth rate. However, as the TOLAC/VBAC rate decreased and repeat caesareans increased, the caesarean rate among multipara has exceeded that of nullipara. The steady increase in first-birth caesareans in the 2000's means that overall caesarean rates may still rise for some years, even if first-birth caesarean rates plateau.21 If rates of TOLAC and VBAC could recover from the decreases since the 1990s, this has the potential to reduce overall caesarean rates by up to 5%—only 3.5 women would have to be considered for a VBAC attempt in order to avoid one repeat caesarean. However, increasing TOLAC would not address the rising first-birth caesarean rate.1 ,21 Furthermore, any substantial recovery in TOLAC and VBAC rates appears less likely given the recent publication of a prospective study reporting a lower risk of fetal and infant death or serious infant morbidity following elective repeat caesarean compared with planned TOLAC.22
Policies encouraging uptake of private health insurance could have been expected to be associated with some of the rise in primary caesareans. Deliveries in private hospitals increased during the study period, and private hospitals did have higher rates of caesarean delivery. However, even after adjusting for changes in private/public care, and for increased maternal age and other factors, our predictive model found that only 24% of the increase in the primary caesarean rate could be explained. Information was not available for the entire study period on some factors associated with caesarean delivery (eg, placenta praevia and maternal obesity) but other studies assessing changes in maternal characteristics and pregnancy complications have similarly been unable to fully explain increasing caesarean rates.4–6 The large increase in caesarean deliveries in public patients as well as private patients suggests that the trend reflects more general changes in attitudes to obstetric risk factors and delivery management. Women and obstetricians may have become more averse to the perceived risks associated with vaginal delivery, or alternatively the perceived risks of caesarean section, relative to vaginal delivery, may have decreased. One possible contributor in our study population may have been a widely publicised NSW civil suit alleging negligence in a vaginal delivery.23 This case was finally settled in the appeals court in 2001 (coinciding with the single largest annual increase in caesarean rates 2000–2001), with a final payout of $11 million dollars The case contributed to one of the larger medical liability insurers going into liquidation in 2002, again with much media coverage.
Although intuitively it seems that reducing first-birth prelabour caesareans should have great potential as a target for interventions aimed at reducing overall caesarean section rates, the scenario is more complicated for two reasons. For one thing, even when the alternative scenario (await spontaneous labour) is a safe and acceptable option, it does not necessarily result in vaginal birth. Second, the nulliparae with a singleton cephalic presenting fetus who have a prelabour caesarean at term (a likely target group) represent a minority of all first-births (6% in 2009) that would dilute any impact on the overall rates.9 Further, these women are likely to have disparate medical and pregnancy conditions that may not be amenable to a single intervention.
The issue of whether efforts can or should be made to decrease the intrapartum caesarean rate is vexed. Intrapartum caesarean delivery is indicated following either concerns over fetal welfare or a failure to progress in labour, although the threshold for intervening may have changed. Interventions demonstrated to be effective in randomised trials include continuous support for women during childbirth, early amniotomy and early administration of oxytocin in spontaneous labour, and high-dose oxytocin for augmentation of delayed labour.24–26 Level of skill and obstetric training in labour management and operative vaginal deliveries are key issues, and there is some evidence that involvement of consultant obstetricians in decision-making can reduce the likelihood of caesarean.27 Evidence-based protocols for evaluating fetal status and managing dysfunctional labour need to be developed and promoted. In one study, application of a strict protocol dramatically reduced elective no-medical-indication births before 39 weeks, although the impact on caesarean rates was not an outcome.28 Finally, making performance data public has also resulted in changes in obstetrical services.29 However, changing practice requires that interventions are adapted to local circumstances.30
Breech presentation almost uniformly resulted in caesarean section by the 2000's (97.5% in Cohort 2, table 1) and makes a continued and stable contribution to caesarean section rates.6 ,31 Decreasing breech presentation as a means of reducing caesarean section rates should not be overlooked, as external cephalic version is evidence-based and likely to be achievable with training and education for both women and clinicians.32 Another contributor was caesarean delivery for multifetal pregnancies, which increased by 50% across the two cohorts. There is an absence of clear evidence about management, although the outcome of a randomised trial of prelabour vaginal birth versus caesarean section for twins is imminent.33
The strength of this population-based study is the availability of reliably collected labour and delivery data, and the ability to differentiate prelabour and intrapartum caesareans. This study reports caesarean section as an outcome, but not the outcomes of caesarean section which may be affected by changes in both obstetric and neonatal care. However, from 2001 to 2009, increasing caesarean section rates have not been accompanied by any significant change in perinatal mortality, but have been accompanied by a small (3%–3.2%), but statistically significant, increase in severe neonatal morbidity.34 An important consideration for this study is that women with more than one birth are not the same as those having only one. Women who intend to have more than one child may have a greater sense of commitment to a vaginal birth. For women who continue on to have more children, the relative benefit of increasing VBAC in the second birth would play an enhanced role. However, in a population where one-child families are common, reducing primary caesareans would be of increasing relevance. Of note, the steepest relative increase in caesarean sections (by 56%) occurred among women having a primary caesarean for their second birth. The reasons for this are unclear and warrant exploration.
Conclusion
A relatively steep rise in first-birth caesarean rates, both prelabour and intrapartum, over a period of a few years was compounded by the subsequent increases in rates of repeat caesarean. Only 24% of the increase in primary caesarean could be explained by maternal factors and by increased private maternity services, suggesting that changing attitudes towards caesarean delivery are driving the increase. If rising caesarean rates are to be arrested or reversed, mothers and maternity service providers will need supporting evidence demonstrating that in most circumstances vaginal delivery at term is as safe for the neonate as caesarean section.
Acknowledgments
We thank the NSW Ministry of Health for access to the population health data and the NSW Centre for Health Record Linkage for linking the data sets.
Appendix 1
See table A1.
Adjusted* OR (aOR) for factors included in the regression model of caesarean delivery for nulliparous women 1994–2009
References
Footnotes
-
Contributors CLR and CSA conceived the project and developed the idea in collaboration with JBF, ALT and JMM. All authors (CLR, CSA, JBF, ALT and JMM) contributed to the study design. CLR, CSA and JBF were responsible for data acquisition; and CSA and CLR conducted the data analysis. CLR, CSA and ALT initially drafted the manuscript and all authors were involved in critical revision of the intellectual content. All authors approved the final manuscript.
-
Funding This work was supported by an Australian National Health and Medical Research Council (NHMRC) Grant (#571451). Christine Roberts is supported by a NHMRC Senior Research Fellowship (#1021025).
-
Competing interests None.
-
Ethics approval NSW Population and Health Services Research Ethics Committee.
-
Provenance and peer review Not commissioned; externally peer reviewed.
-
Data Ssharing Sstatement: The data are not available for sharing.