Article Text

Abstract
Objective The purpose of this study was to translate and test the psychometric properties of the Norwegian-language version of the Risk Assessment Pressure Sore (RAPS) scale.
Background Risk assessment scales for pressure ulcer (PU) prevention have become an aspect of quality improvement in healthcare, but their effectiveness depends on the reliability and validity of the scale.
Methods A convenience sample of 481 residents in 15 nursing homes in rural Norway was included between January and June 2007. The English-language version of the RAPS scale was translated into Norwegian, and this scale was used to collect the data, including a skin examination. The number of PUs and grades were documented. Reliability was assessed in a small group of 26 residents and construct validity in the total study group.
Results Equivalence between two assessments regarding total scores of the RAPS scale was reflected in an intraclass correlation coefficient (ICC) of 0.95. Construct validity was supported, and the RAPS scale could define groups with expected low and high scores. Further evidence of construct validity was shown in a confirmatory factor analysis.
Conclusion The Norwegian version of the RAPS scale has shown sufficient psychometric properties to be considered a reliable and valid scale for identifying risk of PUs among nursing home residents. However, further testing is needed.
- WOUND MANAGEMENT
This is an open-access article distributed under the terms of the Creative Commons Attribution Non-commercial License, which permits use, distribution, and reproduction in any medium, provided the original work is properly cited, the use is non commercial and is otherwise in compliance with the license. See: http://creativecommons.org/licenses/by-nc/2.0/ and http://creativecommons.org/licenses/by-nc/2.0/legalcode.
Statistics from Altmetric.com
Article summary
Article focus
-
▪ In the Norwegian nursing home setting, there is a lack of reliable and valid assessment scales for identifying risk for pressure ulcers.
-
▪ This paper focuses the translation and psychometric testing of the Norwegian-language version of the Risk Assessment Pressure Sore (RAPS) scale.
Key messages
-
▪ Acceptable testing results for equivalence and construct validity were obtained for the Norwegian-language version of the RAPS scale.
-
▪ The RAPS scale could define groups with expected low and high scores.
Strengths and limitations of this study
-
▪ The study describes a translated and tested pressure ulcer risk assessment scale with an adequate number of items for use in clinical practise.
-
▪ The sample of residents was a convenience sample from nursing homes, and the most preferable study group would have been a more mixed group.
-
▪ The study did not assess concurrent validity.
Introduction
Risk assessment scales for pressure ulcer (PU) prevention have been used for several years, and different scales have been developed.1 Their effectiveness depends on the reliability and validity of the scale,1 and when translated, it must undergo proper testing.2 ,3
No national Norwegian PUs guidelines have been implemented in Norwegian nursing homes.4 Research conducted in Norwegian nursing home settings may enrich our knowledge of the factors that can predict PUs. However, to conduct such studies, it is of considerable importance to use a risk assessment scale that has been tested for reliability and validity.
Background
PUs are of significant concern in nursing home settings throughout the world, and they increase length of stay, the amount of treatment needed and financial costs.5 In nursing homes, the PU prevalence varies between 4.3% and 43.3%.6–8 A high-quality risk assessment scale should be, among other things, reliable and easy to use in clinical practise.9
The Risk Assessment Pressure Sore (RAPS) scale, used in this study, was developed and tested in Sweden and includes items from the Norton Scale, the modified Norton Scale and the Braden Scale.10 ,11 The RAPS scale is used to promote prevention of PUs by clinicians to identify residents at risk. The items in the RAPS scale are known to predict the risk for PUs.10 ,11 However, because it is of crucial importance to use a reliable and valid scale, the RAPS scale must be translated and tested before it can be used in a Norwegian context in clinical practise and research.
The study
Aim
The purpose of this study was to translate and test the psychometric properties of the Norwegian-language version of the RAPS scale.
Translating procedure
The English version of the RAPS scale was translated into Norwegian according to the recommended procedure presented by Swaine-Verdier et al2 and then back to English. The two English RAPS versions were compared. A panel with representatives from nursing homes and a hospital discussed the translation until consensus was reached; this process resulted in a few linguistic changes. They were discussed with a bilingual (Norwegian−English) expert in nursing. He suggested a few linguistic changes of verb tenses for improved clarity and understanding.
Design and sample
The study had a cross-sectional design and was conducted in 15 nursing homes in rural areas in southern Norway. The residents in Norwegian nursing homes are mainly in need of long-term care and are provided with care 24 h a day including assistance to all their activities of daily living and medical care. Mainly registered nurses (RNs), nursing aides (NAs) and nursing assistants (nurses without formal education) are working shift in the nursing homes. Between January and June 2007, a convenience sample of 481 residents, 121 (25.2%) men and 360 (74.8%) women from 46 units was included. The mean age was 84.5 years (SD 8.4), ranging between 55 and 102 years.
The exclusion criteria used were terminal illness, having resided less than 24 h in the nursing home, having lower extremity amputation or receiving enteral and/or parenteral nutrition, based on the difficulties to measure weight and height for body mass index (BMI) calculation. Residents from special units for rehabilitation were also excluded.
Data collection
Data were collected with the RAPS scale and skin examination was performed in all the nursing homes included. Clinicians, RNs and NAs, in the nursing homes were trained to use the scale and conduct a skin examination (as a part of the RAPS scale), as well as to measure weight, height and calf circumference once on all residents included. BMI was also calculated.
A smaller group of 26 residents with a mean age of 86.2 years (SD 7.3) from two nursing homes was drawn from the study sample. Twenty women and six men were assessed with the RAPS scale two times by five pairs of RNs. Two RNs, independent of each other, completed the RAPS scale on the same residents on the same day.
Risk Assessment Pressure Sore scale
The RAPS scale is a summative, ordinal scale with 10 questions, and the total sum scores ranges from 10 to 39 points. A lower score indicates greater risk for PU development. Nine questions are rated from 1 to 4: general physical condition, physical activity, mobility, moisture, food intake, fluid intake, sensory perception, body temperature and serum albumin level. One question about friction and shear is rated from 1 to 3. Skin inspection, with PU classification from stage 1 to stage 4 is also incorporated as a part of the scale but not included in the total score.10 ,11 An optimal cut-off point of ≤31 for determining when a resident is at risk for PU was found for the Swedish version of the RAPS scale.10
Ethics
The Regional Committee for Medical Research Ethics in southern Norway (REK Sør, reference number S-07212b) and the Norwegian Social Science Data Services (project number 16822) approved the study.
Data analyses
Most analyses were carried out using the PASW Statistics 18. A p value <0.05 was considered statistically significant. Descriptive statistics were used to describe the study sample. Nominal data are presented with numbers (n) and percentages (%), and ordinal and interval data are presented with mean values (M) and SDs.
Reliability
The reliability of the RAPS scale was assessed as equivalence by means of a two-way mixed intraclass correlation coefficient (ICC) with a 95% CI12 between the two assessments regarding total scores of RAPS in the group of 26 residents. ICCs were also calculated between each item of the two RAPS assessments.
Validity
The validity of the RAPS scale, assessed as construct validity, was investigated by the so-called ‘known groups technique’13 ,14 and confirmatory factor analysis.15 Confirmatory factor analysis was carried out using Mplus, version 515 ,16 under the STREAMS17 environment.
The used ‘known groups’ with expected high and low RAPS scores were those residents who had BMI ≥23 and <23 kg/m2, respectively, and calf circumferences (CC) ≥31 and <31 cm, respectively, according to the cut-off points used in the Mini Nutritional Assessment instrument,18 which is developed for older people. The cut-off points are used because the sample consists of older people. Another used ‘known group’ was those residents who had PUs (stages 1–4) and those who had no PUs, according to the performed skin inspection. The differences between the RAPS mean scores of these ‘known groups’ were tested with Student's t test for independent samples.
The factors found by Lindgren et al10 were used in the confirmatory factor analysis. The total amount of internal missing data was 43 scores distributed across the items. Although the amount of missing variables was very small, in order to include all of the collected information, the missing data modelling procedure implemented in the Mplus programme was used.19 This procedure yields unbiased estimates under relatively moderate assumptions.20
To measure model fit, the χ² goodness-of-fit test, the root mean square error of approximation (RMSEA) and the standardised root mean square residual (SRMR) assessments were used. The RMSEA is strongly recommended as a tool when evaluating model fit since it takes both the number of observations and the number of free parameters into account. An acceptable model fit is indicated by values less than 0.08, while values of less than 0.05 imply a good model fit. SRMR can range from 0 to 1,20 where 0 is indicative of perfect model fit and values 0.08 or smaller indicate an acceptable model fit.15
Results
Reliability
Reliability of the RAPS, reflected as equivalence reached an ICC of 0.95 (95% CI 0.89 to 098, p<0.001, n=26) between the two obtained total scores of the RAPS scale. The ICC values regarding the item level are displayed in table 1.
Intraclass correlations between the two assessments for the items in the RAPS scale (n=26)
Validity
Construct validity of the RAPS scale was supported by significant differences between the mean scores for groups with expected high and low RAPS scores (table 2).
RAPS scale scores for groups with expected high and low scores, respectively
Construct validity reflected in the confirmatory factor analysis is displayed in figure 1.

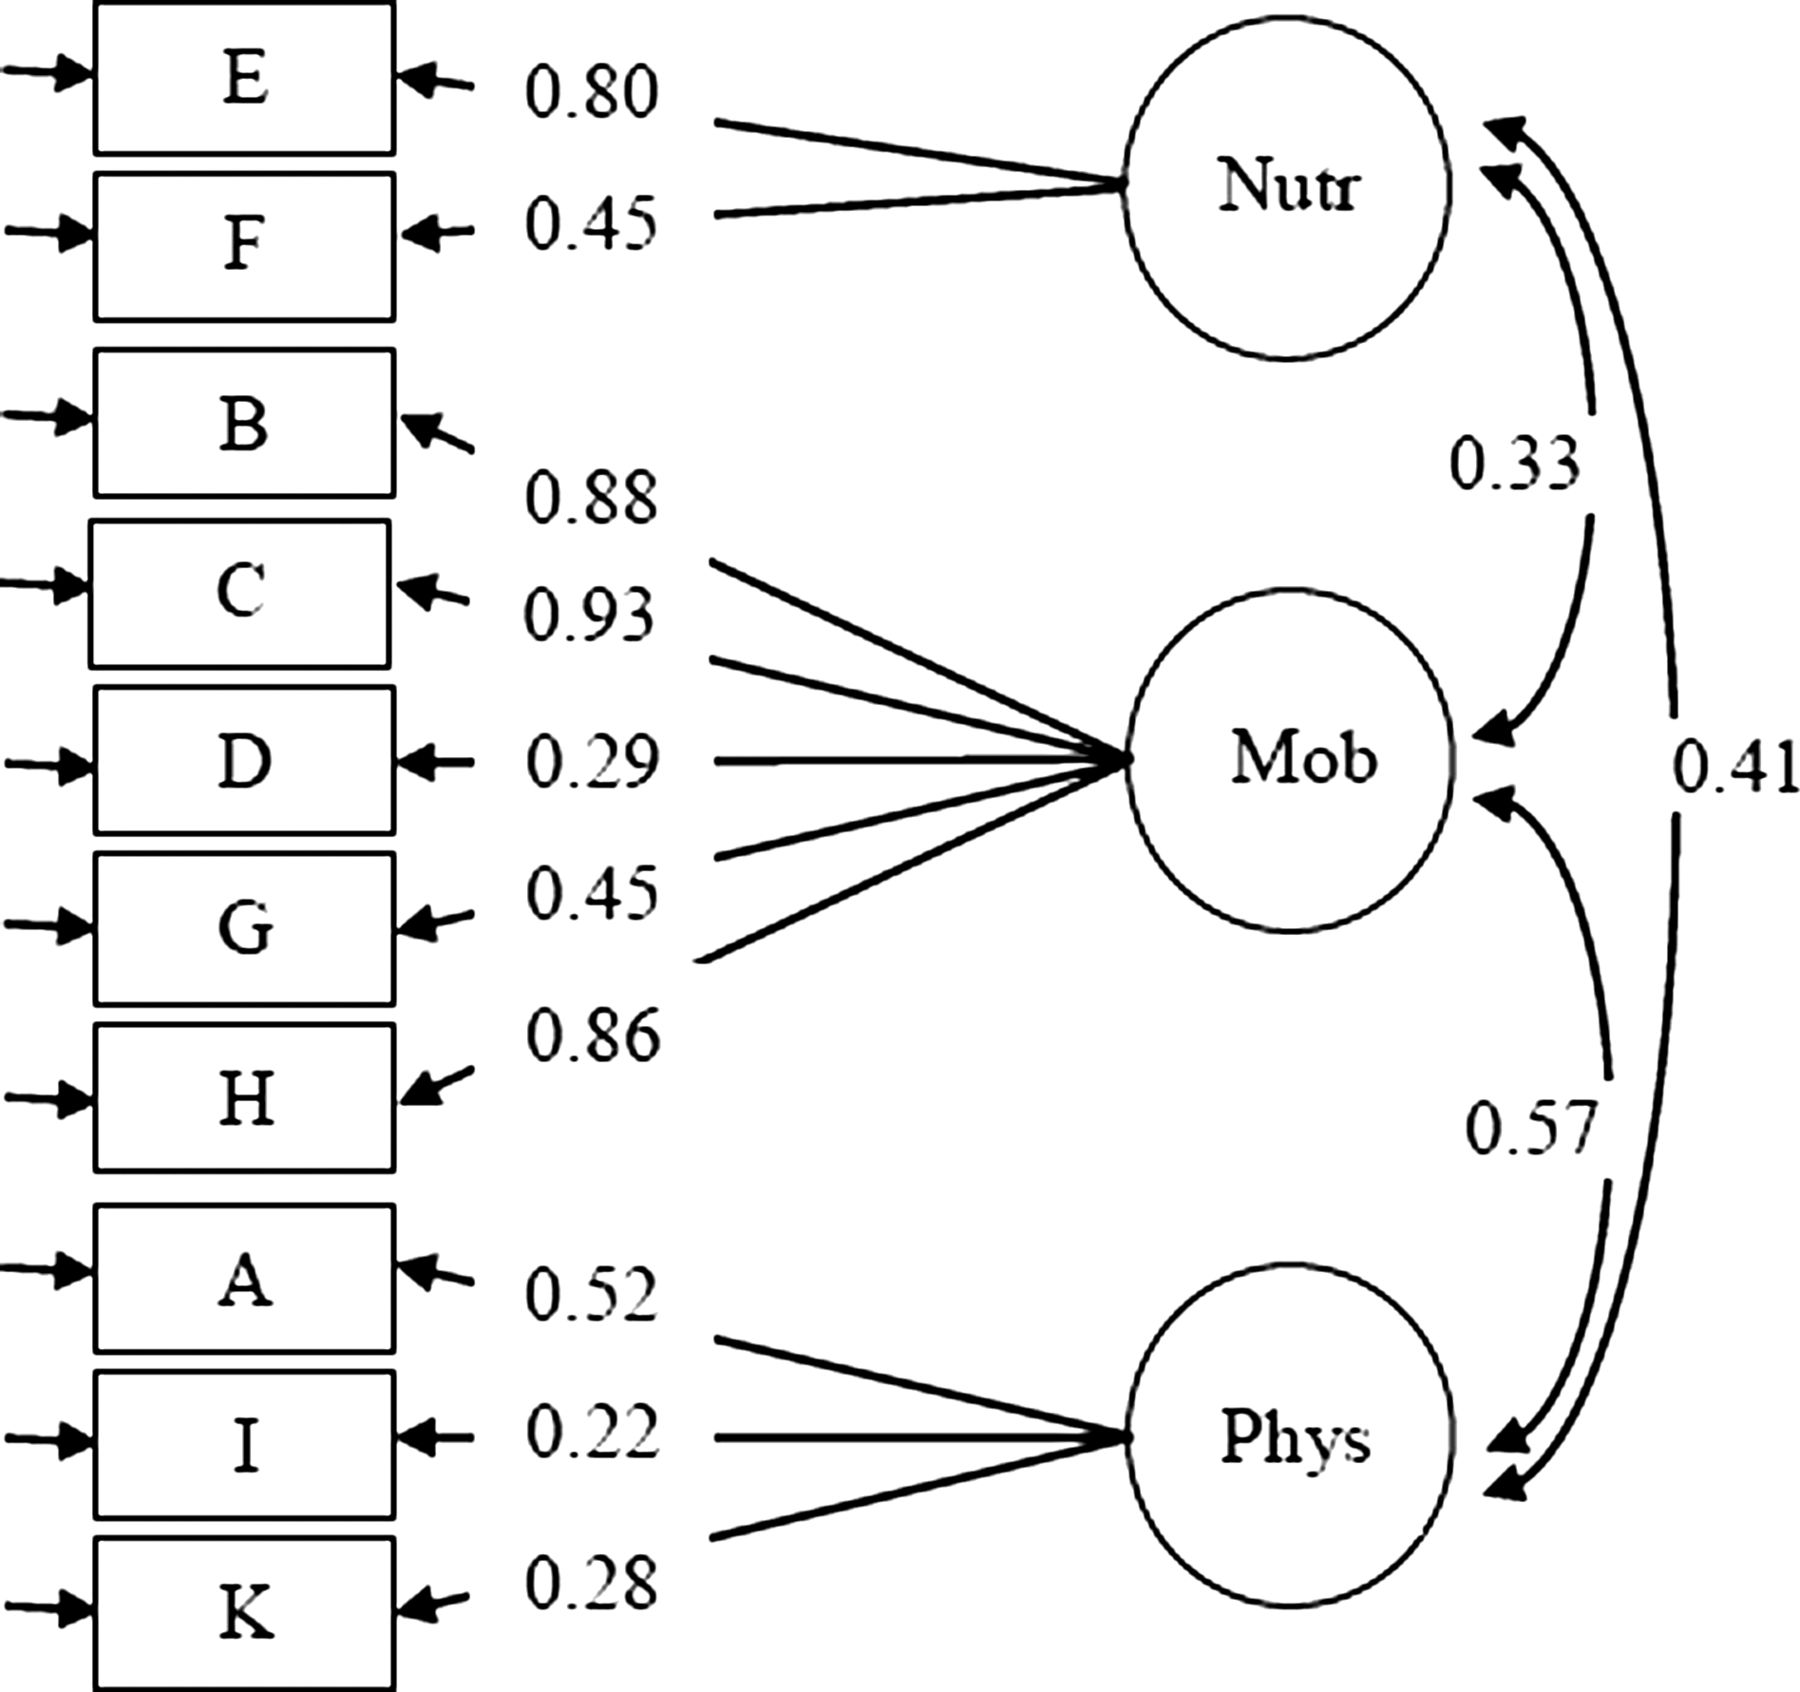
The three-factor model with covariances among the three factors, nutritional status, mobility and physical condition.
The fit indices were good (χ²(32, N=490)=47.45; RMSEA=0.031; SRMR=0.036; and CFI=0.98) indicating satisfactory fit with the original instrument and, thus, evidence for construct validity of this version.
Discussion
Discussion of results
Reliability assessed as equivalence by ICC is the recommended analysis for estimating reliability for such instruments.12 ,21 In our study the ICC was calculated between the two RAPS measurements for 26 residents. This inter-rater reliability was not possible to calculate in the total study group.
The obtained ICCs for each item in the RAPS scale were found to vary between 0.58 and 0.92 and showed thereby sufficient values between the two RN ratings. ICCs are considered almost perfect when greater than 0.81, substantial between 0.61 and 0.80 and moderate between 0.41 and 0.60.22 However, the studied group consisted of only 26 residents, and five pairs of RNs conducted the assessments. Rating the items based on the concepts ‘moisture’, ‘sensory perception’ and ‘nutrition’ may have caused measurement errors because of the difficulties in providing operational definitions of these concepts. At the same, ‘activity’ seemed to yield fewer measurement errors.6 This finding may provide some explanation to why the assessments of the items on the RAPS scale yield measurement errors. It was not possible to obtain an ICC value for body temperature due to the fact that the RNs performed an identical assessment in all residents and only used one response alternative.
The construct validity of the RAPS scale was supported because significant differences were obtained when comparing groups with expected high and low scores. The RAPS scale, could distinguish the group with PUs from the group with no PUs, as well as the groups with low BMIs and low CCs, respectively. It is well known that there is a connection between the development of PUs and bad nutritional status.23–25
The confirmatory factor analysis yielded a factor solution, with three separate factors: mobility, nutritional status and physical condition. In the Swedish testing study by Lindgren et al,10 a factor analysis, that is, a principal component analysis with oblique rotation, explained 65.1% of the total variance, with the same three factors. According to Streiner and Norman,12 confirmatory analysis is very useful when comparing two versions of a scale, and in this study the construct validity of the RAPS was confirmed.
Study limitations
An important limitation of this study is the cross-sectional design, which does not allow us to estimate the predictive validity for the total study group. The sample of residents from 15 nursing homes was a convenience sample, and this fact might lead to a possible selection bias,14 because not all residents in all nursing homes were able to be included. However, our results were similar to the results from the Swedish studies.11 Our study sample, consisting of residents in nursing homes can be assessed as fairly heterogeneous. The most preferable study group would have been a more mixed group, for example, one that included healthy, home-dwelling people and residents from different care settings of different ages and with different medical diagnoses.
The study would have been strengthened if concurrent validity had been assessed by using a well-validated scale. However, since every tool is related to context, risk profiles among the residents and knowledge level of the users, it is difficult to find a gold standard. Despite these limitations, this study offers the first test of the Norwegian translation of the RAPS scale in a sample of nursing home residents that confirms both its reliability and construct validity.
Conclusion
The Norwegian version of the RAPS scale has shown sufficient psychometrical properties to be considered as a reliable and valid risk assessment scale for identifying the risk for PUs among nursing home residents. However, further testing is needed.
Acknowledgments
Thanks to all the nursing homes and especially to all the RNs, NAs and residents who participated in the study. Thanks also to Assistant Professor Solbjørg Terjesen for valuable help with data collection.
References
Footnotes
-
Contributors MF, OS and US were responsible for the study conception and design. MF administered the data collection. MF, OS, CC and US performed the data analyses. MF, OS and US were responsible for the drafting of the manuscript. MF, OS, CC and US made critical revisions to the paper for important intellectual content. OS, CC and US provided statistical expertise. OS and US supervised the study.
-
Funding The University of Agder and Leiv Eiriksson Mobility Program of the Research Council of Norway funded this study as part of a larger project.
-
Competing interests None.
-
Patient consent Obtained.
-
Ethics approval REK Sør, reference number S-07212b.
-
Provenance and peer review Not commissioned; externally peer reviewed.
-
Data sharing statement No additional data are available.