Article Text

Abstract
Objectives To determine the association between area and individual measures of social disadvantage and infant health in the UK.
Design Systematic review and meta-analyses.
Data sources 26 databases and websites, reference lists, experts in the field and hand-searching.
Study selection 36 prospective and retrospective observational studies with socioeconomic data and health outcomes for infants in the UK, published from 1994 to May 2011.
Data extraction and synthesis 2 independent reviewers assessed the methodological quality of the studies and abstracted data. Where possible, study outcomes were reported as ORs for the highest versus the lowest deprivation quintile.
Results In relation to the highest versus lowest area deprivation quintiles, the odds of adverse birth outcomes were 1.81 (95% CI 1.71 to 1.92) for low birth weight, 1.67 (95% CI 1.42 to 1.96) for premature birth and 1.54 (95% CI 1.39 to 1.72) for stillbirth. For infant mortality rates, the ORs were 1.72 (95% CI 1.37 to 2.15) overall, 1.61 (95% CI 1.08 to 2.39) for neonatal and 2.31 (95% CI 2.03 to 2.64) for post-neonatal mortality. For lowest versus highest social class, the odds were 1.79 (95% CI 1.43 to 2.24) for low birth weight, 1.52 (95% CI 1.44 to 1.61) for overall infant mortality, 1.42 (95% CI 1.33 to1.51) for neonatal and 1.69 (95% CI 1.53 to 1.87) for post-neonatal mortality. There are similar patterns for other infant health outcomes with the possible exception of failure to thrive, where there is no clear association.
Conclusions This review quantifies the influence of social disadvantage on infant outcomes in the UK. The magnitude of effect is similar across a range of area and individual deprivation measures and birth and mortality outcomes. Further research should explore the factors that are more proximal to mothers and infants, to help throw light on the most appropriate times to provide support and the form(s) that this support should take.
This is an open-access article distributed under the terms of the Creative Commons Attribution Non-commercial License, which permits use, distribution, and reproduction in any medium, provided the original work is properly cited, the use is non commercial and is otherwise in compliance with the license. See: http://creativecommons.org/licenses/by-nc/2.0/ and http://creativecommons.org/licenses/by-nc/2.0/legalcode.
Statistics from Altmetric.com
Article summary
Article focus
To determine the association between area and individual measures of social disadvantage and infant health in the UK.
Key messages
It is possible to be reasonably confident of the magnitude of effect of social disadvantage on health outcomes for UK infants, in particular the effects of area or individual deprivation on birth outcomes and infant mortality.
The magnitude of effect, of a range of measures of social disadvantage on infant health outcomes, is broadly similar and has remained so over the past 30 years.
Future research should concentrate on the more proximal determinants of infant health outcomes (such as individual maternal and infant factors) and the impact of any interventions employed to mitigate these determinants.
Strengths and limitations of this study
A rigorous systematic review and accompanying meta-analyses provide confidence in the findings.
Specific relevance to the UK.
A risk of publication bias (missing studies) cannot be ruled out though, given the large size of many included studies, the likely effect is minimal.
The review concentrates on health outcomes only.
Introduction
Socioeconomic status, as indicated by level of income, education, wealth, occupation and access to resources, is well established as associated with an individual's health and well-being. Furthermore, the correlation is evident throughout the life course. Such social variables are key elements of the aetiology of ill health and disease.1–3 The same social factors also determine the health and life chances of the unborn and newborn child and impact on early child development. These interactions have been theorised in the social–ecological model of health, which acknowledges the cumulative impact of individual, familial, community and societal forces on people's health.4 ,5
The UK government and devolved administrations are committed to tackling the social, economic and environmental factors that influence health through evidence-based approaches to the underlying social determinants of ill health and to interventions to address these inequalities.6–9 This approach is in line with the conclusions of WHO sponsored Commission on the Social Determinants of Health.3
Birth and early development play a vital role in creating and maintaining socioeconomic health inequalities through adulthood.6 ,10 From a pathway approach, early development from conception to 5 years of age is widely accepted as establishing the foundation for learning, behaviour and health throughout the life cycle.11 WHO Commission on the Social Determinants of Health in particular stressed the critical role of child health in addressing inequities in health. Investments in child health and development are seen as forces to equalise health status through the life course.3 These points were reiterated in the recent Marmot Review, which particularly stressed the importance of giving every child the best possible start in life.6
There is an implicit recognition of the importance of social determinants to the well-being of children in national policy. For example, a stated aim of 'Healthy Lives, Brighter Futures' is to get the right services, advice and support to all parents with more intensive support for the most vulnerable.12
The UK performs very poorly in comparison with similar countries on mortality among the under 5s.13 A recent index of child well-being in the European Union14 suggested that the UK ranked 24/29 for both child health from birth and overall child well-being. Furthermore, the UK had a stillbirth rate of 3.5 per 1000 births in 2009. Within high-income nations, only France and Austria had higher levels.15 Such poor outcomes in comparison to our nearest neighbours suggest that significant action is required to improve health and well-being in childhood.
The objectives of this review were to assess the current evidence for the effects of social disadvantage on birth and infant outcomes for children born in the UK to provide a firm basis for practitioners and policy makers on which to measure the effect of interventions to address these inequalities. This systematic review builds on a previous review of prospective studies carried out for the Welsh government to examine the social determinants of child health in the UK and to develop social indicators from these determinants.16
This analysis provides a current summary of relevant and well-conducted epidemiological research into the links between social determinants and infant health in the UK.
Methods
Inclusion/exclusion criteria
Research studies were sought that reported socioeconomic data and health outcomes for infants (0–12 months) and were carried out in the UK and published between January 1994 and May 2011. The most recent update search was completed on 19 May 2011. There were no language exclusions. A ‘best evidence’ approach was adopted by using data from longitudinal and record linkage studies. Prospective cohort, case–control and retrospective cohort studies with a sample size of 200 or more were included, as well as record linkage analyses of routinely collected data. Case studies and cross-sectional surveys (with data from a single time point) were excluded.
The outcome criteria for the studies were preterm birth, birth weight, mortality, diagnosed illness, attendance at primary or secondary care in relation to ill health, infection, injury or disability, growth and development. The social determinants explored were specific area-based and individual measures of social disadvantage which included area deprivation scores17–20 and individual measures of deprivation (occupational social class, household income/poverty, parental educational status). Lone parenthood was also included as a social determinant, albeit not a direct measure of social disadvantage.
To ensure that the review focused on specific infant health outcomes for the general current population, papers on the following topics were excluded: congenital malformations, in-care or adopted infants, infants with pre-existing medical conditions, specific subgroups of mothers (eg, previous major pregnancy complication) and data from pre-1970. Access to treatment or screening services, immunisation uptake, child abuse or domestic violence studies were excluded unless reported with a social determinant and child health outcome.
Search sources and search strategy
The following databases, websites and other sources were searched: ASSIA (Cambridge Scientific Abstracts); British Nursing Index (OVID); ChildData; CINAHL (Ebsco); Community Wise; Conference Proceedings Citation Index—Science and Social Science & Humanities (Web of Science); Embase (OVID); EPPI Centre DoPHER; HMIC (OVID); Joseph Rowntree Foundation; Local Government Data Unit Wales; Medline (OVID); Medline in Process (OVID); NHS Plans and National Service Frameworks for Wales and England in relation to children; National Institute for Health and Clinical Excellence (NICE); Office for National Statistics; PsycINFO (OVID); ReFER (archive up to September 2007); Science Citation Index (Web of Science); Open SIGLE (replaced by OpenGrey), Social Care Online; Social Science Citation Index (Web of Science); Social Services Abstracts; Sociological Abstracts (Cambridge Scientific Abstracts); WHO Health Evidence Network.
The search terms were developed and tested by qualified librarians (HK and ALW) in one database, Medline, to a high recall of relevant studies (sensitive) without too many irrelevant studies (specific).
The following search terms were used in Medline (where * is the truncation symbol; ab=abstract; cp=country of publication, pt=publication type; ti=title; /=subject heading):
Infant health
Exp infants/OR (Babies or baby or birth* or infant* or neonatal or newborn or perinatal or postnatal or neonatal or perinatal).ab,ti.
AND
Social determinants
Exp socioeconomic factors/OR exp social class/OR (benefit recipient* or deprivation or economic inactivity or educational achievement or educational attainment or employment status or financial hardship or home own* or house own* or housing tenure or inequalit* or inequit* or job opportunit* or lone parent or low income or low pay or marital separation) OR (neglect or overcrowd* or poor environment or poor housing or poverty or property own* or prosperity or single parent* or social adversity or social capital or social class or social disadvantage or social disparit* or social exclusion or social inclusion or social gradient or social housing or social integration or social interaction) OR (social isolation or social mobility or social network* or social position or social relationship* or social security or social status or social stigma or social trend* or social welfare or sociodemographic or socioeconomic or socio-demographic or socio-economic or sole parent or standard of living or unemploy*).ab,ti.
AND
Study designs
exp Meta-Analysis/ OR review.pt OR (census* or cohort* or survey* or evaluat* or longitudinal* or questionnaire* or meta-analys* or metaanaly* or meta analys* or registry or registries or systematic* review* or systematic overview).ti,ab.
AND
Exp Great Britain/ OR (UK OR United Kingdom OR England OR Wales OR Scotland OR Britain OR British OR English OR Welsh OR Ireland OR Irish OR Scottish).ti,ab,cp.
Searches were adapted to other databases to replicate, as closely as possible, the Medline search. In addition, and to minimise the potential for publication bias, a range of supplementary (‘snowballing’) techniques was used to increase the sensitivity of the search and to ensure coverage of grey literature and unpublished studies. These included reference list follow-up, citation tracking of relevant studies (to find newer studies), contact with subject experts and organisations, and table of contents scanning for the journals that appeared most frequently in the list of relevant studies: Journal of Epidemiology and Community Health, Archives of Disease in Childhood (including the Fetal and Neonatal edition) and British Medical Journal. Finally, all systematic reviews on relevant topics were unpicked for primary studies meeting inclusion/exclusion criteria. This included the publication on which this review builds16 and a more recent systematic search carried out by members of the same team for the Welsh government to support the development of a Child Health Monitor.21
Duplicate references were excluded. All titles and, where necessary, abstracts were then screened to eliminate duplicates and obviously irrelevant citations. The full text of all potentially relevant papers was retrieved and screened independently for eligibility by two reviewers using a standardised eligibility form, with adjudication from a third reviewer in cases of disagreement (HK, HEM, MAS and ALW).
Following screening of 5173 citations found in the literature search, 88 papers potentially met the inclusion criteria and were examined in full text. Thirty-six studies met all inclusion and critical appraisal criteria and were included in the final review. Details are given in the flow diagram of figure 1
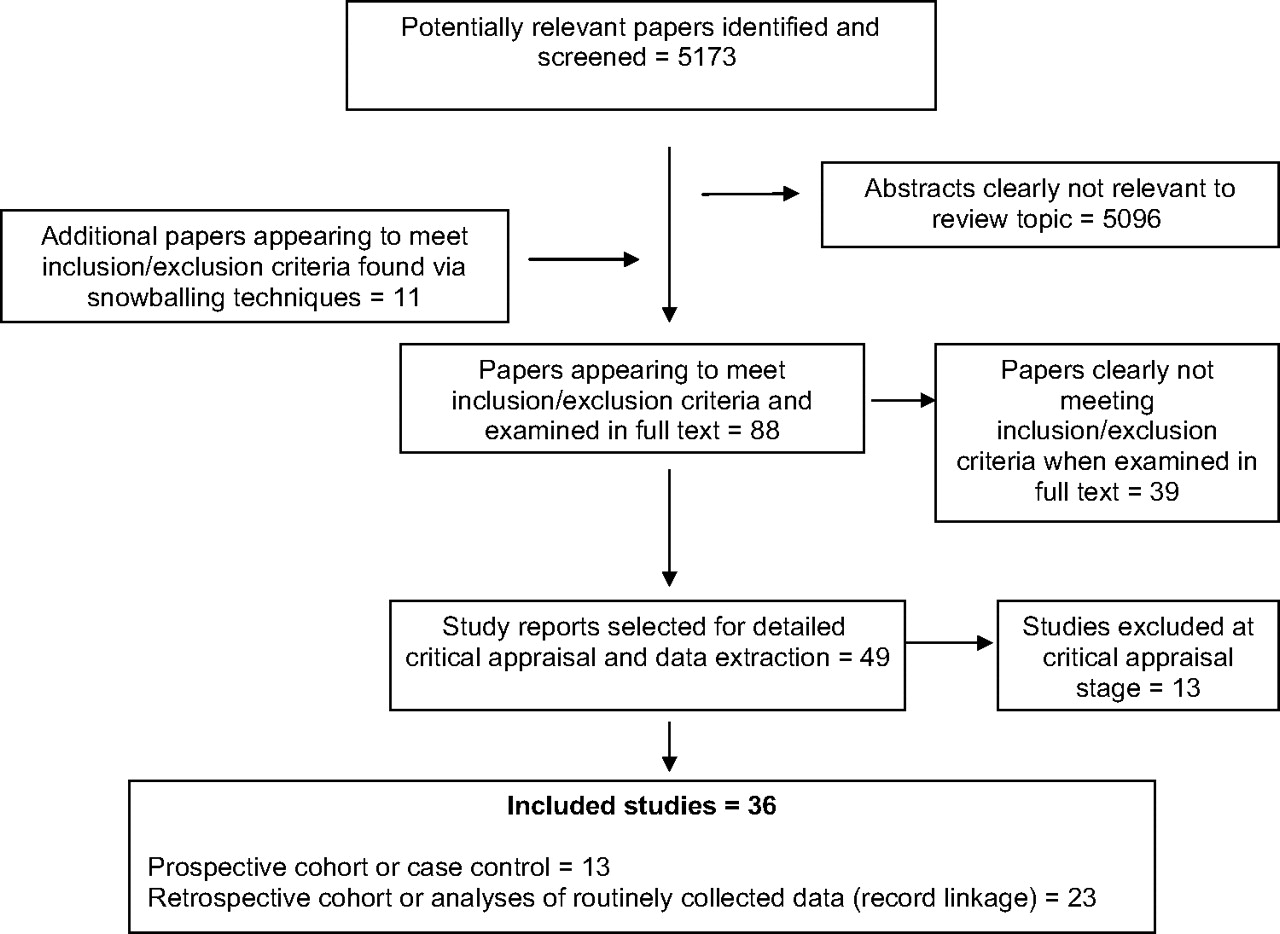
Flow diagram.
Classification of social determinants
Many studies, particularly those using routine data, use area-based deprivation data such as the Townsend20 and Carstairs17 scores, the UK Indices of Multiple Deprivation (IMD)19 and the Jarman Index.18 These are derived from routine data sources, including census data. Most researchers divide geographical units into classes, such as quintiles, based on these deprivation scores. Different geographical areas are used, ranging from enumeration districts, with a population of around 500, to Electoral Wards, with about 3000 people. Many recent studies use the 2001 UK Census geographical unit of Lower Super Output Area containing, on average, a population of 1500.
Some studies used social class, usually based on the Registrar General's classification, instead of an area measure. This has the advantage of being an individual measure and is recorded by the Office for National Statistics on a randomly selected 10% of births. Most studies which used this measure compared class I, consisting of professionals, with class V, made up of unskilled manual workers.
Critical appraisal and data extraction
Following pre-tests to confirm inter-rater reliability and iron out any queries, data were extracted independently by two reviewers (shared by FDD, HEM, MAS, ALW). Each study was assessed for quality against a critical appraisal checklist based on the Newcastle–Ottawa Quality Assessment Scale (NOS).22 Any disagreements were resolved by a third reviewer. There is, as yet, no internationally established quality assessment tool for observational epidemiological studies,23 and the NOS has not been validated.24 Thus, the tool was used to help identify potential methodological weaknesses rather than to provide a definitive quality score for each study. Methodological quality indicators (study design, data sources, response rate and any adjustments to control for baseline variables) were summarised in the Evidence Table (online appendix 1).
A paper was excluded if it did not provide usable data to allow a quantitative comparison of the risk for a health outcome in relation to a measure of individual or area social inequality with an indication of statistical significance (CI or p value). If a research publication reported a non-significant result without supporting data, but the statistical rigour suggested that this was a reliable result, a non-significant result was recorded. In the latter case, it was clearly not possible to include these papers in any meta-analysis.
The key components of the data extraction and critical appraisal outcomes are presented in the Evidence Table (online appendix 1). Details of the eligibility, critical appraisal and data extraction methods are available from the authors.
Study outcomes were analysed by a statistician (FDD) and reported as described by the authors of each paper. Where possible, outcomes were reported as an ‘effect size’ observed with subjects from highest versus lowest deprivation exposures in the Evidence Table (online appendix 1 and 2) to allow comparability between studies. In some cases, the authors did not report the data in the most suitable way, but it was possible to calculate effect sizes and CIs from the data shown. Where possible, an OR comparing the highest and lowest deprivation levels was calculated, as this was the most commonly reported measure. As most outcomes measured were relatively rare, differences between relative risks and ORs will be modest. Some studies adjusted the ORs to allow for confounders, and where possible, the most adjusted data have been reported.
Meta-analyses were carried out, where possible, when a group of papers were sufficiently homogeneous in respect of both outcome and deprivation measures. Because adjustments varied between studies, these analyses were carried out on unadjusted results. Random effects models were used to allow for heterogeneity. The number of studies on any one outcome was too small for funnel plots to be of any value so the risk of publication bias cannot be excluded. However, given the huge size of many of the studies included, CIs are quite narrow and missing small studies would likely have little effect.
Results
Thirty-six studies met the inclusion criteria, of which 13 were prospective cohort (longitudinal) or case–control studies and 23 were based on data collected retrospectively from medical records or routinely collected data (eg, record linkage between a health outcomes register and census data). Findings are summarised in table 1 and detailed in the text. Summary data from each included study are given in online appendix 1.
Social determinants related to specific infant health outcomes: summary results from meta-analyses
Birth weight, prematurity and cerebral palsy
Birth weight, prematurity and cerebral palsy are very closely linked outcomes,41 which are considered together.
Low birth weight
Nine studies (Paranjothy, 2010, unpublished)25–31 ,42 considered the outcome of low birth weight or very low birth weight, defined as <2500 g or <1500 g, respectively; none considered birth weight as a continuous outcome.
These are all based on large routinely collected data sets but they differ in the measures of deprivation used and in the adjustments made in analyses. In general, the studies did not control for gestational age to distinguish premature from small-for-dates babies.
Different studies used different time periods, and it is possible that the effect of deprivation has changed over recent decades. However, two studies which subdivided the data into different decades28 ,31 suggest that the effects have not changed markedly since 1980. Some studies adjusted for confounders, typically maternal age, gender of child and whether the registration was joint or single parent (mother) only. ORs, adjusted for these potential confounders, were generally considerably closer to the null value of 1 than unadjusted ones, reflecting the importance of these factors.
In seven studies that compared area measures (Paranjothy, 2010, unpublished),25–30 the unadjusted ORs, comparing the most and least deprived, varied from 1.67 to 2.01. Combining the estimates in a random effects meta-analysis, the resulting OR was 1.81 (95% CI 1.71 to 1.92) (figure 2). The study by Wright et al42 was not included in the meta-analysis because the definitions of area deprivation are unclear and it is not possible to calculate ORs with any degree of certainty.

Low birth weight versus area deprivation.
One further study43 looked at the specific issue of small for gestational age babies in the West Midlands (birth weight <10th customised centile). For UK IMD quintile 5 versus IMD 1-3 (personal communication from author), the RR of small for gestational age was 1.2 (95% CI 1.1 to 1.3). Since both outcome and comparator measures vary from the other studies, this result was not included in the meta-analysis.
Five studies26 ,27 ,30–32 measured deprivation at an individual level using the Registrar General's social class categories. All but Maher and Macfarlane32 compared social class V with social class I; Maher and Macfarlane compared manual and non-manual workers, and this is probably a less extreme comparison, leading to a smaller OR. For social class, as opposed to area deprivation, Dibben et al26 only reported a heavily adjusted OR of 1.20 and thus was not included in the meta-analysis. The unadjusted estimates of the OR varied from 1.45 to 2.17. Excluding Dibben et al,26 a random effects model pooling these gave an overall estimate of 1.79 (95% CI 1.43 to 2.24), very similar to the estimate for the area-based measures (figure 3).
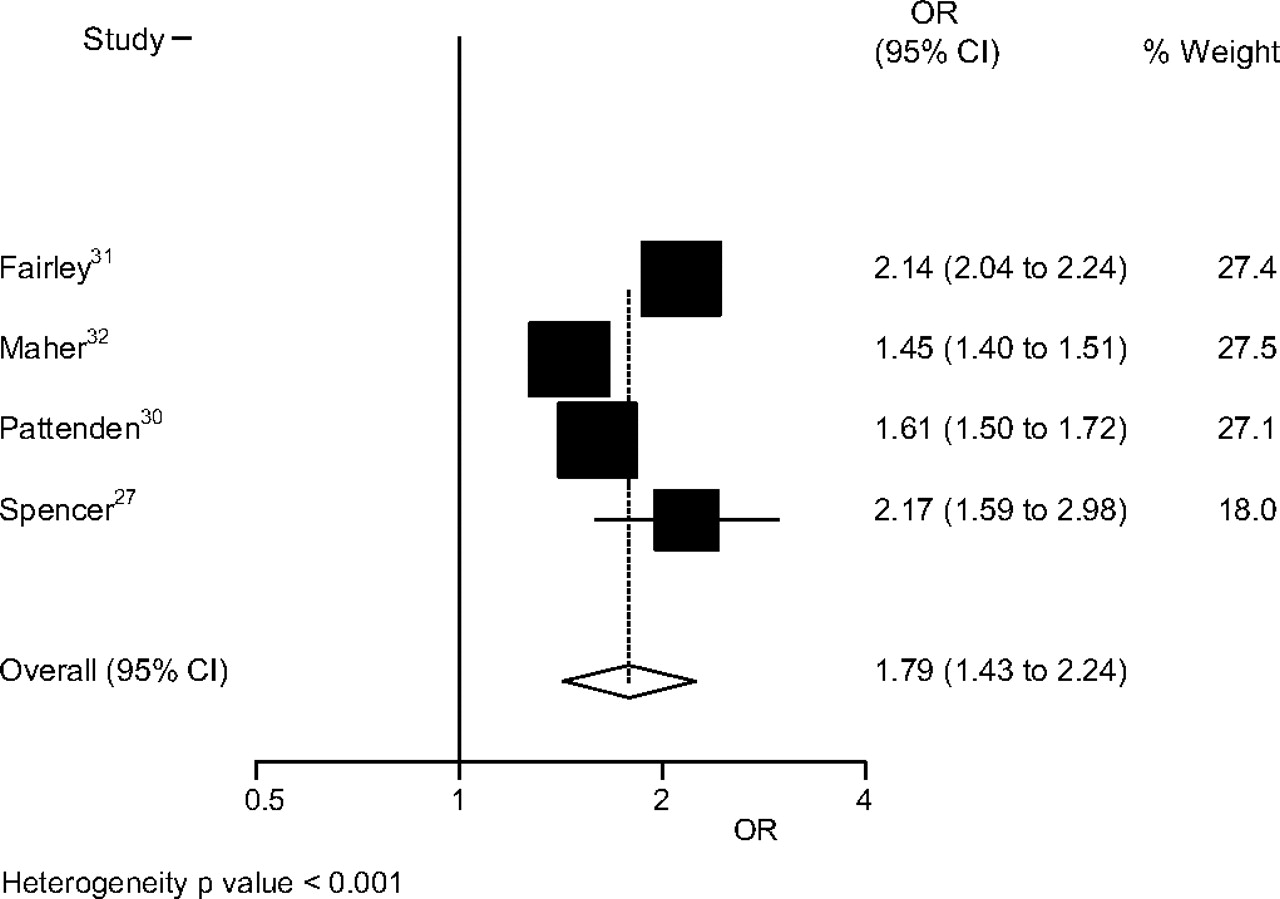
Low birth weight versus social class.
Several authors, including Fairley and Leyland31 and Paranjothy (2010, unpublished), noted that the effects of deprivation appeared to be greater in older mothers. This may merit further investigation.
Four of the studies (Paranjothy, 2010, unpublished)25–27 also examined the incidence of very low birth weight against area-based measures. There was greater heterogeneity in this case, with estimates of the OR varying between 1.29 and 2.54. The meta-analysis gave a combined OR of 1.61 (95% CI 1.31 to 1.97) (figure 4). Again there was evidence from Paranjothy that this OR increased with maternal age.

Very low birth weight versus area deprivation.
In all the above cases, there was considerable heterogeneity; the reasons for this are not clear. All studies used large samples of routine data and, within each analysis, used broadly comparable measures of deprivation.
Overall, it is clear that deprivation is strongly associated with low and very low birth weight. The effect may vary with maternal factors such as age, and this needs further investigation.
Two studies26 ,30 found a statistically significant relationship between lone parenthood and low birth weight with estimated ORs of 1.16 (95% CI 1.09 to 1.25) and 1.46 (95% CI 1.41 to 1.52), respectively, though Pattenden et al30 used single registration, not identical to lone parenthood, and the result of Dibben et al26 was heavily adjusted.
Prematurity
Six papers considered preterm birth as an outcome (Paranjothy, 2010, unpublished).33–35 ,42 ,44 Smith et al44 used 549 618 births from 1994 to 2003 from the Trent region and defined very preterm birth as 22–32 weeks and extremely preterm birth as 22–28 weeks. Combining their deciles into quintiles, the unadjusted OR for very preterm, comparing the most and least deprived quintiles, was 1.72 (95% CI 1.59 to 1.86). For extremely preterm birth, this was 1.74 (95% CI 1.54 to 1.98). Their analysis included all babies alive at the start of labour. A later paper33 reported on a different but overlapping 10-year period from the same region. The ORs were a little higher. Paranjothy (2010, unpublished) included stillbirths in an analysis of 408 445 births in Wales between 1994 and 2005 and found an OR of 1.44 (95% CI 1.32 to 1.56) for very preterm births, comparing the most and least deprived quintiles based on the Townsend score, and the corresponding OR for extremely preterm births was 1.38 (95% CI 1.20 to 1.57). Excluding stillbirths had little effect. Gray et al34 considered all preterm births, defined as being <37 weeks, the OR was 1.47 (95% CI 1.42 to 1.52). Since the majority of preterm births are after 32 weeks, this broadly similar result suggests that the association with deprivation is similar at different stages of prematurity. The study by Wright et al42 in Newcastle found that the RR for most deprived versus most affluent areas was 2.95 (95% CI 1.61 to 5.38). The definitions of area deprivation are unclear and thus it is not possible to calculate ORs with any degree of certainty. Thus, this paper was not included in the meta-analysis.
Yuan et al35 used a case–control study to compare the prevalence of social problems in those whose pregnancy ended at term (≥37 weeks) compared with preterm (<35 weeks), the OR was 2.42 (95% CI 1.60 to 3.66). The definition of social problems is likely to identify more seriously deprived mothers than those studies using social class, and this may account for the more extreme result.
The varying definitions of prematurity in these studies mean it is thus arguable that a meta-analysis is not appropriate in this case. However, to give an indication of effect sizes, combining four studies, with useable data and no overlaps (Paranjothy, 2010, unpublished),33–35 all of which related to area deprivation, gave an OR of 1.67 (95% CI 1.42 to 1.96) (figure 5). The conclusions on prematurity were therefore similar to those for low birth weight, which is strongly related to prematurity. Stillbirth is discussed further under infant mortality.

Preterm birth versus area deprivation.
Cerebral palsy
Two studies considered the relationship between cerebral palsy and area deprivation.45 ,46 Sundrum et al45 used births in West Sussex and found an OR of 1.65 (95% CI 1.14 to 2.39) comparing extreme quintiles based on the Townsend score for enumeration districts. Adjusting for birth weight and gestation age gave a revised estimate of 1.55 (95% CI 1.06 to 2.25). Dolk et al46 examined over 1.5 million births in five regions of the UK. Cases of cerebral palsy were divided into those acquired postnatally and those present at birth. For the former, the OR, comparing extreme quintiles based on the Carstairs score at electoral ward level, was 1.86 (95% CI 1.19 to 2.88). For non-acquired cases, the association with deprivation had the corresponding OR of 1.16 (95% CI 1.00 to 1.35). When this was adjusted for birth weight, it was reduced to 1.05 (95% CI 0.86 to 1.29), a non-significant result. This suggests that the effect of deprivation acts largely through low birth weight. There was evidence of considerable heterogeneity between regions, and this requires further investigation to seek possible explanations.
Infant mortality
Infant mortality is traditionally classified by the age of the child at death. Neonatal mortality refers to deaths up to 27 days after the birth, with those up to day 6 classed as early neonatal; the remaining neonatal deaths are termed late neonatal. Those after 27 days but up to a year are called postneonatal, while infant deaths are those between birth and a year. A stillborn baby is a baby born after the 24th week of pregnancy who does not show any signs of life. Perinatal mortality combines stillbirths and early neonatal deaths. An analysis of infant mortality needs to be separated into these different time periods as any possible effects of deprivation may operate differently in the neonatal period from the postneonatal period, for example.
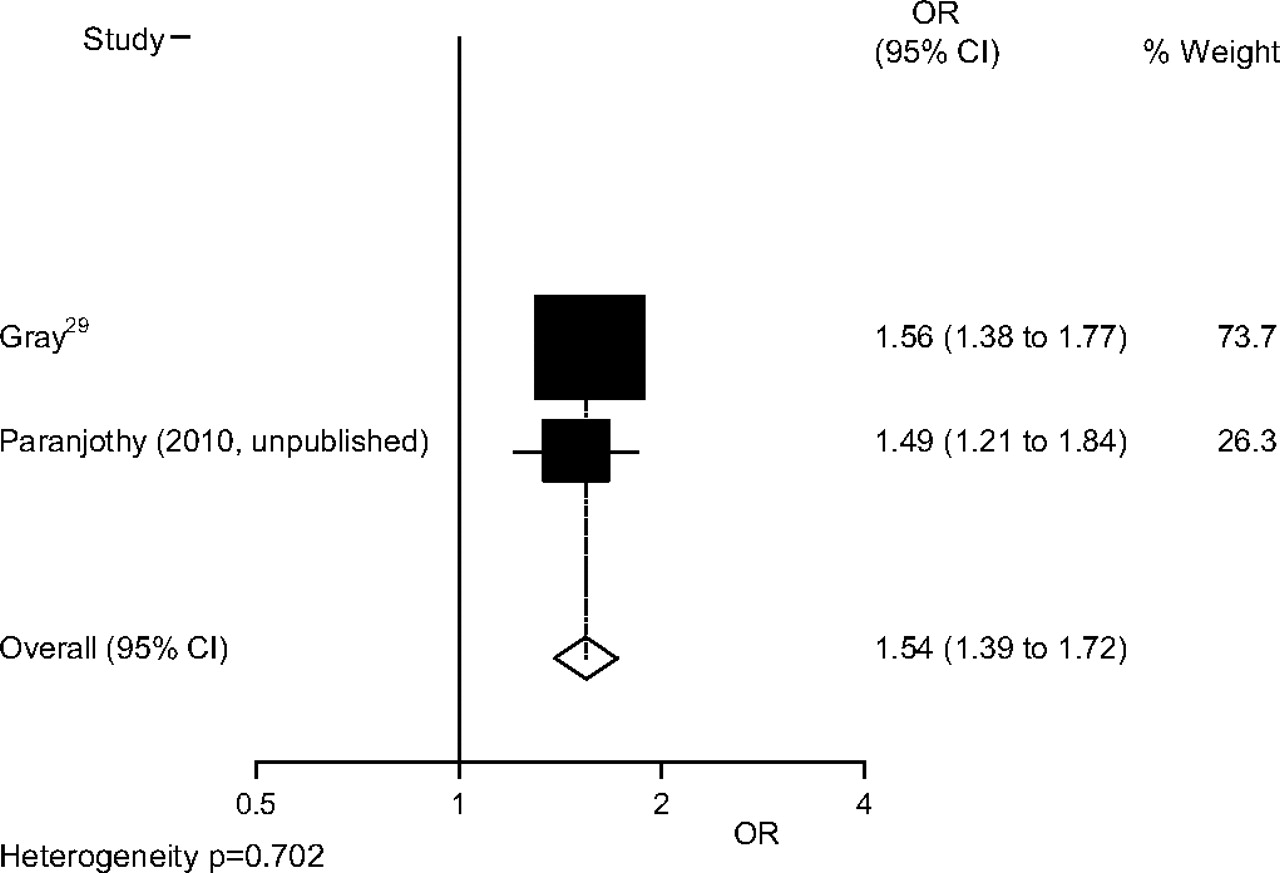
For stillbirths, there were four studies (Paranjothy, 2010, unpublished)29 ,47 ,48 all of which postdate the change in definition resulting from the Still-Birth (Definition) Act of 1992; when births from 24-week gestation were included, the data by Guildea et al47 were subsumed by that of Paranjothy. Published data from Guildea et al47 are, however, included in the Evidence Table (online appendix 1). Gray et al,29 using data from Scotland from 1994 to 2003, found an OR of 1.56 (95% CI 1.38 to 1.77) comparing extreme quintiles based on Carstairs scores calculated for postcode sectors. Paranjothy (2010, unpublished) found a very similar OR of 1.54 (95% CI 1.32 to 1.80) comparing extreme quintiles of the Townsend score calculated for lower super output areas. Combining these two studies (Paranjothy, 2010, unpublished),29 a pooled estimate of the OR is 1.54 (95% CI 1.39 to 1.72) (figure 6).

Stillbirth versus area deprivation.
Smeeton et al48 used a case–control study in a Health Authority in London to study stillbirths, using the Jarman score to measure deprivation. The presumption is that the results were not statistically significant as no useable data were shown.
Bambang et al49 was most concerned with specific causes of perinatal death in one English region; the association with deprivation varied relatively little with cause, and combining the causes gave an OR of 1.91 (95% CI 1.66 to 2.20) comparing extreme quintiles based on Townsend scores.
Four studies36 ,40 ,47 ,48 examined early neonatal death as a separate outcome; all but Smeeton also considered late neonatal mortality. Two of these studies40 ,47 found that the risk of late neonatal mortality was higher in more deprived areas, with very different ORs. Generally, results varied considerably and details are shown in online appendix 1. There was more evidence for an association of deprivation with late neonatal than early neonatal deaths.
Whitehead and Drever38 gave results for perinatal mortality, which includes stillbirths and early neonatal deaths within 7 days of birth. Using data on over 14 million births from a 22-year period from England and Wales, they found an OR of 1.35 (95% CI 1.30 to 1.40).
Whitehead and Drever38 also compared overall neonatal mortality between classes IV and V and classes I and II. The rate was significantly higher in classes IV and V, with an OR of 1.41 with approximate 95% CI 1.32 to 1.51. As about 75% of neonatal deaths are early neonatal deaths, it is likely that an association existed with early neonatal death. Gray et al29 studied over 500 000 births in Scotland between 1994 and 2003; the OR for comparing quintiles based on Carstairs–Morris scores was 1.37 (95% CI 1.16 to 1.62). Oakley et al37 took all 1 276 198 singleton births in England and Wales in 2005 and 2006 and found an OR of 2.00 (95% CI 1.79 to 2.24) comparing quintiles based on Carstairs scores. For a 10% sample, those who are routine or manual workers were compared with the category of Higher and Professional workers; the OR was 1.54 (95% CI 1.20 to 1.98). Smith et al39 took all live births in England between 1997 and 2007, more than 6 million in total. Comparing the most extreme quintiles, based on the Index of Multiple Deprivation, the OR was 2.19 (95% CI 2.09 to 2.29). Dummer and Parker36 found an OR of 1.28 (95% CI 0.82 to 2.01) comparing extreme deprivation quintiles in Cumbria. A meta-analysis was performed but Oakley et al37 was omitted, as its study population was largely subsumed by that of Smith et al.39 The pooled OR, comparing the extreme quintiles from these three studies,29 ,36 ,39 was 1.61 (95% CI 1.08 to 2.39) (figure 7).

Neonatal mortality versus area deprivation.
A meta-analysis comparing the extremes of social class from three studies looking at neonatal mortality36–38 gave a pooled OR of 1.42 (95% CI 1.33 to 1.51) (figure 8).
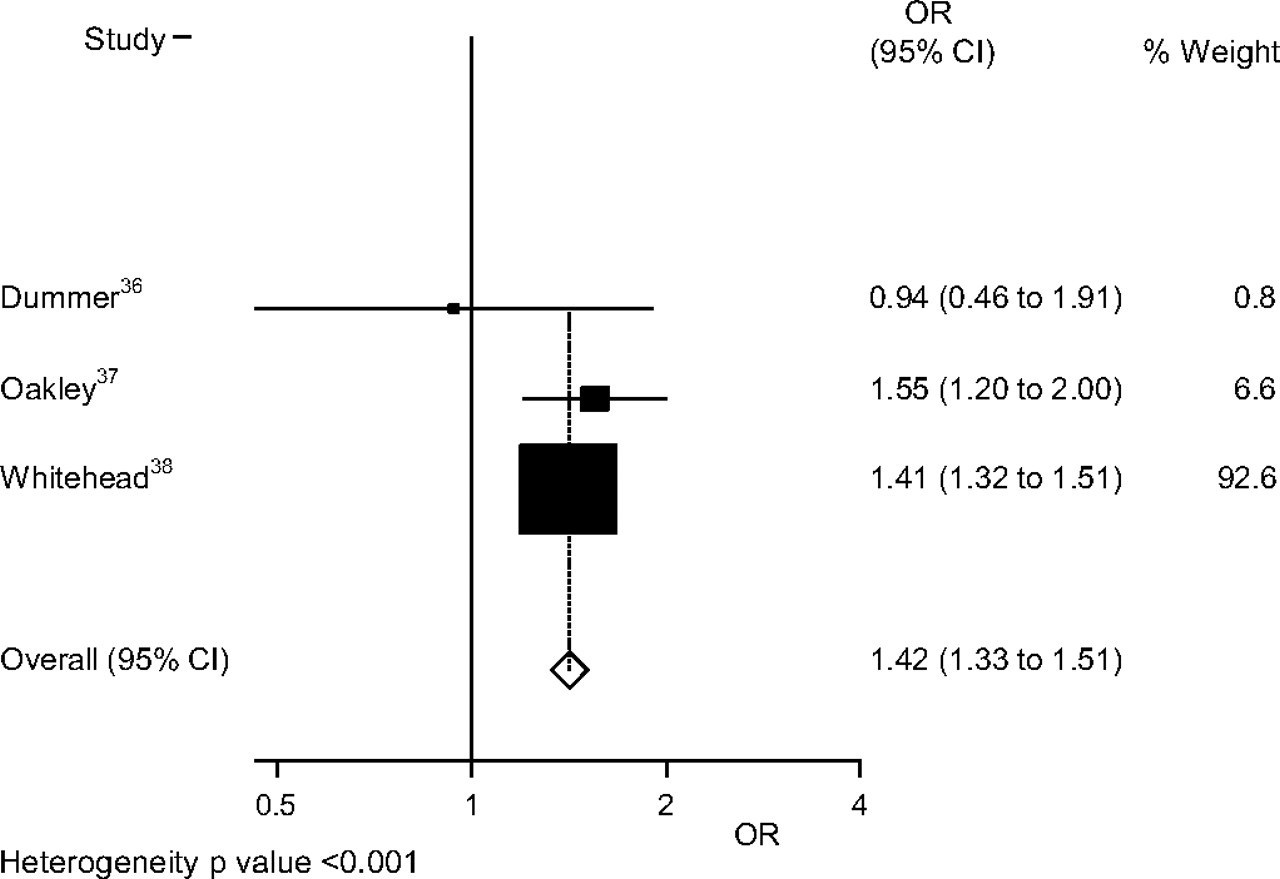
Neonatal mortality versus social class.
In summary, there does seem to be evidence for an effect of both area deprivation and social class on neonatal mortality, although there is considerable heterogeneity between studies.
Six studies29 ,36–38 ,40 ,47 assessed the effect of deprivation on postneonatal mortality. All found that the unadjusted rates were significantly higher in the most deprived areas compared with the least deprived, with ORs of 2.26 (95% CI 1.29 to 3.93) in Dummer and Parker,36 2.20 (95% CI 1.77 to 2.72) in Guildea et al,47 2.55 (95% CI 2.01 to 3.23) in Gray et al29 and 2.21 (95% CI 1.87 to 2.61) in Oakley et al.37 The data from Guildea et al47 were not available in a form that could be included in the meta-analysis. A pooled OR was 2.31 (95% CI 2.03 to 2.64) for the other three studies29 ,36 ,37 (figure 9). If raw data from Paranjothy (2010, unpublished) are included, which represent (and subsume) the Guildea et al47 population, the pooled OR is very similar, 2.28 (95% CI 2.04 to 2.56).
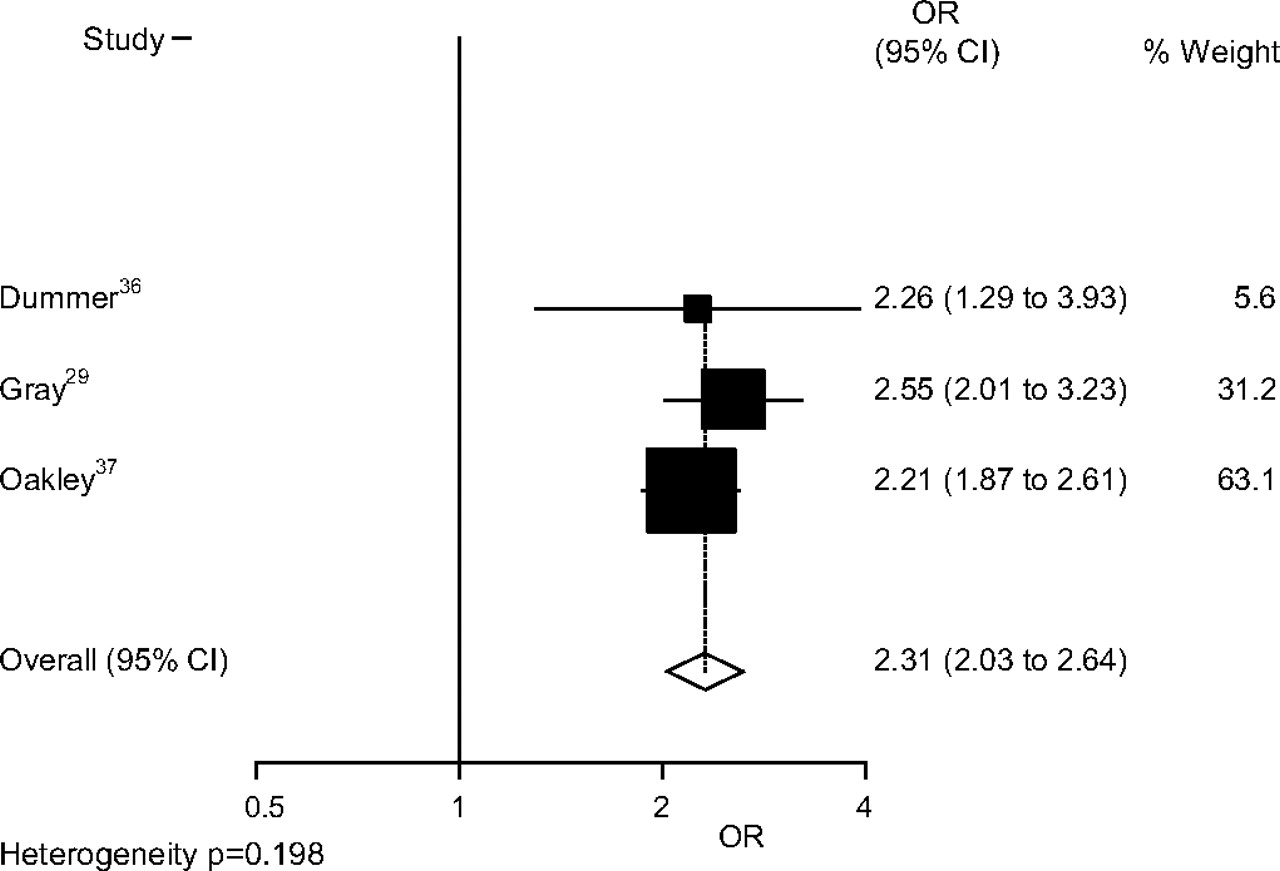
Postneonatal mortality versus area deprivation.
Comparing social class, Dummer and Parker36 found an OR of 2.24 (95% CI 0.81 to 6.23) and Petrou et al40 recorded 1.70 (95% CI 1.14 to 2.54) comparing classes V and I. Whitehead and Drever38 found an OR of 1.69 (95% CI 1.52 to 1.88) for comparing classes IV and V with I and II. Oakley et al37 used the newer NS_SEC classification19 and compared Higher and Professional with Routine and manual, finding an OR of 2.63 (95% CI 1.41 to 1.91). The pooled OR was 1.69 (95% CI 1.53 to 1.87) (figure 10). Petrou et al40 and Oakley et al37 adjusted for a number of factors, leading to reductions in the estimated ORs as shown in online appendix 1.

Postneonatal mortality versus social class.
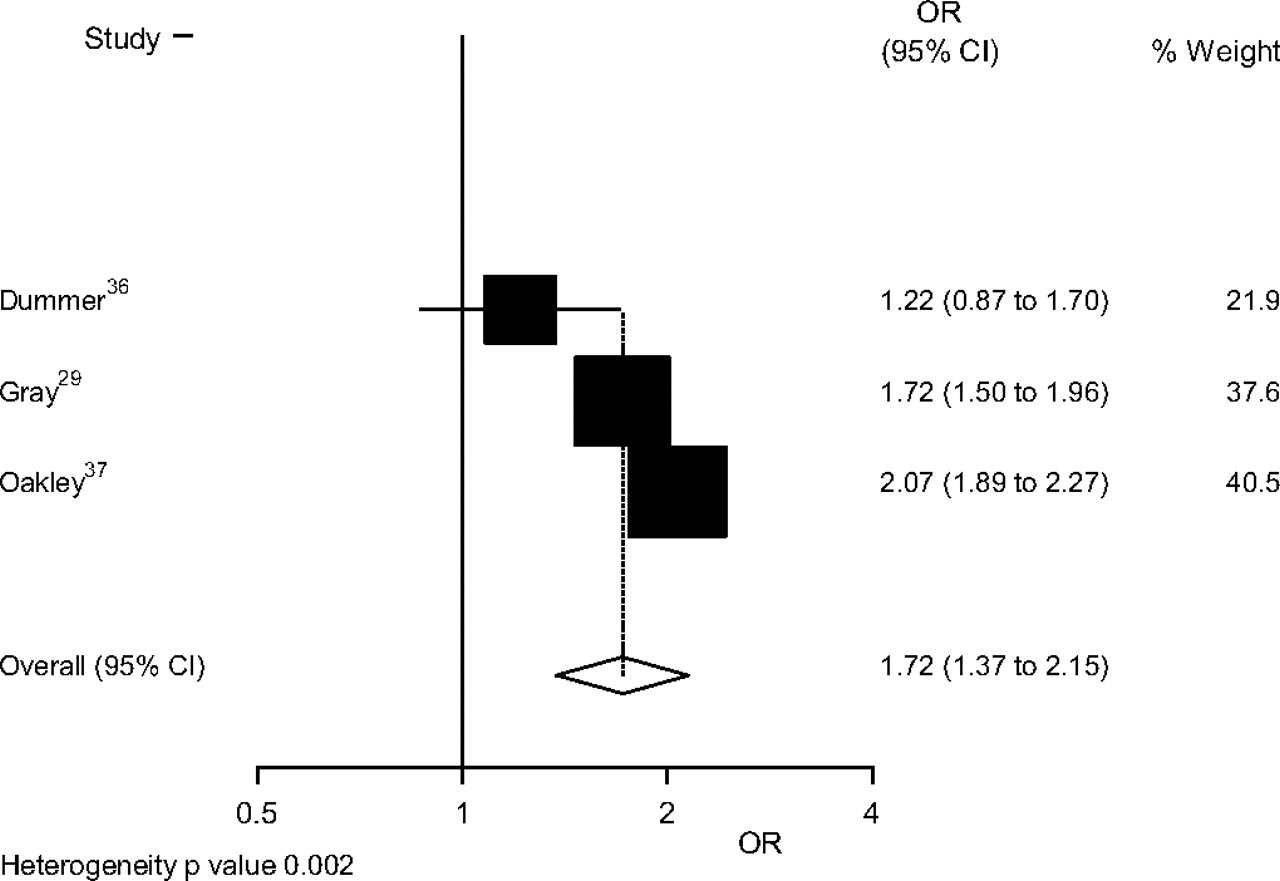
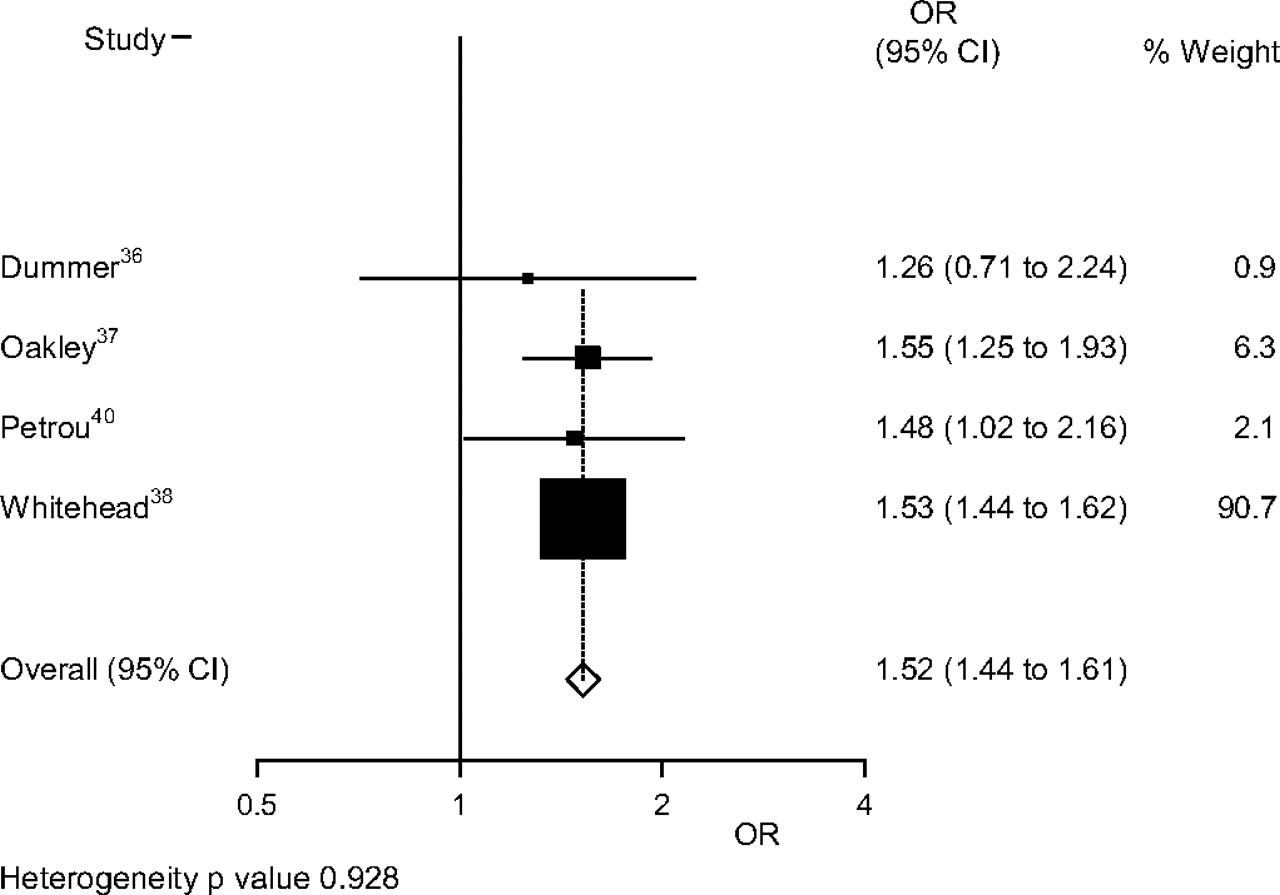
Many of these studies also gave results for overall infant mortality. Combining their results, the pooled OR was 1.72 (95% CI 1.37 to 2.15) for comparing extreme quintiles of deprivation29 ,36 ,37 (figure 11) and 1.52 (95% CI 1.44 to 1.61) for comparing the extreme social classes36–38 ,40 (figure 12).
Overall infant mortality versus area deprivation.

Overall infant mortality versus social class.
Neonatal admissions
Two studies examined associations between neonatal admissions and deprivation. Manning et al,50 in a study on the Wirral in England, showed a strong linear association between deprivation, based on quartiles of Townsend scores, and the rate of neonatal admissions. The OR comparing the most and least deprived quartiles was 1.91 (95% CI 1.71 to 2.11). Jenkins et al51 examined intensive care neonatal admissions in Northern Ireland, dividing wards into quintiles based on the Northern Ireland Multiple Deprivation index.52 There was no clear pattern of the rate of admissions by quintile for the four least deprived quintiles, but the admission rate in the most deprived quintile was significantly higher than in other quintiles with an OR of 1.22 (95% CI 1.11 to 1.33) relative to the least deprived quintile. In both studies, one of the most common causes for admission was prematurity and so the strong association of prematurity with deprivation is clearly a factor.
Sudden infant death syndrome
Sudden infant death syndrome (SIDS) is a common cause of death in infancy, especially in the postneonatal period when, in spite of reducing incidence, from one recent study it accounted for about 30% of deaths in 2004–2008 (Paranjothy, 2010, unpublished). Guildea et al47 found a strong association with deprivation with an OR of 3.07 (95% CI 1.97 to 4.56) comparing extreme quintiles based on the Townsend score. Sanderson et al53 compared areas of poverty with those not of poverty and found an OR of 2.33 (95% CI 1.06 to 5.11); the definition of an area of poverty was not clear and so this is hard to compare with Guildea's result. Blair et al54 analysed a population-based case–control study and found an OR of 18.49 (95% CI 3.62 to 94.48) for overcrowding, one aspect of deprivation. The definition used here was quite extreme, based on at least two people per room in a house, and a less extreme one may give a smaller OR. Brooke et al55 also used a case–control study. Deprivation was assessed using Carstairs–Morris scores,17 and the most deprived group had a significantly higher risk of SIDS than the remainder, even after adjustment for other factors, though the definition of the group was not clear. For social class, there was a significantly higher risk in classes IV and V than I and II in a univariate analysis; the OR remained >1 but was no longer significant in a multivariate analysis. Smith et al39 looked at SIDS in the neonatal period, though the great majority occur later. Comparing the extreme quintiles, the OR was 2.20 (95% CI 1.66 to 2.91). Fleming et al56 used a case–control study to examine risk factors. Comparing social classes V and I, the OR was 13.74 (95% CI 4.80 to 39.34). Using receipt of income support as a measure of individual deprivation, the OR was 4.80 (95% CI 3.68 to 6.25). Finally, Blair et al57 carried out a case–control study which explored individual deprivation measures. The OR for SIDS in infants from social classes IV, V or never employed versus social classes I–III was 3.64 (95% CI 1.84 to 7.21). This became non-significant in a multivariate analysis. There is clearly great heterogeneity here, perhaps arising from different measures of deprivation, and no meta-analysis has been performed.
Overall, there appears to be some evidence for an association in keeping with the findings of an earlier worldwide systematic review, which found a link between deprivation and SIDS in 51 of 52 case–control and cohort studies.58
Failure to thrive
Two analyses of the same Avon Longitudinal Study of Parents and Children cohort of children were published.59 ,60 Their definition of failure to thrive was based on the rate of growth, conditional on birth weight to allow for regression to the mean effects. They considered birth to 8 weeks and 8 weeks to 9 months separately and also jointly, leading to a large number of comparisons. No overall association with social class was found.
Wright et al61 also used standardised rates of growth conditional on birth weight, through their thrive index, on a small birth cohort of 923 children in Gateshead, analysed by Townsend quintile. They regressed the thrive index on quintile of deprivation and reported a significant result, but the relationship appeared to be U-shaped and so interpretation is complex. An earlier study by the same group42 on a different population did find a statistically significant result. The OR for failure to thrive at 12 months for most deprived versus intermediate area deprivation levels was 2.15 (95% CI 1.46 to 3.14). However, there was a wide variation in results at earlier ages, and those in more affluent areas had lower weight gain than in intermediate areas.
Wheeze
A single study62 suggested a potential link between both rented housing and lower maternal education (up to and beyond GCSE stage) and wheeze in infants with ORs of 1.45 (95% CI 1.28 to 1.66) and 1.12 (95% CI 1.00 to 1.27), respectively.
Diarrhoea
A single study62 found a significant association between diarrhoea incidence and lower maternal education (OR 1.32, 95% CI 1.19 to 1.45).
Discussion
This review quantifies the evidence of inequalities in the health of infants in the UK. The socioeconomic circumstances in which an infant is conceived and born have a major effect on their early life chances and may have life course impacts.
Principal findings
The analysis demonstrates that a large number of health outcomes for UK infants are closely linked to measures of social disadvantage. There is a strong indication that the effect of social disadvantage can be measured via a range of social determinants (individual and area based) and health outcomes (eg, low birth weight, infant mortality) and found to be similar. These results are not surprising, given that prematurity, low birth weight and infant morbidity and mortality are extremely closely linked.39 ,63 ,64 As many as two-thirds of neonatal deaths in England and Wales in 2006 were accounted for by prematurity.65 Furthermore, some studies show that the magnitude of effect of social disadvantage on low birth weight is durable and has not markedly changed since the early 1980s.28 ,31 The only infant health outcome which may not follow this pattern is failure to thrive, where there was no clear link based on evidence from the three cohorts identified.42 ,60 ,61
For most outcomes, the association with area deprivation was quite similar to that with social class. Social class is an individual characteristic and might be expected to have a stronger association, but it is different from the factors that are combined to give an area deprivation score. Area scores are often criticised as they are ecological measures, but the results here are quite reassuring about its use in large studies. It might be expected that when a small area was used as the basis of a deprivation score, the resulting measure would better reflect the deprivation of individuals living there than if a larger area was used. However, there was no obvious variation in its effect with the size of the areas, though these were mostly quite small. Since few studies reported an analysis in which both individual and area measures were incorporated into a single analysis, it is difficult to add to the debate about the relative importance of area and individual characteristics on health outcomes.66
Many of the meta-analyses showed heterogeneity so that results varied more than might be expected by chance. Random effects models allow for this to some extent but identifying, and if possible modelling, the causes of heterogeneity is better practice. In most cases, there was insufficient detail available to do this. In the case of preterm births, the different definitions of the outcome could lead to heterogeneity. In other cases, there was variation in the comparisons of deprivation levels, as noted in low birth weight and social class. The effects of deprivation could also vary between areas in which studies were carried out and that might be another cause of heterogeneity.
Based on the results of this review, it can be strongly argued that no more epidemiological research needs to be carried out in the UK to address this general effect of area and individual measures of social deprivation on birth and infant mortality outcomes. Further research should seek to explore less researched areas such as any specific area effects and, most importantly, to explore the effect of interventions on those factors that are more proximal to maternal and infant health. This may help to throw light on the most appropriate times to provide support and the form(s) that such support should take.
Such studies could usefully build on recent research examining behavioural change interventions regarding the known intermediate determinants of infant health, for example, maternal nutrition and overweight,67–69 and smoking.29 ,67 The impact of teenage pregnancy, which is high in the UK relative to other countries, is also strongly associated with social disadvantage.70 A recent review exploring rates of stillbirth found that maternal overweight and smoking appear to be linked to around 8000 and 2800 stillbirths annually, respectively, in the five high-income countries of Australia, Canada, the USA, the UK and the Netherlands.67
Another potential determinant is maternal stress. There is now clear evidence of the association of maternally reported stress,71–73 domestic violence74 and unintended pregnancies73 with preterm birth or low birth weight. Although the evidence is yet to be definitive, there are a number of well-established hypothetical but evidence-based biological pathways for stressors leading to preterm birth, essentially related to hormonal, immune and vascular disfunction.75
Antenatal interventions carried out to date within high-income countries for socially disadvantaged women are few in number and of varying quality. In a Cochrane review, of support during pregnancy for women at risk of low birthweight babies, Hodnett et al76 suggested that the women involved in the trials exhibit such a degree of deprivation that the support programmes evaluated are just not powerful enough to overcome the disadvantage experienced.
Nevertheless, there are promising approaches. Further exploration of WHO Baby Friendly Hospital Initiative (BFI) in properly evaluated and controlled settings appears to be warranted.77 In a recent systematic review of 36 studies, the authors concluded that, while there is insufficient evidence to recommend any particular programme at the moment, some targeted antenatal care programmes are promising and warrant rigorous evaluation.78 Harden et al79 concluded that there is promise for appropriately designed early childhood interventions and youth development programmes to reduce unintended teenage pregnancy, especially if such interventions take into account the known views and emotions correlated with teenage pregnancy, such as dislike of school, low expectations of life and poor material circumstances.
Given the pervasive impact of socioeconomic conditions on almost all aspects of child health and development, unless justified to the contrary, all studies of population health, including routinely collected population data, should include robust measures of socioeconomic status and maternal and infant stress levels. Intervention outcomes should also be analysed for differential effects as well as taking into account other influences, such as a tendency to low birth weight across generations, which may be independent of economic conditions.80
Comparison with other studies
The findings of the review in terms of social disadvantage and low birth weight are remarkably similar to the findings of studies within the Republic of Ireland81 and to a recent global review of reviews carried out by the Canadian Institute of Health Economics82 which also concluded that the causes of low birth weight are multifactorial and closely inter-related. In addition, these results are very much in keeping with a recent review of worldwide studies published to 200783 which concluded that socioeconomic differences in low birth weight and preterm birth remain pervasive at both individual and neighbourhood levels with 93/106 studies reporting a significant association.
Conclusions and implications
It is anticipated that the results of this review will be of interest and value to policy makers and all involved directly with the care of infants and young children, as well as funders of research in this area, with two key implications emerging. First, given the clear association between child health outcomes and social disadvantage at individual and area level, governments must continue to focus on tackling social determinants, which in turn will require a cross cutting approach that includes those working in health, education, child poverty and other related policy portfolios.
Second, the absence of research on interventions through which the effects of disadvantage might be mediated is a serious shortcoming of appropriately designed interventional research.82 Further research is urgently required to evaluate approaches to intervention, including individual behavioural studies and studies of more upstream approaches that seek to alter the material and environmental conditions before and immediately after birth. It is imperative that policy is designed and rolled-out in a manner which allows the best possible chance of a robust assessment of outcomes and costs.84 ,85
Acknowledgments
The authors acknowledge, with thanks, contributions by Samia Addis (Cardiff Institute of Society and Health, Cardiff University) and Fiona Morgan (Support Unit for Research Evidence, Cardiff University) to early drafts of the review. We also acknowledge valuable contributions from researchers active in the field who reviewed the initial list of included studies and suggested other studies that should be screened: Sohinee Bhattacharya, Manning Donal, Ron Gray, Lucy Smith and Charlotte Wright. Lucy Smith read through and commented on the draft of the paper.
References
Supplementary materials
Supplementary Data
This web only file has been produced by the BMJ Publishing Group from an electronic file supplied by the author(s) and has not been edited for content.
Files in this Data Supplement:
- Data supplement 1 - Online Appendices 1 and 2
Footnotes
To cite: Weightman AL, Morgan HE, Shepherd MA, et al. Social inequality and infant health in the UK: systematic review and meta-analyses. BMJ Open 2012;2:e000964. doi:10.1136/bmjopen-2012-000964
Contributors HK, HEM and ALW carried out the literature searching and selected relevant papers. FDD, HEM, MAS and ALW completed critical appraisal, data extraction and summary of the included studies. FDD carried out statistical analyses including meta-analyses of studies where feasible. The author from the Welsh Government (CR) contributed to the conception of the study, drafted and revised sections on the policy context. He had no role in the searching, analysis or interpretation of data. Each author's contribution to the paper meets the three ICMJE guidelines for authorship. All were responsible for drafting sections of the article, revising it critically for important intellectual content and approving the final version for publication.
Funding Funding from the Welsh Government was received in partial support of preparation and publication costs. No grant number is available. All authors completed the unified competing interest form. FDD does consultancy for Jacob, Medinger and Finnegan and MAS does consultancy for the Welsh Government. There are no other relationships or activities that could appear to have influenced the submitted work. The researchers operated independently from the funders and views expressed in the paper are those of the authors, based on the evidence reviewed, and are not necessarily those of the Welsh government.
Competing interests None.
Provenance and peer review Not commissioned; externally peer reviewed.
Data sharing statement All original data extraction and critical appraisal forms are available from the corresponding author. Dryad doi is 10.5061/dryad.35db6.