Article Text

Abstract
Objectives To examine trends in social and geographic inequalities in all-cause premature adult mortality in Japan.
Design Observational study of the vital statistics and the census data.
Setting Japan.
Participants Entire population aged 25 years or older and less than 65 years in 1970, 1975, 1980, 1985, 1990, 1995, 2000 and 2005. The total number of decedents was 984 022 and 532 223 in men and women, respectively.
Main outcome measures For each sex, ORs and 95% CIs for mortality were estimated by using multilevel logistic regression models with ‘cells’ (cross-tabulated by age and occupation) at level 1, 8 years at level 2 and 47 prefectures at level 3. The prefecture-level variance was used as an estimate of geographic inequalities of mortality.
Results Adjusting for age and time-trends, compared with production process and related workers, ORs ranged from 0.97 (95% CI 0.96 to 0.98) among administrative and managerial workers to 2.22 (95% CI 2.19 to 2.24) among service workers in men. By contrast, in women, the lowest odds for mortality was observed among production process and related workers (reference), while the highest OR was 12.22 (95% CI 11.40 to 13.10) among security workers. The degree of occupational inequality increased in both sexes. Higher occupational groups did not experience reductions in mortality throughout the period and was overtaken by lower occupational groups in the early 1990s, among men. Conditional on individual age and occupation, overall geographic inequalities of mortality were relatively small in both sexes; the ORs ranged from 0.87 (Okinawa) to 1.13 (Aomori) for men and from 0.84 (Kanagawa) to 1.11 (Kagoshima) for women, even though there is a suggestion of increasing inequalities across prefectures since 1995 in both sexes.
Conclusions The present findings suggest that both social and geographic inequalities in all-cause mortality have increased in Japan during the last 3 decades.
This is an open-access article distributed under the terms of the Creative Commons Attribution Non-commercial License, which permits use, distribution, and reproduction in any medium, provided the original work is properly cited, the use is non commercial and is otherwise in compliance with the license. See: http://creativecommons.org/licenses/by-nc/2.0/ and http://creativecommons.org/licenses/by-nc/2.0/legalcode.
Statistics from Altmetric.com
Article summary
Article focus
While Japan enjoys the highest average life expectancy in the world, less has been documented on the trends and patterns of health inequalities within the nation.
We examined trends in social and geographic inequalities in all-cause premature adult mortality from 1970 through 2005.
Key messages
This is the first study that simultaneously examines time-trends in premature mortality by occupational class as well as geographic locality, and the results of our study indicate that health disparities have widened during the decades following the collapse of the asset bubble in the early 1990s.
Given the multiple challenges that threaten to further dampen economic activity of the nation, it is imperative to continue to monitor future trends in health inequalities in order to avert the potential impacts on Japan's health security.
Strengths and limitations of this study
The data are census based and cover the whole of Japan from 1970 to 2005.
This study uses multilevel methods to properly adjust for micro- and macro-level bias simultaneously.
We lacked information on whether the individuals were in standard jobs or precarious jobs and a possibility of measurement error in occupation at the time of death cannot be ruled out.
Introduction
The postwar Constitution (1946) of Japan made equality a primary objective of the health system, and by 1961, the country achieved universal and compulsory health insurance coverage.1 Although Japanese longevity was well below that of most European countries in 1960, subsequent health gains enabled the country to overtake other nations to the point where Japan reached the top of the national life expectancy rankings by 1985.1 2 During the period of rapid economic growth (mid-1960s to 1989), Japan's social and economic policies helped to create a broad middle class with secure (often life-long) employment and comparatively egalitarian growth in living standards across the income spectrum.1 3 Following the collapse of the asset bubble in the early 1990s, however, Japan's economy has been characterised by persistently low growth accompanied by a marked increase in the number of precarious workers (ie, non-standard jobs such as part time and contingent workers), from 1 in five employees in the 1990s to 1 in three employees by 2005.4 The period since the collapse of the asset bubble—now referred to as the ‘Lost Two Decades’—has been characterised by a widening of income disparities and the emergence of a new class of ‘working poor’ hitherto unrecognised in Japanese society.5 In retrospect, the post-War period of comparatively egalitarian economic growth appears to have lasted about 40 years, and today, Japan ranks closer to countries such as the USA and the UK in terms of indicators of relative poverty, such as poverty rate and poverty gap.6
While there are considerable studies documenting social and geographic inequalities in mortality in other industrialised countries,7–12 we are not aware of a similar comprehensive assessment of the trends in health inequalities in Japan that may have accompanied the major macroeconomic changes.13 In this study, by using occupations as an indicator of socioeconomic position,14 we examine the trends in occupational and geographic inequalities of all-cause premature adult mortality from 1970 through 2005. Since premature adult mortality focuses on death occurring at younger ages, they constitute a useful measure in public health as well as preventive medicine.15
Methods
Data
Data on deaths were obtained from the Report of Vital Statistics: Occupational and Industrial Aspects,16 which has been conducted by the Ministry of Health, Labour and Welfare every 5 years since 1970, coinciding with the years of the Population Census. The latest year for which data are available is 2005. In the notification of deaths, the respondents are asked to fill in the occupation of decedent at the time of death,17 and one of the following persons is obliged to submit the notification: (1) relatives who live together with decedents, (2) other housemates, (3) landlord, estate owner, land/house agent, or (4) relatives who do not live together with decedents. The occupation at the time of death is recorded for each decedent following the Japan Standard Occupational Classification.18 During the follow-up period, the occupational classification scheme underwent four revisions (supplementary table 1).18 In this study, we used the fourth revision of the Occupational Classification, which includes the following 11 groups18: (1) specialist and technical workers, (2) administrative and managerial workers, (3) clerical workers, (4) sales workers, (5) service workers, (6) security workers, (7) agriculture, forestry and fishery workers, (8) transport and communication workers, (9) production process and related workers, (10) workers not classifiable by occupation and (11) non-employed. (The full description of each occupational group is available on-line in English.18) Note that the group ‘production process and related workers’ includes mining workers. Note also that the group ‘non-employed’ includes the unemployed as well as non-labour force (eg, home makers, students and the retired). Although the census distinguishes the unemployed from home makers, the vital records combine these categories as ‘non-employed’. We restricted the analysis to those who are aged 25 years or older and <65 to exclude students as well as the retired. The total number of decedents was 984 022 and 532 223 in men and women, respectively (supplementary figure 1 and supplementary table 2).
Denominator data for the calculation of mortality rates were obtained from the Population Census which has been conducted by the Ministry of Internal Affairs and Communications every 5 years since 1920.19 In the questionnaire for the census, the occupation was assessed by asking a following question19: “Description of work—Describe in detail the duties you are assigned to perform.” The questionnaires are delivered to each household, and someone in each household answers the question. We used ‘production process and related workers’ as the referent category since they were the largest occupational category in a majority of the time periods (supplementary table 3).
Analysis
The data had a three-level multilevel structure of 32 590 cells for men and 32 542 cells for women at level 1, nested within 8 years at level 2, nested within 47 prefectures at level 3. The 8 years comprised of 1970, 1975, 1980, 1985, 1990, 1995, 2000 and 2005. Each year had a maximum 88 cells (eight age groups times 11 occupational groups) (supplementary table 4). Note that the numbers of deaths for each cell are recorded during one fiscal year. For the descriptive purpose, we first calculated age-adjusted mortality rates by occupational class by year and sex (supplementary table 5). We used the direct method, using the model population of 1985 as a reference.20 The model population of 1985 is based on the Japanese population under census of 1985 and it is created on the basis of 1000 persons as 1 unit, after adjusting radical increase or decrease such as baby boom.21 We then employed multilevel statistical procedures because of their ability to model complex variance structures at multiple levels.22 In the present analysis, they allow estimation of the relationship between mortality and occupation, conditional on individual age variation (‘fixed parameters’) and year- and prefecture-level variations (‘random parameters’). They also enable an estimation of the extent to which the relationship between mortality and occupation varies across years and prefectures (random parameters) and the degree to which prefecture-level socioeconomic status explains this variation (fixed parameters). The unit of analysis was ‘cells’, and our models were structurally identical to models with individuals at level 1.23
The response variable, proportion of deaths in each cell, was modelled with allowances made for the varying denominator in each cell. The fixed and random parameter estimates (along with their SEs) for the multilevel binomial logit link model were calibrated using predictive/penalised quasi-likelihood procedures with second-order Taylor series expansion, as implemented within the MLwiN 2.22.24 Results are presented as ORs and 95% CIs. A p value of <0.05 (two-sided test) was considered statistically significant.
First, we conducted three-level analysis as an overall model, with cells at level 1, years at level 2 and prefectures at level 3. The prefecture-level variance was used as an estimate of geographic inequalities of mortality. Prefectures were ranked by ORs having the whole country of Japan as reference (value =1), and uncertainty was estimated by 95% CIs. Further, to examine the temporal patterns of occupational and geographic inequality of mortality across years, we also conducted two-level analysis, with cells at level 1 and prefectures at level 2 separately for each year.
Then, to explore the temporal change of occupational inequality, we ran a three-level multilevel model including a fixed cross-level interaction effect between the 11 occupations (at level 1) and year (at level 2). In this analysis, we modelled the year as a continuous variable, and we calculated mean predicted probabilities for mortality among those aged 25–29 years (referent category).
To present the results of geographic inequality in all-cause mortality, we created maps showing prefecture-level residuals by using the ArcGIS (ESRI Japan Inc., V.9.3).
Results
Social inequality of mortality
Table 1 shows the results of social inequality of all-cause premature mortality in terms of occupation from overall model as well as year-specific models in multilevel analyses. Excluding workers not classifiable by occupation and non-employed, there were substantial health disparities by occupations in both sexes. Adjusting for age and time-trends in the overall model, compared with production process and related workers, ORs ranged from 0.97 (95% CI 0.96 to 0.98) among administrative and managerial workers to 2.22 (95% CI 2.19 to 2.24) among service workers in men. Among women, the lowest odds for mortality was observed among production process and related workers (reference), while the highest OR was 12.22 (95% CI 11.40 to 13.10) among security workers.
ORs for all-cause premature mortality in each occupation, Japan, 1970–2005*
The degree of occupational inequality increased in both sexes. Among men, in 1970, the lowest OR was 0.54 (95% CI 0.53 to 0.56) among administrative and managerial workers, while the highest OR was 1.34 (95% CI 1.32 to 1.37) among agriculture, forestry and fishery workers. In 2005, however, the lowest odds for mortality was observed among production process and related workers (reference), whereas the highest OR was 3.97 (95% CI 3.84 to 4.11) among service workers. Among women, the lowest odds for mortality was observed among production process and related workers (reference) throughout the follow-up period, and the highest ORs in 1970 and 2005 were 11.43 (95% CI 9.14 to 14.29) and 16.25 (95% CI 13.65 to 19.34), respectively, among security workers.
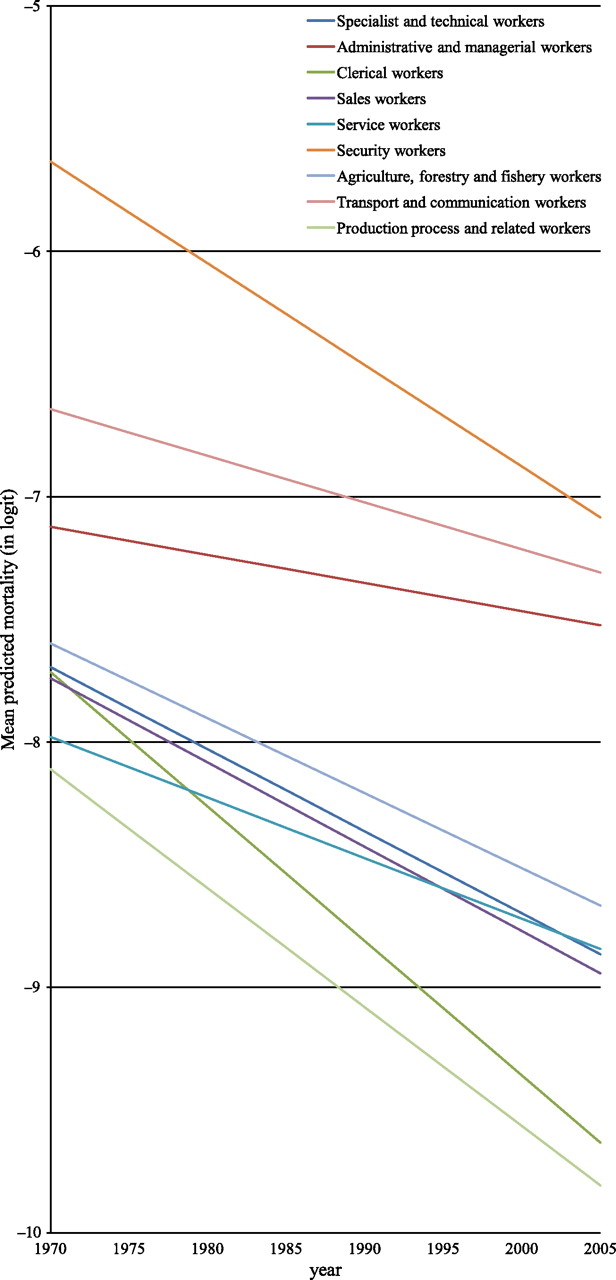
The widening social inequalities can be more clearly seen in figures 1 and 2, which show the temporal pattern of these occupational inequalities across years. We excluded workers not classifiable by occupation and non-employed from these figures to enhance readability although they were included in the analysis. Among men, the mortality risk among three occupations (specialist and technical workers, administrative and managerial workers and service workers) remained unchanged, whereas those of other occupational groups declined more or less. Especially, in addition to the workers not classifiable by occupation, three occupations (clerical workers, sales workers and product process and related workers) experienced a considerable decline in mortality risk between 1970 and 2005.

Predicted mortality by occupations in men, Japan, 1970–2005. We show mean predicted probabilities for all-cause premature mortality by nine occupational groups among those aged 25–29 years (referent category). We excluded workers not classifiable by occupation and non-employed from the figure. Note that -5, -6, -7, -8, -9, and -10 in logit correspond to 0.669%, 0.247%, 0.091%, 0.034%, 0.012%, and 0.005%, respectively.

Predicted mortality by occupations in women, Japan, 1970–2005. We show mean predicted probabilities for all-cause premature mortality by nine occupational groups among those aged 25–29 years (referent category). We excluded workers not classifiable by occupation and non-employed from the figure. Note that -5, -6, -7, -8, -9, and -10 in logit correspond to 0.669%, 0.247%, 0.091%, 0.034%, 0.012%, and 0.005%, respectively.
By contrast, trends in mortality by occupational groups were more stable for women. Most occupations experienced the comparable trajectories during the period although administrative and managerial workers experienced relatively small declines in mortality risk. Specialist and technical workers and service workers also experienced declines in mortality risk among women although they remained on a plateau among men.
Geographic inequality of mortality
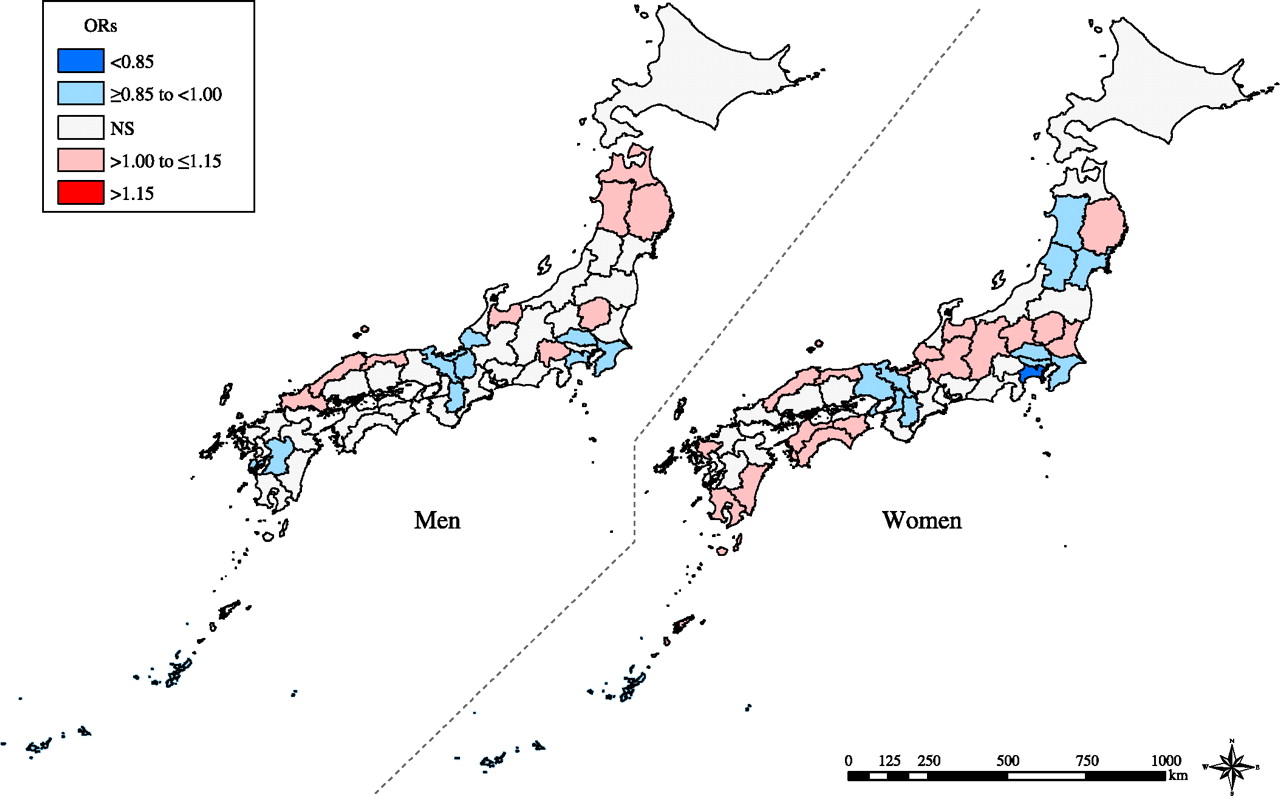
Conditional on individual age and occupation, overall geographic inequalities of mortality were relatively small across prefectures in both sexes, with slightly larger geographic inequality among women than men (table 2). Note that tables 1 and 2 are based on the same multilevel models, showing the results of fixed and random parts, respectively. Prefecture-specific ORs ranged from 0.87 (Okinawa prefecture) to 1.13 (Aomori prefecture) for men and from 0.84 (Kanagawa prefecture) to 1.11 (Kagoshima prefecture) for women (supplementary tables 6 and 7). Figure 3 shows the results of geographic inequalities in mortality. We observed similar patterns in both sexes although they led to opposite results between the sexes in Akita and Fukui prefectures; in Akita, the mortality risk was higher in men, whereas it was lower in women. In Fukui, however, the pattern was reversed.
Adjusted prefecture-level variance for all-cause premature mortality, Japan, 1970–2005*

Geographic inequality of all-cause premature mortality, Japan, 1970–2005. We show the overall geographic inequality of all-cause mortality across 47 prefectures, conditional on individual age, occupation and time-trends. Prefecture-level residuals are described in ORs with the reference being the grand mean of all the prefectures. Prefectures with a lower and a higher estimate of odds for mortality are filled with blue and red, respectively. Regarding areas filled with grey, prefecture-level residuals were not statistically significant.
Although overall geographic inequalities of mortality were relatively small, they appear to have increased over time (table 2). In men, although prefecture-level variance was less pronounced until 1990 (around 0.003 on logit scale), it began to increase since 1995 steadily to 0.011 in 2005. By contrast, in women, the prefecture-level variance (on logit scale) was 0.007 in 1970s, and it declined to 0.004 in 1990 and then increased up to 0.012 in 2005. The adjusted ORs and 95% CIs for mortality in each prefecture across years are shown in supplementary tables 6 and 7. In 1970, ORs ranged from 0.89 (Gifu prefecture) to 1.12 (Akita prefecture) for men and from 0.79 (Tokyo) to 1.14 (Kagoshima prefecture) for women. In 2005, the ranges were widened, and ORs ranged from 0.81 (Nara prefecture) to 1.27 (Aomori prefecture) for men and from 0.75 (Nara prefecture) to 1.18 (Kochi prefecture) for women. We show geographic and temporal variation in mortality, suggesting an increase in geographic inequalities across prefectures since 1995 in both sexes (supplementary figures 2 and 3 and video).
Supplementary analyses
We examined two additional issues to further explore the occupational and geographic inequalities in premature mortality: (1) the patterns of geographic inequalities in mortality by occupations and (2) the presence of contextual effects of prefecture-level socioeconomic status on mortality risk (supplementary text, supplementary figures 4 and 5, supplementary tables 8–10).
Discussion
Summary of findings
The findings of the present study suggest that the economic trends during the past 35 years have been accompanied by a widening of health inequalities between occupational classes as well as geographic areas of the country. The post-bubble economy has been characterised by lacklustre growth combined with a dramatic shift in the workforce away from life-long employment towards more precarious employment.4 This economic restructuring has increased pressure on workers in managerial and professional workers (primarily men) who are being squeezed to raise their productivity. The changing pattern of health inequalities across occupational groups is consistent with this interpretation, that is, the stalled decline in premature mortality among white-collar workers relative to other occupational classes.
Comparison with other studies
The present findings suggest that the health effects of the changing economic conditions depend on individual's socioeconomic circumstances. A previous study in Japan demonstrated that, although self-rated health improved for both sexes throughout the economic crisis of the 1990s, health disparities in relation to occupations widened, especially among men.25 They also reported that middle-class male workers and female home makers seemed to be particularly adversely affected by the crisis.25 The present study, however, provides a different pattern of widening health disparities in both sexes. For men, absolute health status improvement was observed only among some lower occupational groups (eg, production process and related workers, sales workers and clerical workers), whereas higher occupational classes (eg, specialist and technical workers and administrative and managerial workers) apparently obtained no benefit throughout the period. Indeed, although they were advantaged with regard to mortality risk in 1970s and 1980s, they were overtaken in the 1990s by those in lower occupational classes who benefited more during the same period. Of note, this ‘cross-over’ almost coincided with the collapse of the economic bubble in the early 1990s. We note at the same time that neither male service workers nor agricultural, forestry and fishery workers experienced improvements in premature mortality throughout the period.
By contrast, for women, we observe that absolute health status improved roughly to the same extent across occupational groups and that changes in ranking were less pronounced in women compared with men. We should note that relatively few women were represented in the three occupational groups with higher risk of mortality (ie, administrative and managerial workers, security workers and transport and communication workers). Even excluding these occupational groups, however, health inequalities appeared to have increased in women. These findings may be explained by differences between men and women according to the type of work and industrial sector of employment. Men are more likely to be engaged in work in the private sector as well as in parts of the economy that are more vulnerable to economic downturns (such as finance and business services, manufacturing, construction).26
Potential mechanisms of social inequalities in mortality
The present findings provide a marked contrast to the evolution of health inequalities described in other industrialised countries. In industrialised western European and North American countries, health status typically follows a hierarchical pattern: that is, the lower the socioeconomic position, the worse the health status.5 8 10 11 We show that this ‘typical’ pattern of health inequalities does not necessarily apply to Japan. In contrast to Western countries, previous studies in Japan have yielded inconsistent results with regard to the relationship between socioeconomic status and health outcomes, and lower non-manual or manual workers do not necessarily exhibit less healthy behaviours compared with those in higher occupational classes.27–32 Nevertheless, a recent study of a nationally representative sample in 2001 showed that men in lower occupational classes, such as service work, transportation and labour work, were significantly more likely to engage in health risk behaviours compared with professional workers.33 They also showed that there is a cumulation of risky behaviours in lower female occupational classes.33 Further, another cross-sectional study in Japan demonstrated that occupation was not significantly associated with psychological distress among men or women by using a nationally representative sample in 2007.34 Thus, the pattern of health inequalities in the present analysis is not consistent with occupational class differences in health behaviours or psychosocial stress.
As a possible explanation for the present findings, we note that occupation-based socioeconomic position may reflect social networks,14 which enables its members to access a wide variety of resources. In this respect, recent research from Japan has emphasised the evaluation of social capital as well as social networks in the workplace to explain variations in workers' health.35–37 We thus hypothesised a posteriori that, following the collapse of the economic bubble, workers of higher occupational classes were more likely to experience a breakdown of social cohesion within companies, which could cancel out the potential positive benefits among them. We also note that there is a possibility that the ‘compositions’ of each occupational group went through a (substantial) change throughout the study period, which might have led to different patterns of occupational hazards, especially among lower occupational groups. In other words, there is a possibility that work environment have improved markedly among them throughout the study period, which now requires less labour load. Finally, a possibility of healthy worker effect cannot be ruled out among some lower occupational groups. This could be induced by the following two processes: (1) healthy people might have selectively entered these occupations and (2) unhealthy workers might have selectively exited these occupations. Further studies are warranted to examine these possible explanations of the present findings.38
It is worth mentioning that typical occupational hierarchy does not necessarily apply to the occupation (major group) of the Japan Standard Occupational Classification. Indeed, there is inherently more ambiguity in the ranking of occupations compared with education and income.39 In addition, as noted by Galobardes et al,14 the decrease in manual occupations with concomitant increase in low-level service occupations has altered the stratification that occupation generates in terms of socioeconomic position and so classification such as manual and non-manual workers may lose some of their meaning in economies which include a large number of low-paid non-manual service jobs. Importantly, the occupational classification in the present study yields reasonably consistent occupational grouping throughout the study period, and each group has a reasonably large data. We therefore examined the time trend of social inequalities by using the finest occupational classification available in the census. By using a fairly detailed occupational classification, it is likely that we could adjust for other omitted compositional variables (eg, education), to the extent that the cross-tabulation of age and occupation correlate with them.
Geographic and temporal variation in mortality
By applying the novel multilevel methods, the present study shows that geographic inequalities in premature mortality have also widened since 1995. In an ecological study, Fukuda et al40 assessed the time trend of geographic health inequality in Japan, by examining the association of life expectancy and age-adjusted mortality with per capita income of prefectures and municipalities. While excluding Okinawa prefecture from the analyses, they found a possible increase in geographic health inequalities from 1995 to 2000, following a decrease from 1955 to 1995.40 Note that the present study examined geographic inequalities, conditional on individual age and occupation. The present findings thus provide suggestive evidence of ‘common ecologic effects’ of place where people live,41 although we should note that the seemingly ecologic effects might be due to an omitted compositional effect (eg, income). Broadly speaking, since 1995, higher mortality risk has been consistently observed in the northeastern region in the main island (Tohoku region) for both sexes. Overall, the economic conditions of the predominantly rural areas in the region may be characterised by population decline, population ageing and lower per capita income.19 42 Notably, however, not all rural prefectures have undergone the same transition; indeed some rural prefectures (such as Nara and Okayama) had moved up through the ranks as having significantly lower mortality for both sexes in 2005. In the supplementary analysis, no clear associations were found with prefecture-level socioeconomic variables, and it remains unknown what contributed to these distinct patterns. These patterns deserve further attention in future studies.
Limitations of the study
There are some limitations of our analysis. First, although we were able to conduct a fairly detailed analysis of trends by using occupations to measure certain aspects of socioeconomic position, neither the status in employment nor the predominant type of employment contract was available, and in particular, we lacked information on whether the individuals were in standard jobs or precarious jobs. Given the conspicuous increase in the proportion of the labour force engaged in non-standard work,4 as well as mounting evidence that precarious work is associated with worse health,43 future work needs to examine whether the changing character of the workforce in Japan is contributing to widening health inequalities. The use of more detailed indicators of socioeconomic position would provide further insight into the social inequalities of health. Indeed, greater attention to the theoretical as well as empirical aspects of measurement of socioeconomic position will likely enhance the rigour of research on occupational health inequalities, which would increase the possibility for meaningfully comparing results across studies.44
Second, occupation at the time of death was used in our numerator data, which may not necessarily reflect the individual's life-course socioeconomic position.44 45 If unhealthy workers selectively exited some occupations, this would have led to an underestimation of mortality in those sectors. The proportion of agricultural workers significantly decreased during the study period for both sexes, as well as that of administrative and managerial workers (for men). However, this may reflect real trends in the workforce.
Third, considering the possible discrepancies of the respondents on the two occasions (ie, the notification of deaths and the census), we should note the potential for numerator denominator bias between the two sources of information. In particular, the possibility of measurement error in occupation at the time of death cannot be ruled out—the person recording the notification of deaths may either promote the deceased to a higher status job or demote them because the respondents did not know the details of the deceased's job. Indeed, rapid changes in the occupational structure of Japan could give plausibility to the extremely large ORs resulting from the potential for numerator denominator bias.
Fourth, the smallest geographic unit available was the prefecture (of which there are 47), and we could not explore geographic inequalities in finer detail. However, the prefecture may be a useful and valid unit of analysis since it is the unit that has direct administrative authority in the economic, education and health sectors.1 Furthermore, the prefecture has specific jurisdiction over health centres, which is the locus of preventive healthcare activity in Japan.1 Note also that the boundaries between prefectures have not changed since the Meiji Restoration (1867), enabling long-term analysis.1 Since previous studies demonstrated that the choice of geographic units as well as area-based measures is critical in the investigation of geographic inequalities,46 47 these issues warrant further examination.
Conclusions
Despite several limitations associated with the use of secondary data, the present findings indicate that both social and geographic inequalities in premature adult mortality have increased during Japan's ‘Lost Two Decades’ following the collapse of the asset bubble. As a nation, Japan must grapple with the triple demographic trends of declining fertility, population ageing and overall population decline. These trends threaten to further dampen economic activity, escalating the load on the social security system. In addition, Japan now faces multiple challenges in the wake of the earthquake and tsunami on 11 March 2011, and this may further place downward momentum on the nation's struggling economy. Given these momentous challenges, it is imperative to continue to monitor future trends in health inequalities in order to avert the potential impacts on Japan's health security.
Acknowledgments
The authors thank Akiko Tokinobu for her assistance with data collection.
References
Supplementary materials
Supplementary Data
This web only file has been produced by the BMJ Publishing Group from an electronic file supplied by the author(s) and has not been edited for content.
Files in this Data Supplement:
- STROBE Checklist - Manuscript file of format pdf
- Supplementary Text - Manuscript file of format pdf
- Supplementary Video
Footnotes
To cite: Suzuki E, Kashima S, Kawachi I, et al. Social and geographic inequalities in premature adult mortality in Japan: a multilevel observational study from 1970 to 2005. BMJ Open 2012;2:e000425. doi:10.1136/bmjopen-2011-000425
Contributors SVS and ES conceived the idea and design of the study. ES led the data collection, data analysis, interpretation of the findings and writing of the manuscript. SVS supervised the study and contributed to the interpretation of findings and writing of the manuscript. SK contributed to the data analysis, literature review and writing of the manuscript. IK contributed to the interpretation of the findings and writing of the manuscript. All authors have read and approved the final version of the manuscript.
Funding A part of this research was supported by a Grant-in-Aid for Scientific Research, Ministry of Education, Culture, Sports, Science and Technology (MEXT), Japan. The funding source had no role in study design, data collection, data analysis, data interpretation, the writing of the report or the decision to submit for publication.
Competing interests All authors have completed the ICMJE uniform disclosure form at http://www.icmje.org/coi_disclosure.pdf (available on request from the corresponding authors) and declare that SVS is supported by a Robert Wood Johnson Investigator Award in Health Policy Research and by a career development award from the National Institutes of Health (NHLBI K25 HL081275); no financial relationships with any organisations that might have an interest in the submitted work in the previous 3 years; no other relationships or activities that could appear to have influenced the submitted work.
Provenance and peer review Not commissioned; externally peer reviewed.
Data sharing statement No additional data available.