Article Text

Abstract
Objectives Personality differences between doctors and patients can affect treatment outcomes. We examine these trait disparities, as well as differences across medical specialities.
Design Retrospective, observational statistical analysis of secondary data.
Setting Data from two data sets that are nationally representative of doctors and the general population in Australia.
Participants We include 23 358 individuals from a representative survey of the general Australian population (with subgroups of 18 705 patients, 1261 highly educated individuals and 5814 working in caring professions) as well as 19 351 doctors from a representative survey of doctors in Australia (with subgroups of 5844 general practitioners, 1776 person-oriented specialists and 3245 technique-oriented specialists).
Main outcome measures Big Five personality traits and locus of control. Measures are standardised by gender, age and being born overseas and weighted to be representative of their population.
Results Doctors are significantly more agreeable (a: standardised score −0.12, 95% CIs −0.18 to −0.06), conscientious (c: −0.27 to –0.33 to −0.20), extroverted (e: 0.11, 0.04 to 0.17) and neurotic (n: 0.14, CI 0.08 to 0.20) than the general population (a: −0.38 to –0.42 to −0.34, c: −0.96 to –1.00 to −0.91, e: −0.22 to –0.26 to −0.19, n: −1.01 to –1.03 to −0.98) or patients (a: −0.77 to –0.85 to −0.69, c: −1.27 to –1.36 to −1.19, e: −0.24 to –0.31 to −0.18, n: −0.71 to –0.76 to −0.66). Patients (−0.03 to –0.10 to 0.05) are more open than doctors (−0.30 to –0.36 to −0.23). Doctors have a significantly more external locus of control (0.06, 0.00 to 0.13) than the general population (−0.10 to –0.13 to −0.06) but do not differ from patients (−0.04 to –0.11 to 0.03). There are minor differences in personality traits among doctors with different specialities.
Conclusions Several personality traits differ between doctors, the population and patients. Awareness about differences can improve doctor–patient communication and allow patients to understand and comply with treatment recommendations.
- Health policy
- Health economics
- HEALTH ECONOMICS
Data availability statement
Data may be obtained from a third party and are not publicly available. The data that support the findings of this study are not publicly available due to privacy or ethical restrictions, but data access request can be made separately. To access de-identified unit record HILDA data, application can be made at https://melbourneinstitute.unimelb.edu.au/hilda/for-data-users. To access de-identified unit record MABEL data, application can be made at https://melbourneinstitute.unimelb.edu.au/mabel/for-researchers/data.
This is an open access article distributed in accordance with the Creative Commons Attribution Non Commercial (CC BY-NC 4.0) license, which permits others to distribute, remix, adapt, build upon this work non-commercially, and license their derivative works on different terms, provided the original work is properly cited, appropriate credit is given, any changes made indicated, and the use is non-commercial. See: http://creativecommons.org/licenses/by-nc/4.0/.
Statistics from Altmetric.com
Strengths and limitations of this study
We use two large samples representative of doctors and of the general population.
We exploit validated instruments assessing the most widely used personality traits (Big Five and locus of control).
We adjust for reasonably exogenous variables, sampling weights and missing variables.
The Big Five personality instruments are slightly different between the two surveys (long vs short instruments), yet rescaled.
Personality measures are self-rated by survey respondents.
Introduction
The non-cognitive skills of medical doctors, such as personality, can determine a range of professional and patient outcomes and be an important factor for the effectiveness of interventions and the quality of care through the doctor–patient relationship.1 Beyond the clinical problem to be solved, doctors need to understand and empathise with patients and appreciate their particular non-medical and social circumstances to provide patient-centred care in the patient’s best interest2–5 and to promote concordance with treatment recommendations.6 7 In addition, doctors are increasingly selected into the medical profession and into specialties on the basis of informal and formal assessments of their non-cognitive skills in addition to their academic ability, with the aim to ensure that they will be suited to a career as medical professionals or in specific specialty areas.8–13
The effects of doctor personality traits on clinical performance have received some attention in the literature. Conscientiousness and empathy have been particularly identified as desirable traits of high-performing doctors5 8 14–16 and are highly valued by patients.17 18 Furthermore, research shows that greater doctor openness may contribute to higher patient satisfaction.17 Self-directedness, persistence and cooperativeness were found to be positive predictors of doctor resilience,19 while negative personality traits such as psychopathy and narcissism contribute to counterproductive work behaviour (willingness to cause harm to one’s workplace).20 Personality is also related to a doctors’ appetite for risk and tolerance for uncertainty.21 22
The effects of patient personality on seeking treatment and clinical outcome have also been investigated. For example, findings show that personality affects how early patients suffering from depression and schizophrenia seek treatment, the degree of psychopathology experienced by MS patients and pain intensity and duration felt by patients following injury.23 24 Patient personality can also affect how they view communication with their doctor and their treatment choices.25
Aside from the traits commonly included in personality classifications, locus of control (LOC) is also a relevant characteristic for both doctors and patients. Individuals with a more internal LOC believe that their own efforts determine outcomes in life, while those with an external LOC believe that external causes, such as luck or powerful others, are the main determinants of outcomes. Those with an external LOC have lower subjective well-being,26 worse health outcomes27 and are more likely to engage in unhealthy behaviours.28
How we select and train doctors may lead them to have personality characteristics that differ from the patient population. For example, conscientiousness is a significant positive predictor of high academic performance and is likely to be further developed through medical training.29 The personalities of doctors need to be suited to a demanding career in medicine, and to particular specialties, while also having sufficient compatibility with patients to allow doctors to treat and communicate with patients effectively. Yet one quarter of medical reports are concerned with poor communication,30 which may reflect limited alignment between clinicians’ and patients’ personalities. Differences between doctor and patient personality can affect communication effectiveness and create a mismatch between how doctors deliver information and how information is best received by patients.2 This has potential implications for aspects of patient care such as gaining compliance and sensitively delivering bad news. Furthermore, a growing literature identifies differences between doctors and patients in preferences that influence treatment choices.31–34 Personality differences may contribute to these divergent preferences.
Given the demonstrated association of personality with a variety of important outcomes, it is necessary to consider the extent to which practicing doctors have personality traits that differ substantially from members of the general population and particularly the patient population. Unfortunately, existing research on doctors’ personality is dominated by convenience samples, low sample sizes and response rates and was undertaken for specific types of doctors or in specific medical schools or geographic areas. The use of personality measures that are outdated or lack sufficient reliability and validity is also an issue. Although there are some consistent findings across studies, these findings have not been corroborated in larger scale surveys. The two most extensive studies by Mullola et al 35 and Stienen et al 36 show consistent patterns of variation in personality across specialties and at different stages of training, but to our knowledge, no prior study has shown how doctors’ personality differs from the general population and patients based on nationally representative data.
The aim of this paper is to describe differences in personality traits between doctors and other groups of individuals (the general population, patients, the highly educated and those in caring professions). Since conscientiousness, agreeableness and interpersonal skills should be higher in doctors,5 8 we first compare these traits to the other groups. Empathy, which is part of agreeableness, should be higher for doctors compared with others with a similarly high level of education, whereas conscientiousness should be similar to those with high levels of education.15 37 Agreeableness should be on par for doctors and those in other caring professions, though conscientiousness might be higher for doctors given their higher levels of education.38 Individuals with a more internal LOC tend to have better academic achievement and labour market outcomes,21 39 both of which characterised doctors. Thus, we expect doctors to have a higher internal LOC than the other groups except for the highly educated.
Finally, we expect differences in personality between different medical specialties. In particular, general practitioners (GPs) and those in ‘person-oriented’ specialties requiring higher levels of continuity of care and interpersonal care may have different traits to those in ‘technique-oriented’ specialties that require fewer direct interactions with patients and rely more strongly on procedural skills.35 36 38 40–42 Comparing doctors across specialty areas allows us to recognise heterogeneity in the medical profession with different specialties emphasising different types of non-cognitive skills. Yet, we expect that differences in personality traits between medical specialties will be smaller than differences between doctors and the general population.
Methods
Patient and public involvement
It was not appropriate or possible to involve patients or the public in the design, conduct, reporting or dissemination plans of our research.
Data and personality variables
Our data come from two longitudinal datasets, the Medicine in Australia: Balancing Employment and Life (MABEL) survey and the Household, Income and Labour Dynamics in Australia (HILDA) survey. Each data set contains variables covering two of the most widely used measures of personality, the Big Five (B5) personality traits and LOC. The B5 defines five main dimensions of individual personality: agreeableness, conscientiousness, extraversion, neuroticism and openness. Agreeable individuals describe themselves as being empathetic, kind, cooperative and warm; conscientious individuals describe themselves as orderly, systematic, inefficient (reversed), sloppy (reversed), disorganised (reversed) and efficient; extraverts as talkative, bashful (reversed), quiet (reversed), shy (reversed), lively and extroverted; neurotics as envious, moody, touchy, jealous, temperamental and fretful and open individuals as deep, philosophical, creative, intellectual, complex and imaginative. This classification is the broadest yet comprehensive form of classification for an individual’s personality.43–45 LOC measures how much individuals believe their own behaviour versus external factors largely determine outcomes.46 Those with more internal LOC are expected to be more active in their decision-making and take greater agency for their own lives.
Doctor information comes from MABEL, a longitudinal prospective cohort study representative of all doctors providing clinical medical services in Australia, with data collected annually for a total sample of about 9000 doctors each year. A detailed discussion of the MABEL study design is available elsewhere.47 MABEL is a self-administered questionnaire with surveys sent to doctors who have completed the survey in previous years plus new doctors in the sample frame of practicing doctors every year. B5 personality traits questions were introduced in 2009 (wave 2) and LOC in 2010 (wave 3), with both B5 and LOC asked to all respondents in wave 2 (B5) and wave 3 (LOC) and then to new participants in subsequent waves up to 2017 (wave 10). The overall sample with B5 and LOC is 19 599 doctors (see MABEL flow diagram in the online supplemental appendix 1). Overall response rates range from 64.9% in 2009 to 39% in 2017. The number of doctors contacted for the survey include all those who responded in at least one previous wave, and thus response rates naturally fall over time. Response rates to the specific B5 and LOC question modules range from 85.4% to 99.3% depending on the year.48 As B5 and LOC questions were asked to each doctor only once, we construct a pooled cross-section of all the doctors at the time they answered the B5 and LOC questions, covering the 2009–2017 period.
Supplemental material
The personality types of the general population, patients and other occupations come from HILDA, a nationally representative household longitudinal survey of adults aged 15 years and more, with more than 17 000 Australian surveyed each year.49 50 The number of respondents is supplemented every year and a top-up sample of more than 5000 individuals was added in 2011, allowing us to draw on data from an overall sample of 26 554 individuals (see HILDA flow diagram in the online supplemental appendix 2). HILDA uses a combination of interviews and self-administered questionnaires, such that the year-on-year response rates range from 86.9% to 92.4%.50 HILDA data are collected annually, but the B5 and LOC questions are part of specific modules collected (about) every 4 years: B5 was collected in 2005, 2009, 2013 and 2017; LOC was collected in 2003, 2004, 2007, 2011 and 2015. To match information from HILDA with the period of MABEL survey, we only use HILDA data as cross-sections over the years 2009–2017.
B5 and LOC are measured by validated instruments in each survey. MABEL uses the 15-item Big Five Personality Inventory (BFI),44 while HILDA uses the 36-item inventory,51 even though commonly only 28 items are used due to poor factor loading of eight items.52 Scores are derived for each personality trait by averaging the items relevant to the trait. To ensure B5 raw scores are comparable across surveys, HILDA scores are linearly rescaled such that each personality trait is measured on a scale from 1 to 21 in both surveys, with higher values indicating that the trait describes the respondent better. LOC is measured by a set of seven questions from the Psychological Coping Resources component of Pearlin-Schooler Mastery/Self-efficacy Scale53 in both surveys. The LOC index is calculated by summing the five external items, subtracting the two internal ones and adding sixteen, such that the index ranges from 7 (internally controlled) to 49 (externally controlled).
Construction of comparison groups
To investigate if doctors differ from the general population and their patients, we compare four groups in HILDA to all doctors in MABEL (group 0). The general population (group 1) includes all adults aged 20–85. While personality may undergo changes during childhood and adolescence, it is relatively stable during adulthood.54 55 The stability of personality in old age has been less clearly documented56 57 and natural attrition may lead to potential selection effects, as personality may affect mortality, which leaves small samples with valid personality measures over the age of 85.58 Since there is no official retirement age in Australia and some doctors will continue work past their mid-60s and to see retired patients, we include both older doctors and older participants up to the age of 85 in group 0 and group 1, respectively. (Note, however, that the results reported below do not change if we exclude those over the age of 65.) As a further restriction to group 1 membership, individuals who are likely to be medical doctors in the HILDA survey are excluded (ie, they hold a doctorate degree and work in hospitals, medical or other health care services). Group 2 are patients, defined as a subsample of individuals from group 1 who had at least one doctor visit in a given year.
Groups 3 and 4 were created from HILDA to assess if doctors differ in their personality, especially agreeableness and conscientiousness, relative to other highly educated individuals and those who practice in caring professions. Group 3 (highly educated) includes all respondents from group 1 who have a postgraduate (masters or doctorate) degree. Group 4 (caring professions) includes all individuals from group 1 who work in professions of caring, public service or education. Definitions for the comparison groups are included in online supplemental appendix 3.
Finally, we explore differences across three different doctor subgroups within MABEL. Group 5 are GPs. To keep the comparison tractable among other specialists, we include 36 possible Australian medical specialties in ‘person-oriented’ specialties as group 6 and in ‘technique-oriented’ specialties as group 7, using a well-established classification system.59 60 ‘Person-oriented’ specialties include obstetrics/gynaecology, paediatrics and psychiatry, while ‘technique-oriented’ specialties include anaesthesiology, radiology and surgery, with a full list of the specialties included in online supplemental appendix 3.
Data analysis
The six measures of B5 and LOC in HILDA and MABEL are statistically standardised z-scores (mean=0; SD=1) that provide a comparable measure of the size of the difference between doctors and the other population (sub)groups. These measures are used as outcomes in regression analyses where we adjust for respondents’ age, gender and being born outside Australia. We select only a limited set of demographics to avoid overadjustment, focusing on individual characteristics likely to affect, rather than be affected by, personality.61 62 We adjust for immigration status given the multicultural nature of Australian society, especially in the medical workforce. To account for the complex design of the two nationally representative surveys, we use HILDA and MABEL probability sampling weights in our regressions, providing results that are representative of the respective populations (ie, the general population for HILDA and the population of doctors for MABEL). In addition, sample weights control for potential bias due to missing observations in HILDA. We report these standardised, adjusted and weighted B5 and LOC measures with 95% CIs, with SEs cluster-robust at the individual level to account for the correlations of multiple personality measurements per respondent in HILDA. All analyses are conducted with STATA/SE V.15.1.
Results
The raw values of personality prior to any adjustment, as well as key demographics used for adjustment, are reported in online supplemental appendix 4. It is worth noting that the sample size of personality traits and demographics do not exactly match because LOC and B5 are measured in different survey waves, such that some respondents completed B5 only, others completed LOC only, but most completed both.
Comparison of doctors with patients and population subgroups
We report key findings as adjusted means of personality outcomes in SD units with their 95% CIs. For purposes of ease of interpretation, all results are reported in figures, with exact values in regression table (online supplemental appendix 5).
Figure 1 reports the estimated differences between all doctors (group 0) and the comparison groups 1 to 4. The figure includes the estimated mean value for each personality trait and for LOC as well as the estimated 95% CI. For each characteristic, the estimates from top to bottom are for doctors (group 0), the general population (group 1), patients (group 2), highly educated individuals (group 3), and those working in caring professions (group 4). Recall that all values are standardised relative to a mean of zero and an SD of one relative to the full sample in MABEL. However, the estimated value for MABEL doctors can be different from zero due to adjustments made to the sample based on demographic factors and on weighting that makes MABEL respondents representative of doctors in Australia.
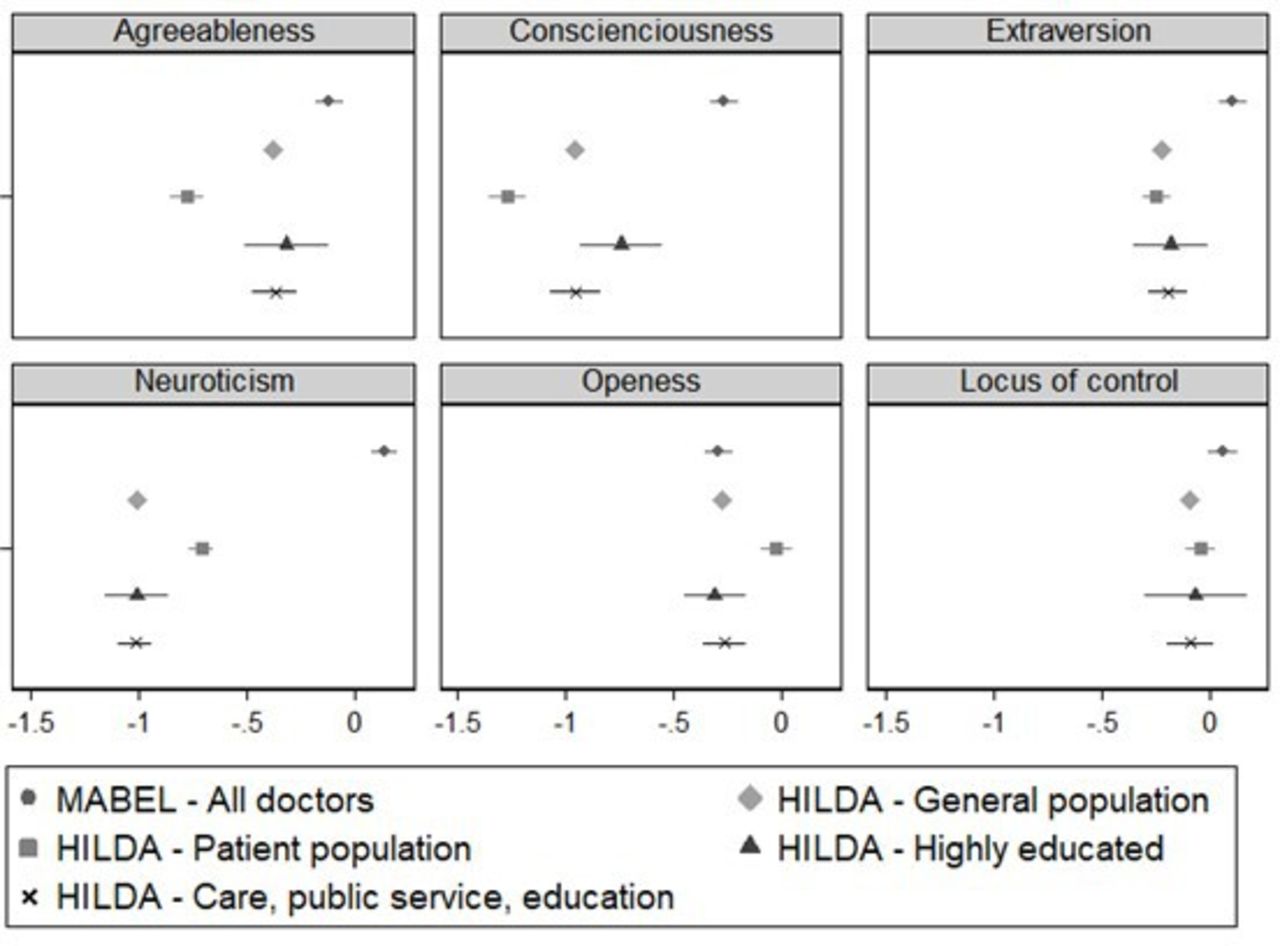
Comparison of personalities of doctors with the general population, patients, highly educated and caring professions. HILDA, Household, Income and Labour Dynamics in Australia; MABEL, Medicine in Australia: Balancing Employment and Life.
As is seen in figure 1, doctors are overall more agreeable, more conscientious, more extroverted and more neurotic than the other groups, but there are few differences in openness and LOC. Recall that we expected differences between doctors and the other groups to be greatest for agreeableness and conscientiousness. Doctors are more agreeable (standardised score −0.12, 95% CI −0.18 to −0.06) than the general population (−0.38, 95% CI −0.42 to −0.34). This difference between doctors and the general population is greater than the difference between doctors and the patient population (−0.77, 95% CI −0.85 to −0.69). Doctors are also more agreeable than individuals in caring professions (−0.37, 95% CI −0.47 to −0.27). However, the difference in agreeableness between doctors and other highly educated individuals (−0.31, 95% CI −0.51 to −0.12) is not statistically significant. Doctors are more conscientious (−0.27, 95% CI −0.33 to −0.20) than the general population (−0.96, 95% CI −1.00 to −0.91) and this difference is even greater, with a one SD difference, relative to patients (−1.27, 95% CI −1.36 to −1.19). The difference in conscientiousness between doctors and other groups is less marked compared with highly educated individuals (−0.75, 95% CI −0.94 to −0.56) and again greater compared with those in caring professions (−0.96, 95% CI −1.07 to −0.84).
Apart from these two traits, the difference between doctors and patients is significant for neuroticism (0.14, 95% CI 0.08 to 0.20 vs −0.71, 95% CI −0.76 to −0.66) and for extraversion (0.11, 95% CI 0.04 to 0.17 vs −0.24, 95% CI −0.31 to −0.18). Despite dissimilarities, the highly educated appear to be the most comparable group to doctors, except for neuroticism (0.14, 95% CI 0.08 to 0.20 vs −1.01, 95% CI −1.16 to −0.86). No statistically significant differences between doctors and the other groups are observed for openness, except for the patients, who are significantly more open than doctors (−0.30, 95% CI −0.36 to −0.23 vs −0.03, 95% CI −0.10 to 0.05). Finally, doctors have a more external LOC than the general population (0.06, 95% CI 0.00 to 0.13 vs −0.10, 95% CI −0.13 to −0.06) but do not significantly differ from the other groups.
Further analysis (online supplemental appendix 6) that disaggregates the results by gender shows that these findings are partly driven by female doctors, who appear to differ more strongly from the other groups relative to men. This is particularly noticeable for neuroticism, as female doctors are almost two SDs more neurotic than the female general population (0.83, 95% CI 0.76 to 0.91 vs −1.00, 95% CI −1.02 to −0.97), while the difference is of one SD for men (−0.03, 95% CI −0.11 to 0.04 vs −1.06, 95% CI −1.08 to −1.03).
Comparison between doctors
Figure 2 reports the estimated differences between the different doctor groups. Like the previous comparisons, all values are relative to the full sample in MABEL. For each personality characteristic, the first estimate is for all MABEL doctors (group 0), the second for GPs (group 5), the third for person-oriented specialists (group 6) and the fourth for technique-oriented specialists (group 7).

CComparison of personalities between doctors. GPs, general practitioners; HILDA, Household, Income and Labour Dynamics in Australia; MABEL, Medicine in Australia: Balancing Employment and Life; SPs, specialists.
There are almost no statistically significant differences in personality between groups of doctors (detailed results in online supplemental appendix 7). The exception is that GPs are more agreeable (0.25, 95% CI 0.09 to 0.41) than all the other groups, including the all-doctors group (−0.12, 95% CI −0.18 to −0.06) and are most different from person-oriented specialists (−0.38, 95% CI −0.64 to −0.12); however, person-oriented specialists and technique-oriented specialists (−0.33, 95% CI −0.55 to −0.11) appear similar in terms of their agreeableness.
Compared with the all-doctors group (group 0), technique-oriented specialists are more conscientious (−0.10, 95% CI −0.32 to −0.12 vs −0.27, 95% CI −0.33 to −0.20) and less extroverted (−0.14, 95% CI −0.33 to 0.05 vs 0.11, 95% CI 0.04 to 0.17) but the observed difference is not statistically significant. There is no noticeably different pattern across other specialties for these traits. Differences between the groups are smallest in terms of their LOC, with person-oriented specialists somewhat more (but again not significantly) externally controlled (0.22, 95% CI −0.06 to 0.49 vs 0.06, 95% CI −0.004 to 0.13).
Further analysis by gender (online supplemental appendix 8) indicates that female doctors are overall not only more conscientious and extroverted but also more neurotic and less open compared with male doctors. There is no discernable gender difference for agreeableness and LOC. These patterns hold across medical specialties.
This relative homogeneity of conscientiousness and neuroticism is informative when comparing doctors with the general population and with patients. As doctors are more extroverted and agreeable than the rest of the population, it is noticeable that these traits are similar across specialties (except for GPs). Overall, the comparison indicates that there is less variation in personality between doctors than there are differences between doctors and other population groups.
Discussion
Statement of principal findings
Using nationally representative samples of Australian doctors and the Australian general population, we found that there were important differences in personality between doctors, the population, patients, highly educated individualsand those working in caring professions. As expected, doctors were more conscientious and extroverted than all other groups but they were also more neurotic. Consistent with expectations, we found that both doctors and caring professionals were more agreeable than patients, but doctors were significantly more agreeable than caring professionals. Unexpectedly, doctors had a more external LOC than the general population. While significant, this difference was relatively small, and there were no significant differences between doctors and patients, caring professionals or the highly educated. Differences among doctors across medical subspecialities were overall smaller than between doctors and population subgroups, with GPs standing out with their higher level of agreeableness.
Strengths and weaknesses of the study
Our study has several strengths, including our large, representative data sets. Our doctors’ sample is much larger (roughly 18 500 instead of 5150) than the largest existing study of doctors’ personality.36 Beyond sample sizes, the uniqueness of our analysis and its contribution to the literature are its comparison of representative data on doctors’ personality with representative data on patients, highly educated individuals and individuals working in caring professions.
Our study also has limitations. Scales used to assess personality are self-rated, however, we used well-known and validated instruments.43 63 While the LOC instruments are the same in HILDA and MABEL, the B5 instruments are slightly different. MABEL employed the shortened version of the BFI used in HILDA. The Shortened BFI has adequate reliability and convergent validity64 65 and short personality instruments perform as well as longer ones.63 Furthermore, short survey instruments are necessary to ensure enough responses from doctors with high demand on their time in a large survey where personality is not the focus. HILDA data provide repeated measures for the personality traits of some but not all survey respondents, allowing for more precise estimates while controlling for repeated observations by using individual-clustered SEs. MABEL data only include one personality measure per individual. With repeated observations for some HILDA respondents, differences with MABEL doctors may become statistically significant.
Strengths and weaknesses in relation to other studies
To the best of our knowledge, no other study has compared doctors’ personality to other population groups as systematically or on such a large scale as we do. Our results are more general than previous studies with small samples or studying specific contexts. The closest to ours is Mullola, Hakulinen35 who compared Big Five personality traits, but not LOC, across medical specialties of a large representative sample of Finnish doctors. While their methodology is slightly different than ours, including their exploration of differences between all types of specialties, they find similar results of higher conscientiousness for technique-oriented specialties (surgery and internal medicine) and higher agreeableness in general practice. Their findings differ, in that they find higher extroversion in person-oriented specialties (paediatrics and psychiatry). Similarities may reflect the process of medical education, both in selection and training, which is relatively standardised in high-income countries while differences may speak to the specificities of Australia and Finland. The other closest study is Stienen, Scholtes36 who compared personality traits of doctors and surgeons in five European countries and Canada using a non-representative online survey. They measure Big Five personality traits, but not LOC. Like us, they find that doctors in different specialties are closer in personality compared with the general population, with the caveat that the population estimates are directly obtained from the general B5 survey instrument norms and not specific to the countries covered (ie, their population-comparison personality measures have not been elicited for the five European countries and Canada that were used to elicit personality traits of doctors). By contrast, our study compares representative data for all our comparison groups from the same country. One major difference is that they find doctors to be less neurotic than the population, while we find the opposite. One possible explanation for this difference is survey design: their survey was focused on personality traits, and it is, therefore, possible that respondents who were more neurotic chose not to respond. This problem should not affect MABEL since the core of the survey focuses on other factors and MABEL was designed to be representative of doctors in Australia.
Implications for clinicians and policymakers
We show that doctors are more agreeable, conscientious, extroverted and neurotic, but less open than their patients, which has clinical implications. Not only understanding a patient’s personality is important in clinical practice66 but also knowing the difference between a patient’s and one’s own personality may be useful as these differences may affect treatment success. For example, being more conscientious has implications for treatment adherence6 7 as conscientious doctors may overestimate their patients’ ability to follow recommendations. Higher doctor neuroticism, which is related to stress,67 could lead doctors to see stress as a normal part of life, and, thus, underestimate the impact of stress on patient well-being. Doctor agreeableness and conscientiousness increase patient satisfaction with care17 but could potentially lead doctors to view patients—in contrast to themselves—as more confrontational and less conscientious than patients actually are, causing an asymmetry in doctor and patient judgements of one another, which could impact outcomes.
Implications for personality differences may be more complex. For example, high neuroticism combined with high conscientiousness can be beneficial for health because patients may act on their health worries by seeking care, while neuroticism without conscientiousness can be harmful to health.68 Given that doctors tend to be higher than patients on both traits, doctors will need to consider how patients lower on these dimensions, and, particularly, how those high in neuroticism but low in conscientiousness, will respond to communication and treatment.
In summary, our findings can help raise doctors’ awareness of existing personality differences between themselves and their patients. By taking into account these differences, doctors can better calibrate their judgements of patients and gain insight into factors that influence their patient interactions.
Finally, diversity in experience and psychological perspective has a positive impact on team performance.69 The lack of personality difference we found between doctor specialties suggests that adding more doctors to a team will not increase diversity of personality-base perspectives. However, the differences found between doctors and those in other caring professions suggest that including non-doctor caring professionals in clinical teams will increase personality diversity and, thus, team performance.
Unanswered questions and future research
Our findings of large personality differences between patients and doctors support previous hypotheses about the potential key role of agreeableness (including empathy) and conscientiousness and the ongoing role of non-cognitive abilities in medical student selection. Future research should focus on neuroticism among doctors in comparison to other population groups and the role it plays in medical practice. It will be important to verify whether differences in results between our study and Stienen et al 36 are due to differences in survey design and respondents’ representativeness. It would also be of interest to conduct research using doctor–patient dyads and the specific alignment of their personality traits and associations with health outcomes and costs. In healthcare systems where patients have a choice of their GP or medical specialist, patients may effectively match with doctors that have more complementary personalities and so ensure much stronger relational continuity of care.70 Doctors are different to patients in many ways and improving understanding of effective doctor–patient relationships is central in providing high-quality medical care.
Data availability statement
Data may be obtained from a third party and are not publicly available. The data that support the findings of this study are not publicly available due to privacy or ethical restrictions, but data access request can be made separately. To access de-identified unit record HILDA data, application can be made at https://melbourneinstitute.unimelb.edu.au/hilda/for-data-users. To access de-identified unit record MABEL data, application can be made at https://melbourneinstitute.unimelb.edu.au/mabel/for-researchers/data.
Ethics statements
Patient consent for publication
Ethics approval
The HILDA study has been approved by the Human Research Ethics Committee of The University of Melbourne (Ref number 1647030). The MABEL study has been approved by The University of Melbourne Faculty of Business and Economics Human Ethics Advisory Group (Ref. 0709559) and the Monash University Standing Committee on Ethics in Research Involving Humans (Ref. CF07/1102 – 2007000291). Participants gave informed consent to participate in the study before taking part.
References
Supplementary materials
Supplementary Data
This web only file has been produced by the BMJ Publishing Group from an electronic file supplied by the author(s) and has not been edited for content.
Footnotes
Contributors MA was responsible for conceptualisation, data curation, methodology, data analysis, interpretation, writing original draft, review and editing. JF was responsible for conceptualisation, data curation, methodology, data analysis, interpretation, writing original draft, review and editing. JK was responsible for conceptualisation, reviewing and editing the manuscript. AS was responsible for conceptualisation, methodology, reviewing and editing the manuscript. All authors have reviewed and approved the final version of the manuscript. MA is responsible for the overall content as the guarantor.
Funding No funding was directly required nor obtained by the research team for this study. HILDA is funded by the Australian Government, currently through its Department of Social Services (DSS) and managed by the Melbourne Institute of Applied Economic and Social Research. Funding for MABEL has been provided by the National Health and Medical Research Council (2007 to 2016: 454799 and 1019605); the Australian Department of Health and Ageing (2008); Health Workforce Australia (2013); in 2017 The University of Melbourne, Medibank Better Health Foundation, the NSW Ministry of Health, and the Victorian Department of Health and Human Services, and in 2018 the Australian Government Department of Health, the Australian Digital Health Agency, and the Victorian Department of Health and Human Services. The funders of the HILDA and MABEL surveys had no role in study design, interpretation of the data or preparation of the manuscript.
Competing interests All authors have completed the Unified Competing Interest form and declare: no support from any organisation for the submitted work; AS has received research grants and honorariums from the National Health and Medical Research Council and the Australian Department of Health; no other relationships or activities that could appear to have influenced the submitted work.
Patient and public involvement Patients and/or the public were not involved in the design, or conduct, or reporting, or dissemination plans of this research.
Provenance and peer review Not commissioned; externally peer reviewed.
Supplemental material This content has been supplied by the author(s). It has not been vetted by BMJ Publishing Group Limited (BMJ) and may not have been peer-reviewed. Any opinions or recommendations discussed are solely those of the author(s) and are not endorsed by BMJ. BMJ disclaims all liability and responsibility arising from any reliance placed on the content. Where the content includes any translated material, BMJ does not warrant the accuracy and reliability of the translations (including but not limited to local regulations, clinical guidelines, terminology, drug names and drug dosages), and is not responsible for any error and/or omissions arising from translation and adaptation or otherwise.