Article Text

Abstract
Objectives In critically ill patients requiring mechanical ventilation for at least 21 days, 1-year mortality can be estimated using the ProVent score, calculated from four variables (age, platelet count, vasopressor use and renal replacement therapy). We aimed to externally validate discrimination and calibration of the ProVent score and, if necessary, to update its underlying regression model.
Design Retrospective, observational, single-centre study.
Setting 11 intensive care units at one tertiary academic hospital.
Patients 780 critically ill adult patients receiving invasive mechanical ventilation for at least 21 days.
Primary outcome measure 1-year mortality after intensive care unit discharge.
Results 380 patients (49%) had died after 1 year. One-year mortality for ProVent scores from 0 to 5 were: 15%, 27%, 57%, 66%, 72% and 76%. Area under the receiver operating characteristic curve of the ProVent probability model was 0.76 (95% CI 0.72 to 0.79), calibration intercept was −0.43 (95% CI −0.59 to −0.27) and calibration slope was 0.76 (95% CI 0.62 to 0.89). Model recalibration and extension by inclusion of three additional predictors (total bilirubin concentration, enteral nutrition and surgical status) improved model discrimination and calibration. Decision curve analysis demonstrated that the original ProVent model had negative net benefit, which was avoided with the extended ProVent model.
Conclusions The ProVent probability model had adequate discrimination but was miscalibrated in our patient cohort and, as such, could potentially be harmful. Use of the extended ProVent score developed by us could possibly alleviate this concern.
- statistics & research methods
- epidemiology
- intensive & critical care
Data availability statement
Data are available on reasonable request. The dataset analysed in this study is available from the authors on reasonable request.
This is an open access article distributed in accordance with the Creative Commons Attribution Non Commercial (CC BY-NC 4.0) license, which permits others to distribute, remix, adapt, build upon this work non-commercially, and license their derivative works on different terms, provided the original work is properly cited, appropriate credit is given, any changes made indicated, and the use is non-commercial. See: http://creativecommons.org/licenses/by-nc/4.0/.
Statistics from Altmetric.com
Strengths and limitations of this study
This is one of the largest external validation studies of the ProVent score.
In contrast to previous studies, we provide comprehensive data on discrimination and calibration as recommended by guidelines for external validation of predictive models.
Our study is the first to incorporate decision curve analysis to highlight the performance of the ProVent model.
Besides 1-year mortality, we could not analyse other important outcome variables such as functional status, liberation of mechanical ventilation or dependency on nursing care.
Introduction
The field of critical care medicine has undergone considerable change over recent decades, enabling many patients to overcome acute critical illness and recover to their former state of health. However, approximately 8% of all patients admitted to an intensive care unit (ICU) require organ support measures over a long period of time; this is a condition known as chronic critical illness (CCI).1 One of the proposed definitions of CCI is prolonged mechanical ventilation (MV) for at least 21 days.2 Among patients with CCI, 1-year mortality after ICU discharge is about 50%,3 4 and functional outcomes often remain poor in surviving patients.5 Commonly used ICU scoring systems fail to adequately predict long-term mortality in patients with CCI.6 7 In addition, survival and functional outcome is frequently overestimated by patients, their surrogates and clinicians,8 hampering informed decision making. As a consequence, the Prognosis for Prolonged Ventilation (ProVent) logistic regression model was derived in 2008 to estimate 1-year mortality of patients with MV for at least 21 days using four variables (age, platelet count, vasopressor use and renal replacement therapy).9 10 To facilitate clinical use, the ProVent probability model was simplified to generate the ProVent score that could be easily calculated at the bedside.
External validation of predictive models is an important task that should be performed prior to its implementation in clinical practice, and it should use a different patient cohort from which the predictive model was derived. While several studies from the USA and Asia have validated the ProVent score, only one European external validation study, with 200 French CCI patients, has ever been conducted.11 Considerable differences in ICU number, size and bed availability exist between the USA, Asia and Europe and limit the comparability between these regions.12 13 In addition, cultural differences regarding patient autonomy and treatment at the end of life could lead to either shortened or lengthened survival in some regions.14 It is known that prognostic scores have to be adjusted to compensate for such regional differences when they are used in new settings and their performance declines in time.15 Because of this, further external validation of the ProVent model seems warranted.
Therefore, the aim of this study was to evaluate the ability of the ProVent probability model to predict 1-year mortality in a large Austrian cohort of critically ill patients with MV for at least 21 days.
Methods
Patients and data export
For this single centre, retrospective, observational study, we screened the electronic health records of all patients admitted to 11 ICUs at the General Hospital of Vienna, a tertiary care centre of the Medical University of Vienna, Austria, from January 2015 to December 2019 for study eligibility. Patients who had received invasive MV mechanical ventilation for at least 21 days were eligible for study inclusion. Of note, patients were still eligible if MV was interrupted for less than 72 hours but then restarted.
We exported data (demographics, hospital and ICU admission and discharge data, diagnosis, ProVent variables: age, platelet count, vasopressor use and renal replacement therapy) from all eligible patients from the IntelliSpace Critical Care and Anaesthesia patient data management system (Philips Austria GmbH, Vienna, Austria). We obtained information on 1-year mortality from Statistics Austria, the Austrian national statistical institute. We excluded paediatric patients, patients with severe burn injuries or acute or chronic neuromuscular disease, patients who were ventilated longer than 24 hours prior to ICU admission and patients missing mortality data or ProVent input parameters. We did not perform a sample size calculation for this study as we analysed all patients available in our database.
Model validation
We calculated estimated 1-year mortality using the ProVent probability model formula10 and assessed model discrimination graphically by plotting receiver operating characteristic curves and numerically by calculating Brier score, area under the receiver operating characteristic (AUROC) curve, true positive rate (TPR; ie, sensitivity), true negative rate (TNR; ie, specificity), positive predictive value (PPV) and negative predictive value (NPV), all at a threshold probability of 50%. We also determined the optimal threshold probability by maximising Youden’s index. We assessed model calibration graphically by plotting calibration plots and numerically by calculating calibration intercept and calibration slope. We used the complete data set to validate the original ProVent model.
Model recalibration and extension
We performed model recalibration in a subset of the data consisting of 70% of the patients randomly sampled from the total cohort (training set). The remaining set was used for internal validation (test set). At first, necessary updates of miscalibrated regression coefficients were determined. For this, we fitted a logistic regression model using the original linear predictor as offset variable (ie, a variable with regression coefficient fixed at 1) and performed forward-stepwise selection with the four candidate variables (age, platelet count, vasopressor use and renal replacement therapy) using a significance level for entry of 0.05. The resulting regression coefficients determined the change in the original regression coefficient that was necessary to improve calibration. The regression coefficients of variables that were not selected remained unchanged. The final regression coefficients of the recalibrated model were given as the sum of the original coefficient and the coefficient from the forward-stepwise selection.16
In addition, we investigated if any new predictors would improve the model. We analysed the following 26 laboratory parameters, all measured on day 21 of MV: red blood cell count, haemoglobin, leucocyte count, arterial partial oxygen pressure, arterial partial carbon dioxide pressure, arterial pH value, base excess, standard bicarbonate concentration, sodium, chloride, potassium, calcium, magnesium, phosphate, lactate, glucose, creatinine, total bilirubin, albumin, alanine transaminase, aspartate transaminase, gamma glutamyl transferase, activated partial thromboplastin time, prothrombin time and fibrinogen. First, we fixed the recalibrated model by using its linear predictors as offsets and performed single-variable logistic regressions with each candidate variable using the offsets. The final extended model was built using the most significant laboratory parameter and included two additional variables, which were decided on as per clinical expertise: provision of enteral nutrition (yes/no) and any surgery (yes/no) prior to or while admitted to the ICU.
The original, recalibrated and extended models were then internally validated on the test data set. We calculated Brier score, AUROC, TPR, TNR, PPV and NPV (at a threshold probability of 50%).
Decision curve analysis
To evaluate the clinical usefulness of the original and the extended ProVent probability model, we performed decision curve analysis (DCA). We calculated net benefit as the number of patients correctly identified as non-survivors after 1 year (true positive count) minus the weighted number of patients falsely identified as non-survivors (false positive count) for the entire range of threshold probabilities (pt; ie, from 0% to 100%)17:
 .
.
Threshold probability refers to the probability above which a patient is classified as non-survivor (eg, a patient predicted to have a 60% chance of non-survival is classified as non-survivor at a pt of 50%, but not if pt is 70%). n refers to the total number of patients. Net benefit can be interpreted as the number of true positives per 100 patients without any false positives.18 We analysed these data graphically as decision curve.
Descriptive statistics
Categorical variables are given as absolute and relative frequencies. Continuous variables are given as median with first and third quartiles.
Software
Data handling and statistical analysis was performed using R V.4.1.2.19 DCA was performed using the dcurves package.20
Patient and public involvement
None.
Results
We screened 1015 potentially eligible patients undergoing MV for at least 21 days for study inclusion and included 780 patients in the final analysis (figure 1). The median ICU length of stay was 40 days (IQR 30–54), and median hospital length of stay was 65 days (IQR 42–102). Baseline information at day 21 of MV is provided in table 1.
Baseline information of included patients (n=780) obtained on day 21, if not specified otherwise

Patient inclusion flow chart. Note that some patients met more than one exclusion criteria. ICU, intensive care unit.
After 1 year, 380 patients (49%) had died. The median survival time after study inclusion (ie, day 21 of MV) was 34 days (IQR 12–103). One-year mortality for ProVent scores from 0 to 5 was 15%, 27%, 57%, 66%, 72% and 76%. A Kaplan-Meier plot depicting changes in mortality over time, stratified by ProVent score, is provided in online supplemental material 1.
Supplemental material
ProVent probability model
Validation
We validated the ProVent probability model using data from the complete patient cohort. Brier score was 0.21, and AUROC was 0.76 (95% CI 0.72 to 0.79). At a threshold probability of 50%, TPR (ie, sensitivity) was 0.81 (95% CI 0.76 to 0.85), TNR (ie, specificity) was 0.58 (95% CI 0.53 to 0.63), PPV was 0.65 (95% CI 0.60 to 0.69) and NPV was 0.76 (95% CI 0.71 to 0.81). The optimal threshold probability which maximised Youden’s index was 52%. Calibration intercept was −0.43 (95% CI −0.59 to −0.27) and calibration slope was 0.76 (95% CI 0.62 to 0.89). Receiver operating characteristics curves are depicted in figure 2, and calibration plots are shown in figure 3.
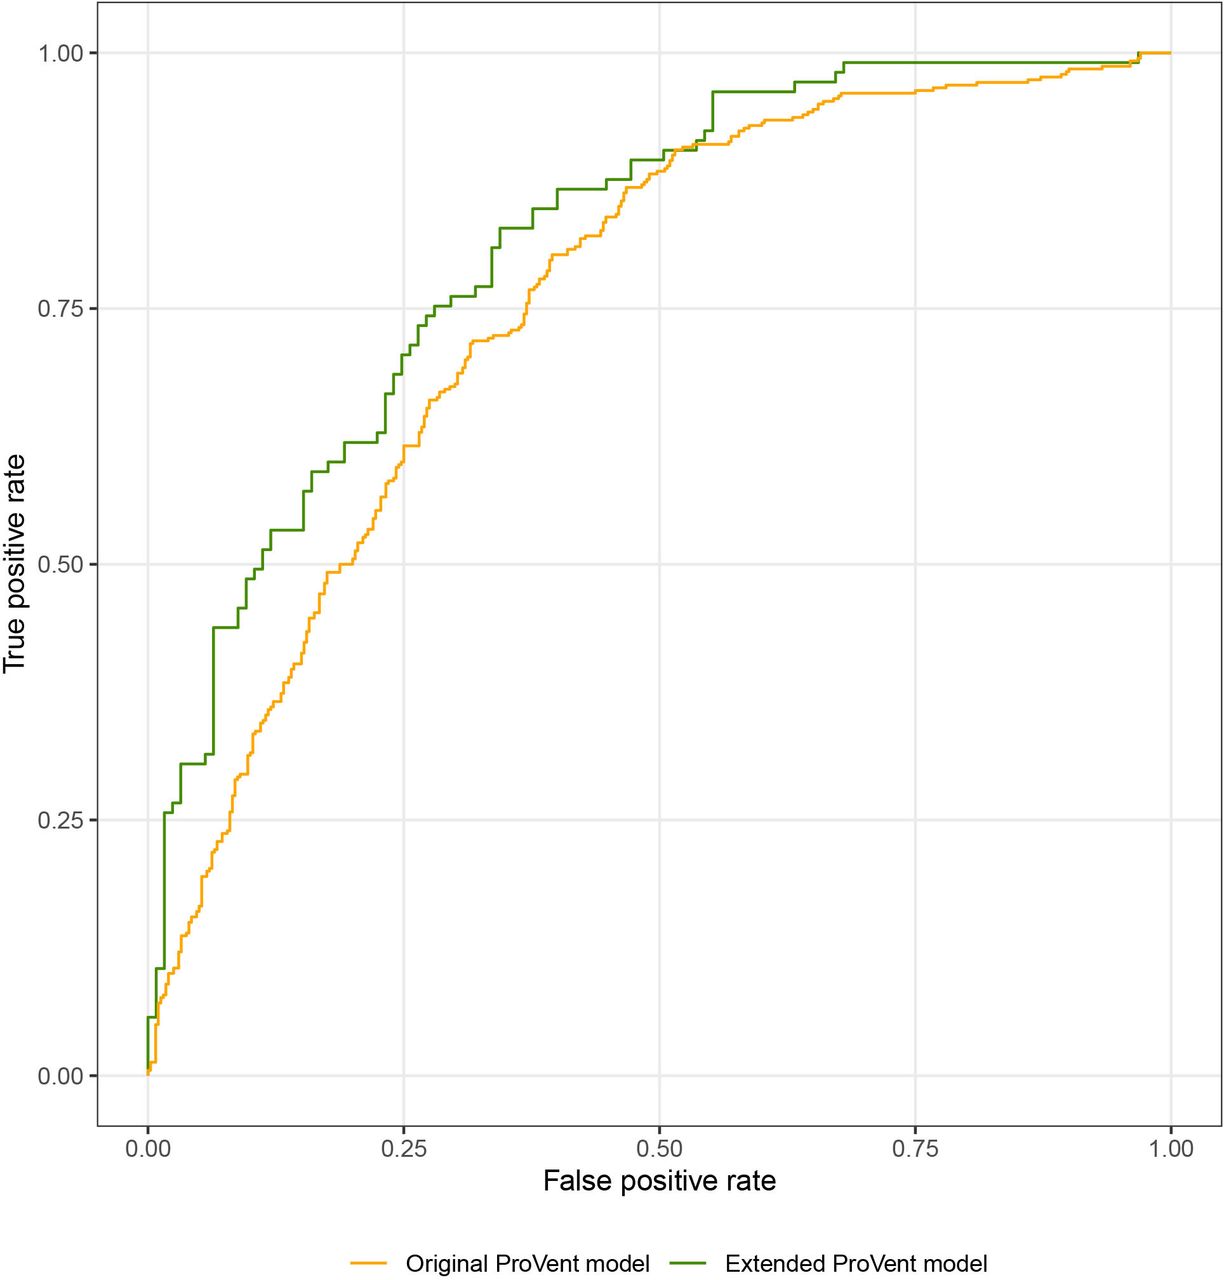
Receiver operating characteristic curve for original and extended ProVent probability models.
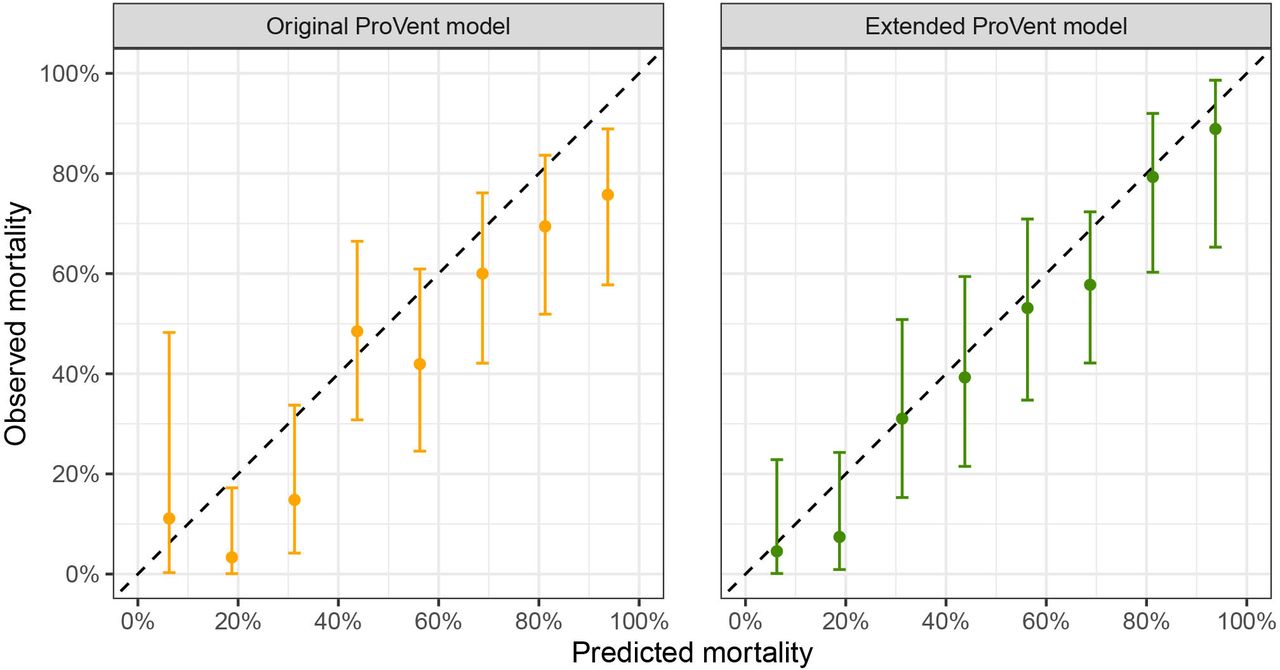
Calibration plots for original and extended ProVent probability model.
Recalibration
As the ProVent model was miscalibrated and therefore overestimated 1-year mortality, we performed recalibration using data from 546 patients. Recalibrated model coefficients are provided in online supplemental material 2. Internal validation in a subset of 234 patients not used for recalibration yielded a Brier score of 0.19 and an AUROC of 0.78 (95% CI 0.73 to 0.84). At a threshold probability of 50%, TPR was 0.75 (95% CI 0.65 to 0.82), TNR was 0.66 (95% CI 0.57 to 0.74), PPV was 0.64 (95% CI 0.55 to 0.73) and NPV was 0.76 (95% CI 0.67 to 0.83). The threshold probability that maximised Youden’s index was 38%. At this cut-off, TPR was 0.91 (95% CI 0.88 to 0.94), TNR was 0.47 (95% CI 0.42 to 0.52), PPV was 0.62 (95% CI 0.58 to 0.66) and NPV was 0.85 (95% CI 0.79 to 0.89). Calibration intercept was −0.21 (95% CI −0.50 to 0.07) and calibration slope was 1.19 (95% CI 0.84 to 1.53).
Extension
In the next step, we aimed to improve the ProVent probability model by introducing additional predictors from data available at our institution. We evaluated a collection of 26 laboratory values measured on day 21 of MV, as well as information on provision of enteral nutrition and surgical status. We constructed a multivariate prediction model including the recalibrated linear predictor as model offset and included three additional predictor variables in the final extended model: total bilirubin concentration (mg/dL), enteral nutrition (yes/no) and surgical status (any surgery/no surgery). These variables were significantly associated with 1-year mortality: univariate ORs for 1-year mortality were 1.15 (95% CI 1.07 to 1.26) for total bilirubin concentration, 0.33 (95% CI 0.15 to 0.67) for enteral nutrition and 0.6 (95% CI 0.41 to 0.88) for any surgery. Coefficients of the extended model are provided in online supplemental material 2. Internal validation of the extended ProVent model in 234 patients not used for construction of the extended model yielded a Brier score of 0.18 and an AUROC of 0.81 (95% CI 0.76 to 0.87). At a threshold probability of 50%, TPR was 0.78 (95% CI 0.69 to 0.86), TNR was 0.66 (95% CI 0.57 to 0.75), PPV was 0.66 (95% CI 0.57 to 0.74) and NPV was 0.78 (95% CI 0.69 to 0.86). The optimal threshold probability that maximised Youden’s index was 48%. Calibration intercept was −0.27 (95% CI −0.57 to 0.03) and calibration slope was 1.10 (95% CI 0.78 to 1.41). Receiver operating characteristics curves are depicted in figure 2, and calibration plots are shown in figure 3.
Supplemental material
Decision curve analysis
Figure 4 presents the DCA of the original as well as the extended ProVent probability models. For this, we calculated net benefit, which can be interpreted as the number of true positives per 100 patients without any false positives, over the entire range of threshold probabilities, that is, from 0% to 100%. Up to threshold probabilities of 68%, net benefit of the original ProVent model is positive but declining. Above 68%, net benefit of the original ProVent model turns negative, indicating that the amount of false positive non-survivors is disproportionate to the number of correctly identified true positive non-survivors. Net benefit of the extended ProVent probability model does not differ from the original model up to a threshold probability of 45%, above which net benefit of the extended ProVent probability model exceeds net benefit of the original ProVent model. As such, the extended model can identify more true positive non-survivors and/or less false positives than the original model.

Decision curve analysis of original and extended ProVent probability models. A detailed description is provided in text.
Discussion
We performed the first external validation study of the ProVent score and its underlying logistic regressing model in a large Austrian patient cohort. We found that the ProVent model was able to discriminate between non-surviving and surviving patients adequately but—in contrast to previous studies—overestimated 1-year mortality. We were able to correct this through recalibration of the ProVent model and enhance model discrimination by including three easily available variables (total bilirubin concentration, provision of enteral nutrition and surgical status) as additional predictors in an extended ProVent model.
The ProVent model has been derived from a cohort of 300 patients enrolled between 2001 and 2005. Since then, the model has been externally validated several times with single-centre as well as multicentre cohorts from the USA,10 21 Asia22–24 and Europe.11 A common metric to assess discrimination is AUROC, which—in the context of the ProVent model—can be interpreted as probability that a non-surviving patient with CCI is assigned a higher probability of non-survival than a surviving patient. AUROC varied between previous studies between 0.64 and 0.79,10 22 with our results lying in the middle. However, the results of those studies are not readily comparable, as most validated only the ProVent score,11 22 24 which categorised the ProVent predictor variables depending on the magnitude of the regression coefficients in the ProVent logistic regression model. Simplification of prediction models in this way is common in medical research as it enables quick manual calculation but at the same time sacrifices predictive performance.25 As digitalisation becomes increasingly more incorporated into medicine and the automatic calculation of various scores becomes more readily available in patient data management systems, simplification of logistic regression models may no longer be needed. Because of this, we chose to validate the ProVent probability model in this study rather than the simplified ProVent score.
Besides model discrimination, evaluation of model calibration is equally important. Calibration refers to the agreement between predicted probability of death at 1 year as compared with actual 1-year mortality. In contrast to other external validation studies and in line with reporting guidelines for evaluation of statistical models,26 we report, for the first time, extensive calibration metrics of the ProVent probability model. We found that observed 1-year mortality was lower than in the ProVent derivation studies, which found nearly 100% mortality in patients with ProVent scores of 4 or 5.9 10 As a result, the ProVent model overestimated mortality in our patient cohort and specificity (ie, TNR) for death at 1 year at a threshold probability of 50% was 0.58 (95% CI 0.53 to 0.63) as compared with 0.91±0.16 in the original ProVent study. As such, the model, which was developed with the goal of a low false positive rate, underperformed in our study cohort.
Several factors could explain the varying performance of the ProVent model in our cohort compared with other studies. First, there are significant geographical differences regarding all aspects of critical care medicine: ICU bed number,27 28 availability, staffing and even the definition of what is considered an ICU bed.12 These all vary considerably between different regions and even in between European countries. This in turn influences the case-mix of admitted patients, their medical therapy prior to ICU admittance and after ICU discharge and therefore also the short-term and long-term outcomes of those patients.29 Indeed, it is known that geographical variance limits the international comparability of studies in critical care.13 Furthermore, the patient cohort used for the development of the ProVent score was recruited more than 10 years prior to our study. Subsequently, differences in therapy while admitted to the ICU, as well as after ICU discharge, likely influence patient outcomes. Another possible source of variation are different end-of-life care practices, which also vary considerably across geographical regions and have changed over recent years.30 31 Such variations could particularly contribute to differences in short-term mortality and thereby explain divergent performance of the ProVent probability model.
One shortcoming of traditional metrics of discrimination and calibration is the difficulty in applying it in clinical practice. While PPV, respectively NPV, can be useful in estimating whether the result of a prediction model will likely occur, they do not account for the consequences of false positives or negatives. DCA is an increasingly common method used to illustrate the value of prediction models and is recommended by current guidelines.26 In DCA, the net benefit of a given statistical model is analysed over a range of threshold probabilities. Net benefit represents the number of true positives identified minus a weighted number of false positives at a given threshold probability and can be interpreted as the number of true non-survivors identified by the ProVent probability model without any false positive non-survivors. Our study is the first to apply DCA to evaluate the ProVent model. First, we found that when applying the original model, net benefit turned negative at threshold probabilities above 68%. This can be interpreted as the application of the original, miscalibrated ProVent model leads to identifying relatively more false positive non-survivors than true non-survivors and that it could therefore be harmful. This confirms results from a simulation study that demonstrated negative net benefit following model miscalibration.32 Second, regarding net benefit, the recalibrated extended model was superior to the original one at higher threshold probabilities, which highlights the need for careful evaluation of predictive models before their implementation into clinical practice. Correct interpretation of DCA warrants careful consideration of the appropriate range of threshold probabilities, which is highly dependent on the clinical consequences resulting from being classified as non-survivor. In the case of low stakes decisions, such as mandatory ethics counselling, low threshold probabilities would be appropriate, whereas in the case of severe consequences, such as the decision to forego cardiopulmonary resuscitation or to limit surgical interventions, high thresholds probabilities are appropriate. Currently, there are no recommendations on which therapeutic measures are appropriate in patients with CCI. We therefore chose to present net benefit over the entire range of threshold probabilities.
We must recognise relevant limitations of our study: possible selection bias could have been introduced by excluding mechanically ventilated patients that had been transferred to our centre, but this was necessary as we did not have structured data on those patients prior to admittance to our hospital. In addition, we did not analyse data on pre-ICU and post-ICU therapy, patient comorbidities and do-not-resuscitate orders in place, all of which could have possibly been useful for the interpretation of our results. Furthermore, data on long-term outcomes, including patients’ cognitive and/or functional status, liberation from MV or place of living (eg, hospital, nursing facility or at home) were not available but are highly relevant and should be addressed in future studies. Given the ongoing COVID-19 pandemic, we did not include patients with COVID-19 induced acute respiratory distress syndrome in this study and as such, care must be taken when applying the ProVent model to those patients, who may have better long-term outcomes than the patients included in this study.33
In summary, we externally validated the ProVent probability model for prediction of 1-year mortality in a large cohort of patients with CCI. Model performance was in line with previous studies, adding to existing evidence that the ProVent model is generally robust. However, the original ProVent model overestimated 1-year mortality, and application of the unmodified probability model could therefore be harmful. The recalibrated and extended model provided good discrimination and calibration superior to the original ProVent model. Our study indicates that careful evaluation of prediction models is necessary before they are introduced into clinical practice. Future studies should evaluate how the application of the ProVent model can improve decision making in CCI and additionally investigate functional outcomes as well as long-term mortality.
Data availability statement
Data are available on reasonable request. The dataset analysed in this study is available from the authors on reasonable request.
Ethics statements
Patient consent for publication
Ethics approval
This study was approved by the ethics committee of the Medical University of Vienna, Austria (reference number 1926/2021). The need to obtain informed consent was waived by the ethics committee due to the retrospective nature of this study.
References
Supplementary materials
Supplementary Data
This web only file has been produced by the BMJ Publishing Group from an electronic file supplied by the author(s) and has not been edited for content.
Footnotes
Contributors CD and ES conceived and planned this study. CD and OK collected and analysed the data. All authors critically discussed and interpreted the data. CD drafted the first version of the article. All authors revised the manuscript, read and approved the final manuscript. CD and ES are the guarantors of the manuscript and accept full responsibility for the work and conduct of the study, had access to the data, and controlled the decision to publish.
Funding The authors have not declared a specific grant for this research from any funding agency in the public, commercial or not-for-profit sectors.
Competing interests None declared.
Patient and public involvement Patients and/or the public were not involved in the design, or conduct, or reporting, or dissemination plans of this research.
Provenance and peer review Not commissioned; externally peer reviewed.
Supplemental material This content has been supplied by the author(s). It has not been vetted by BMJ Publishing Group Limited (BMJ) and may not have been peer-reviewed. Any opinions or recommendations discussed are solely those of the author(s) and are not endorsed by BMJ. BMJ disclaims all liability and responsibility arising from any reliance placed on the content. Where the content includes any translated material, BMJ does not warrant the accuracy and reliability of the translations (including but not limited to local regulations, clinical guidelines, terminology, drug names and drug dosages), and is not responsible for any error and/or omissions arising from translation and adaptation or otherwise.