Article Text

Abstract
Objective Intake of white rice has been associated with elevated risk for type 2 diabetes (T2D), while studies on brown rice are conflicting. To inform dietary guidance, we synthesised the evidence on white rice and brown rice with T2D risk.
Design Systematic review and meta-analysis.
Data sources PubMed, EMBASE and Cochrane databases were searched through November 2021.
Eligibility criteria Prospective cohort studies of white and brown rice intake on T2D risk (≥1 year), and randomised controlled trials (RCTs) comparing brown rice with white rice on cardiometabolic risk factors (≥2 weeks).
Data extraction and synthesis Data were extracted by the primary reviewer and two additional reviewers. Meta-analyses were conducted using random-effects models and reporting followed the Preferred Reporting Items for Systematic Reviews and Meta-Analyses guidelines. Risk of bias was assessed using the Newcastle Ottawa Scale for prospective cohort studies and the Cochrane Risk of Bias Tool for RCTs. Strength of the meta-evidence was assessed using NutriGrade.
Results Nineteen articles were included: 8 cohort studies providing 18 estimates (white rice: 15 estimates, 25 956 cases, n=5 77 426; brown rice: 3 estimates, 10 507 cases, n=1 97 228) and 11 RCTs (n=1034). In cohort studies, white rice was associated with higher risk of T2D (pooled RR, 1.16; 95% CI: 1.02 to 1.32) comparing extreme categories. At intakes above ~300 g/day, a dose–response was observed (each 158 g/day serving was associated with 13% (11%–15%) higher risk of T2D). Intake of brown rice was associated with lower risk of T2D (pooled RR, 0.89; 95% CI: 0.81 to 0.97) comparing extreme categories. Each 50 g/day serving of brown rice was associated with 13% (6%–20%) lower risk of T2D. Cohort studies were considered to be of good or fair quality. RCTs showed an increase in high-density lipoprotein-cholesterol (0.06 mmol/L; 0.00 to 0.11 mmol/L) in the brown compared with white rice group. No other significant differences in risk factors were observed. The majority of RCTs were found to have some concern for risk of bias. Overall strength of the meta-evidence was moderate for cohort studies and moderate and low for RCTs.
Conclusion Intake of white rice was associated with higher risk of T2D, while intake of brown rice was associated with lower risk. Findings from substitution trials on cardiometabolic risk factors were inconsistent.
PROSPERO registration number CRD42020158466.
- general diabetes
- public health
- nutrition & dietetics
- epidemiology
Data availability statement
Data are available upon reasonable request. The study data set can be requested from VSM: vasanti.malik@utoronto.ca.
This is an open access article distributed in accordance with the Creative Commons Attribution Non Commercial (CC BY-NC 4.0) license, which permits others to distribute, remix, adapt, build upon this work non-commercially, and license their derivative works on different terms, provided the original work is properly cited, appropriate credit is given, any changes made indicated, and the use is non-commercial. See: http://creativecommons.org/licenses/by-nc/4.0/.
Statistics from Altmetric.com
STRENGTHS AND LIMITATIONS OF THIS STUDY
This systematic review and meta-analysis on rice intake and risk of type 2 diabetes (T2D) is the most comprehensive evidence synthesis to date that includes findings from both prospective cohort studies of hard endpoints and trials of intermediate cardiometabolic risk factors.
Key strengths include the large sample size and long duration of follow-up of cohort studies from different parts of the world, use of systematic methods including risk of bias and evidence grading specific for nutrition research, categorical and dose–response analyses and a number of sensitivity analyses to assess the robustness of the results.
Only three cohorts with data on brown rice were included in the meta-analysis, all of which were conducted among US health professionals, which limits the generalisability of the findings.
The overall strength of the meta-evidence from cohort studies was considered moderate and moderate and low for randomised controlled trials, thus the assessment of rice intake on T2D risk relies on observational studies and trials of limited quality on intermediate risk factors.
Introduction
The prevalence of type 2 diabetes (T2D) has continued to increase worldwide, especially in low-income and middle-income countries (LMICs),1 where economic development and urbanisation are fuelling these trends.2 Since rice is a staple food in many cultures and is predominant in most Asian diets, it is hypothesised that improving diet quality by replacing white rice with brown rice could play an important role in the prevention of T2D.3 White rice is a product of refining and polishing of the intact rice grain with the removal of the outer bran and germ layers, leaving the starchy endosperm as the primary component. In contrast, brown rice, an intact whole grain, retains the bran and germ along with the fibre, vitamins and minerals contained in these layers of the grain. Dietary fibre and certain micronutrients such as magnesium found in the intact rice grain have been independently associated with lower risk of T2D.4 Brown rice also tends to have a lower glycaemic index (GI) compared with white rice, due to a higher fibre content and slower rate of absorption, although variability in GI exists across rice strains.5 6
Epidemiological studies have linked intake of refined grains, including white rice, to a higher risk of T2D, while intake of whole grains, such as brown rice, has been linked to lower risk.7–9 Previous meta-analyses of cohort studies have shown positive associations between white rice intake and the risk of T2D particularly in Asian populations.10 11 Since these publications, a number of new studies have been published, providing data from additional world regions. In contrast to cohort studies, findings from randomised controlled trials (RCTs) comparing white rice with brown rice have been inconsistent. Two recent meta-analyses of RCTs found a benefit of brown rice compared with white rice on body weight but discrepant results on waist circumference and lipid parameters.12 13 However, these meta-analyses combined studies conducted among participants with and without T2D, which may have differential effects on macronutrient metabolism. To provide a current synthesis of the evidence, we conducted an updated systematic review and meta-analysis of cohort studies that examined intake of white rice and risk of T2D including a dose–response analysis. We also conducted separate meta-analyses on cohort studies of brown rice and risk of T2D and on RCTs that compared effects of brown rice and white rice on intermediate cardiometabolic risk factors among participants without T2D, in order to provide a comprehensive assessment of rice consumption and T2D risk.
Methods
Patient and public involvement
No patient involved.
Literature search
To assess the relationship between rice intake and the risk of T2D, we conducted three a priori separate meta-analyses: (1) prospective cohort studies of white rice intake and risk of T2D; (2) prospective cohort studies of brown rice intake and risk of T2D and (3) RCTs comparing effects of brown rice and white rice intakes on risk factors for T2D. Relevant articles were identified by searching electronic databases PubMed, EMBASE and the Cochrane library from their respective index dates to November 2021. The search strategy incorporated Medical Subject Headings, and Title/Abstract (tiab) terms for all three databases with search/key terms related to rice and risk of T2D and T2D risk factors or biomarkers (online supplemental table 1). Additional articles were identified from reference lists of included studies and relevant reviews.
Supplemental material
Study selection
Studies were considered for inclusion in our meta-analysis based on the following criteria: (1) prospective cohort studies with at least 1 year of follow-up or RCTs with at least 2 weeks of intervention among healthy human participants aged ≥18 years without a diagnosis of T2D at baseline; (2) specified brown rice or white rice (or polished rice) intake as the exposure in cohort studies or comparison of brown rice versus white rice as the intervention in RCTs; (3) reported multivariable-adjusted relative risks (RR) with 95% CI for the association between white or brown rice intake and risk of T2D from cohort studies or the difference in changes of at least one biomarker of cardiometabolic risk (fasting blood glucose (FBG), HbA1c, HOMA-IR, triglycerides, total cholesterol, low-density lipoprotein (LDL)-cholesterol, high-density lipoprotein (HDL)-cholesterol, waist circumference, systolic blood pressure and diastolic blood pressure) between intervention and control groups from RCTs. We excluded articles that were not original research (ie, reviews, letters, conference proceedings or commentaries) or studies that combined rice intake with other dietary factors or lifestyle factor as a composite exposure. We did not consider case–control, cross-sectional or ecologic studies or the grey literature for inclusion or studies that were conducted in animal models. No language restrictions were applied. Titles and abstracts of identified studies were screened by the primary reviewer (JY), and potentially relevant articles were selected for full-text review, which was performed independently by the primary reviewer and two additional reviewers (SJ and MT). Any discrepancies were resolved through discussion with an additional author (VSM).
Data extraction
For each article identified, we extracted information on the following: study characteristics (authors, publication year, type of study, region/country, number of participants and duration); participant characteristics (sex, age, baseline weight/health status); type of rice consumed; quantity of rice consumed (g/d); cooking method; type of dietary assessment (eg, Food Frequency Questionnaires, 24-hour diet recall); RCT design (crossover, parallel and cluster); intervention and control modality and analysis strategy (statistical models and covariates). For prospective cohort studies, we extracted multivariable adjusted RRs and 95% CIs and confounder information. For RCTs, we extracted means and SEs of between-group difference in biomarkers of cardiometabolic risk (FBG, HbA1c, HOMA-IR, triglycerides, total cholesterol, LDL-cholesterol, HDL cholesterol, waist circumference, systolic blood pressure and diastolic blood pressure) from baseline to the end of follow-up. If a trial did not report the SE for the measurement of change, we imputed this value by using the correlation coefficient method referenced in the Cochrane Handbook for Systematic Reviews of Interventions.14 For the trial by Ren et al,15 which reported on four different brown rice interventions with different rice drying processes, we extracted data for the comparison of standard brown rice with polished white rice, which is most consistent with the other studies in this meta-analysis.
Data synthesis and analysis
Random-effects models were used to provide summary estimates for all analyses, however fixed-effects models were also calculated, which is the preferred method when fewer than five estimates are available for analysis.16 For meta-analyses of prospective cohort studies of white rice and brown rice, the summary RRs were estimated along with corresponding 95% CIs, comparing extreme categories of intake. For RCTs, the mean between-group difference in biomarkers of T2D risk with SE was estimated with the brown rice group considered as the intervention and white rice group, the control. The I2 statistic and Q-statistic with a corresponding p-value were used to assess heterogeneity between the included studies. In general, an I2 value below 30% represented low heterogeneity; between 30% and 60% represented moderate heterogeneity and greater than 70% represented significant heterogeneity.14 To further explore potential sources of heterogeneity among cohort studies, meta-regression and subgroup analyses by sex, age, duration of follow-up, geographic region and adjustment for diet quality (as defined in individual studies as adjustment for key dietary factors or diet quality score) were conducted. The subgroups for geographic region were consistent with those reported in the Prospective Urban Rural Epidemiology (PURE) study, published by Bhavadharini et al,17 as follows: China, South Asia (India, Pakistan and Bangladesh) and the rest of the world. The study by Seah et al which included Chinese adults in Singapore was included with studies in China.18 We also conducted an additional subgroup analysis according to whether rice is typically consumed as a staple food in a given country. To assess the influence of individual cohort studies on the results, we conducted sensitivity analysis by systematically omitting one study at a time and recalculating the summary estimate. Fixed-effects cubic spline models were used to assess the dose–response for cohort studies evaluating white rice intake (per 1 serving, ie, 158 g increment) and fixed-effects fractional polynomial models were used to assess the dose–response for brown rice intake (per 50 g increment), given the smaller sample size and lower intake level across studies. A serving size of 50 g/d for brown rice was used to reflect real-world intake levels. For studies that did not report person-years, these values were calculated by multiplying the number of participants in each category by years of follow-up. For the study by Hodge et al,19 which did not report the number of cases per category, these were calculated using the reported RR and the following formula  .20 In this study, since the number of participants per category was not reported, person years were calculated by taking the total number of person-years divided by four as the dose category was reported in quartiles.
The assessment of individual study quality was done using the Newcastle Ottawa Scale (NOS) for prospective cohort studies and the Cochrane Risk of Bias Tool for randomised trials (RoB-2) for RCTs. The overall strength of our meta-analysis was assessed using the NutriGrade scoring system, which was specifically designed to assess meta-evidence in nutrition research.21 NutriGrade is based on seven criteria (eight criteria for cohorts) with an overall score ranging from 0 to 10: risk of bias, precision, heterogeneity, directness, publication bias, funding bias and study design (for RCTs), effect size and dose–response (for cohorts). An overall score below four denotes evidence of very low quality. Scores of 4–5.99 and 6–7.99 denote low and moderate quality evidence, respectively. A score of 8 or higher denotes high quality meta-evidence. For meta-evidence from RCTs, we applied NutriGrade to outcomes that were measured in all included studies. Visual inspection of Funnel plots and Begg’s and Egger’s tests were used to assess potential publication bias. All analyses were performed using Stata V.16.0 (StataCorp).
Results
Literature search
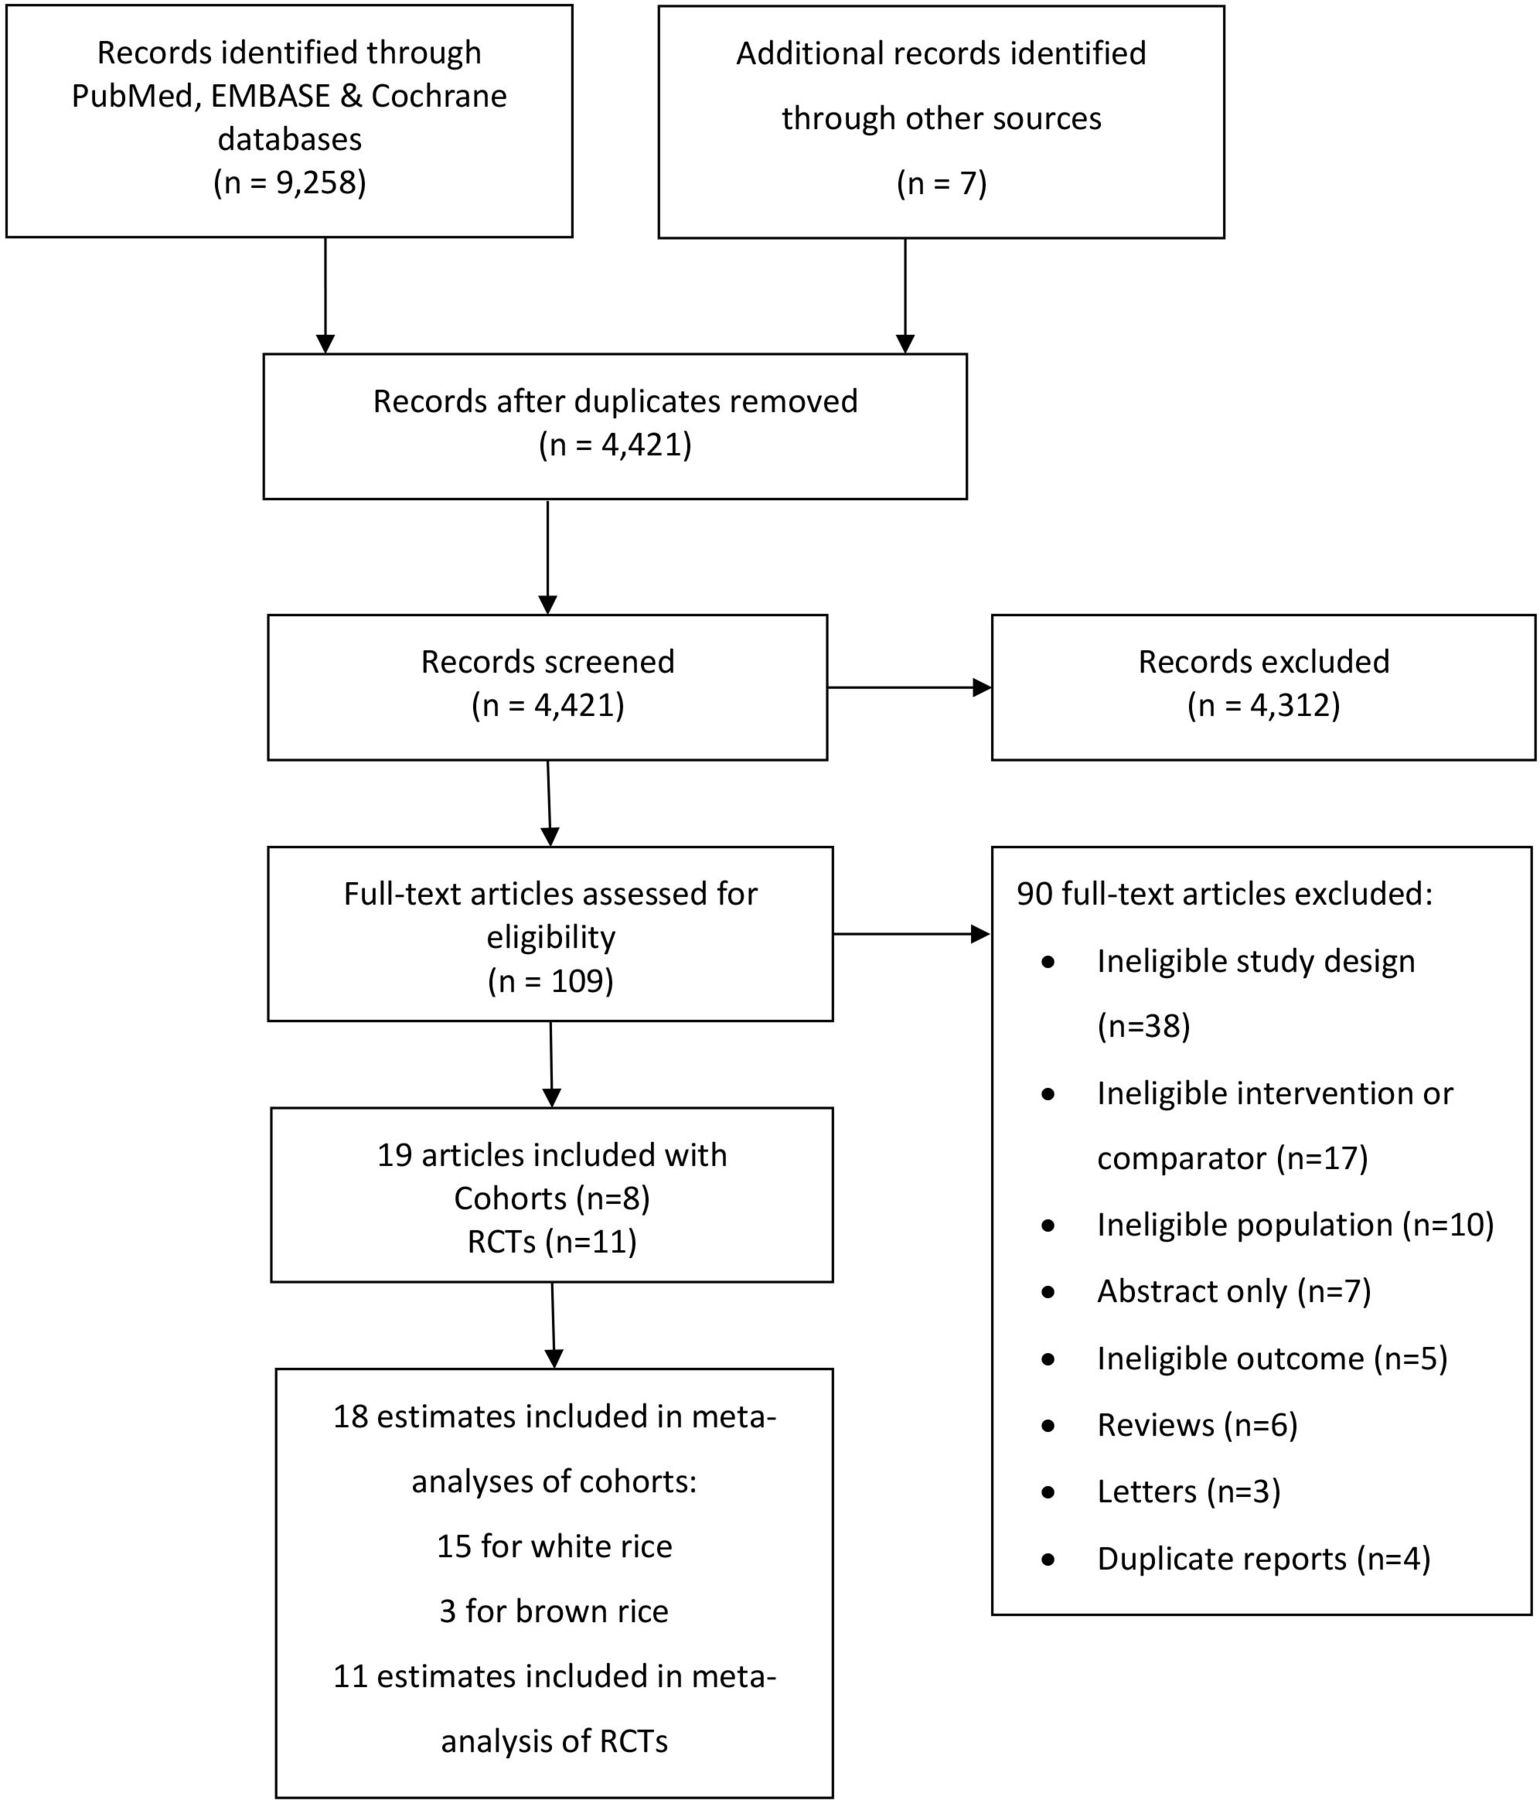
Our literature search yielded 9258 articles, with 3098 from PubMed, 4390 from EMBASE, 1770 from Cochrane and 7 external sources (figure 1). After removing duplicates, the remaining 4421 articles were screened according to our inclusion criteria, resulting in 109 articles for full-text review. We further excluded 4 duplicates, 6 reviews, 3 letters, 70 articles that did not meet our inclusion criteria (ineligible study design, intervention/comparator, population or outcome) and 7 articles without a full-text source (ie, conference abstracts). After final exclusions, 19 original articles were included in our meta-analysis, 8 of which were prospective cohort studies8 17–19 22–25 and 11 RCTs.15 26–35 For cohort studies that reported sex-specific estimates, the individual estimates were considered separately in the meta-analysis, yielding a total of 18 estimates (15 for white rice and 3 for brown rice) for inclusion in the meta-analysis.

Literature search and study selection. RCTs, randomised controlled trials.
Study characteristics
Characteristics of the prospective cohort studies of white rice and brown rice included in the meta-analysis are shown in table 1.
Characteristics of prospective cohort studies of white rice and brown rice intake and risk of type 2 diabetes (T2D)
Studies represented multiple geographic regions including China, South Asia, the Middle East, Europe, Australia and the USA. There was a total of 577 426 participants from eight prospective cohort studies (providing 15 estimates) of white rice intake with a mean duration of 8.8 years (1–22 years), during which, 25 956 cases of T2D were reported. The 3 cohorts of brown rice intake included 197 228 participants with 14–22 years of follow-up and 10 507 cases of T2D from one study of US health professionals.8 For all studies, participants ranged in age from 18 to 87 years, the majority of whom were women. Food Frequency Questionnaires (FFQs) were used exclusively for dietary assessment and most of the cohort studies were considered to be of good or fair quality with a NOS score above 5, except for studies by Nanri et al23 and Soriguer et al,24 which were considered poor quality due to downgrades for high attrition, poor comparability and inadequate control for confounding. Key covariates, such as age, sex, body mass index, physical activity and total energy intake, were adjusted in all studies, except for the study by Soriguer et al, which adjusted for age, sex, glucose metabolism and carbohydrate intake24 (online supplemental table 2). Characteristics of RCTs included in the meta-analysis are shown in table 2.
Characteristics of RCTs replacing white rice with brown rice on type 2 diabetes (T2D) risk factors
There was a total of 1034 participants and intervention periods ranged from 1 month (4 weeks) to 24 months (104 weeks). Studies by Kazemzadeh et al28 and Malik et al30 used a crossover design with a 2-week washout period and the study by Shimabukuro et al34 used a crossover design with no washout, while the other studies were parallel trials. Eight studies specified the type of rice or processing method used in the intervention.15 29–33 Araki et al used partially abraded brown rice (PABR) compared with white rice29 and Malik et al used parboiled brown rice compared with non-parboiled white rice of the same strain (BPT5204).30 Geng et al,32 Mai et al31 and Bui et al35 used pregerminated brown rice as the intervention compared with white rice. Kuroda et al used ultra-high hydrostatic pressurising brown rice compared with white rice33 and Ren et al and Shimabukuro et al used the Japonica cultivar (Suijing 18 paddy rice) with the husk removed compared with polished white rice of the same strain.15 34 Studies by Ren et al15 and Bui et al35 were considered to have a high risk of bias, while studies by Zhang et al26 and by Mai et al31 were considered to have a low risk of bias. The remaining studies were found to have some concern for risk of bias, primarily due to the randomisation process and intended intervention. Details of the outcomes from the RCTs are shown in online supplemental table 3.
White rice intake and risk of type 2 diabetes
As shown in figure 2, intake of white rice was associated with higher risk of T2D, with a pooled RR of 1.16 (1.02–1.32) comparing extreme categories. Significant heterogeneity was observed among the estimates, with an I2 value of 73%. The fixed-effects model was similar, with a pooled RR of 1.13 (1.06–1.20). Stratified analysis by sex, age, follow-up period, adjustment for diet quality, geographic region and regional rice consumption habits showed some differences in estimates across subgroups (online supplemental figures 1–6). However, none of the differences across subgroups were statistically significant. I2 values were not materially different in overall estimates compared with stratified results suggesting other potential sources of heterogeneity.

Forest-plot of white rice consumption and risk of type 2 diabetes (T2D). Risk of T2D (RR and 95% CI) comparing extreme categories of white rice intake from prospective cohort studies. Horizontal lines denote 95% CIs; solid squares represent the point estimate of each study with the size proportional to study weight. Open diamonds represent pooled estimates from the random-effects model (DerSimonian-Laird) and fixed-effects model based on 15 cohort studies (n=5 77 426). Study weights are from the random-effects analysis. The I2 and p values for heterogeneity are shown. The red vertical line represents unity. F, female; GCS, Golestan Cohort Study; HPFS, Health Professionals Follow-up Study; JPHC, Japan Public Health Center-based Prospective Study; M, male; MCC, Melbourne Collaborative Cohort Study; NHS, Nurses’ Health Study; PS, Pizarra Study; PURE, Prospective Urban Rural Epidemiology Study; SCHS, Singapore Chinese Health Study; SWHS, Shanghai Women’s Health Study; TLGS, Tehran Lipid and Glucose Study.
Brown rice intake and risk of type 2 diabetes
We observed an inverse association between intake of brown rice and the risk of T2D, with a pooled RR of 0.89 (0.81–0.97) comparing extreme categories with an I2 value of 0% (figure 3). Results from the fixed-effects model were identical.

Forest-plot of brown rice consumption and risk of type 2 diabetes (T2D). Risk of T2D (RR and 95% CI) comparing extreme categories of brown rice intake from prospective cohort studies. Horizontal lines denote 95% CIs; solid squares represent the point estimate of each study with the size proportional to study weight. Open diamonds represent pooled estimates from the random-effects model (DerSimonian-Laird) and fixed-effects model based on three cohort studies (n=197 228). Study weights are from the random-effects analysis. The I2 and p values for heterogeneity are shown. The red vertical line represents unity. HPFS, Health Professionals Follow-up Study; NHS, Nurses’ Health Study.
Dose–response analysis
The fixed-effects cubic spline for intake of white rice in relation to risk of T2D showed a non-linear relationship between intake of white rice and risk of T2D (p-value for non-linearity<0.001) at consumption levels below ~300 g/d (cooked weight) (figure 4). At intakes above this threshold, each one serving (158 g cooked weight) increment in white rice intake was associated with a 13% higher risk of T2D (RR: 1.13; 95% CI: 1.11 to 1.15, p value for linearity, <0.001). In subgroup analysis, a similar threshold was observed among studies that were not conducted in China or South Asia (rest of the world) while a j-shaped association was observed in studies that were conducted in China, and a linear dose–response was observed in studies that were conducted in South Asia (online supplemental figure 7). When stratified by regional rice consumption habits, a j-shaped association was observed in countries that typically consume rice as a staple, likely driven by studies from China, while a linear dose–response was observed in countries that do not typically consume rice as a staple and the rest of the world (online supplemental figure 8).

Dose–response meta-analysis of white rice consumption and risk of type 2 diabetes (T2D). Fixed-effects cubic spline for intake of white rice in relation to risk of T2D. Black solid line represents the point estimates and the black dashed lines represent the corresponding 95% CI’s. The red solid line indicates the exact linear relationship and red dashed line represents unity. A departure from linearity was observed at intake levels below ~300 g/d (cooked weight) (p value for non-linearity<0.001). RR at 1 serv/d (158 g): 0.97; 95% CI: 0.92 to 1.02. A linear dose–response was observed at intake levels above 300 g/day with each serving/day (158 g) increment associated with a 13% higher risk of T2D (RR: 1.13; 95% CI: 1.11 to 1.15, p value for linearity, <0.001).
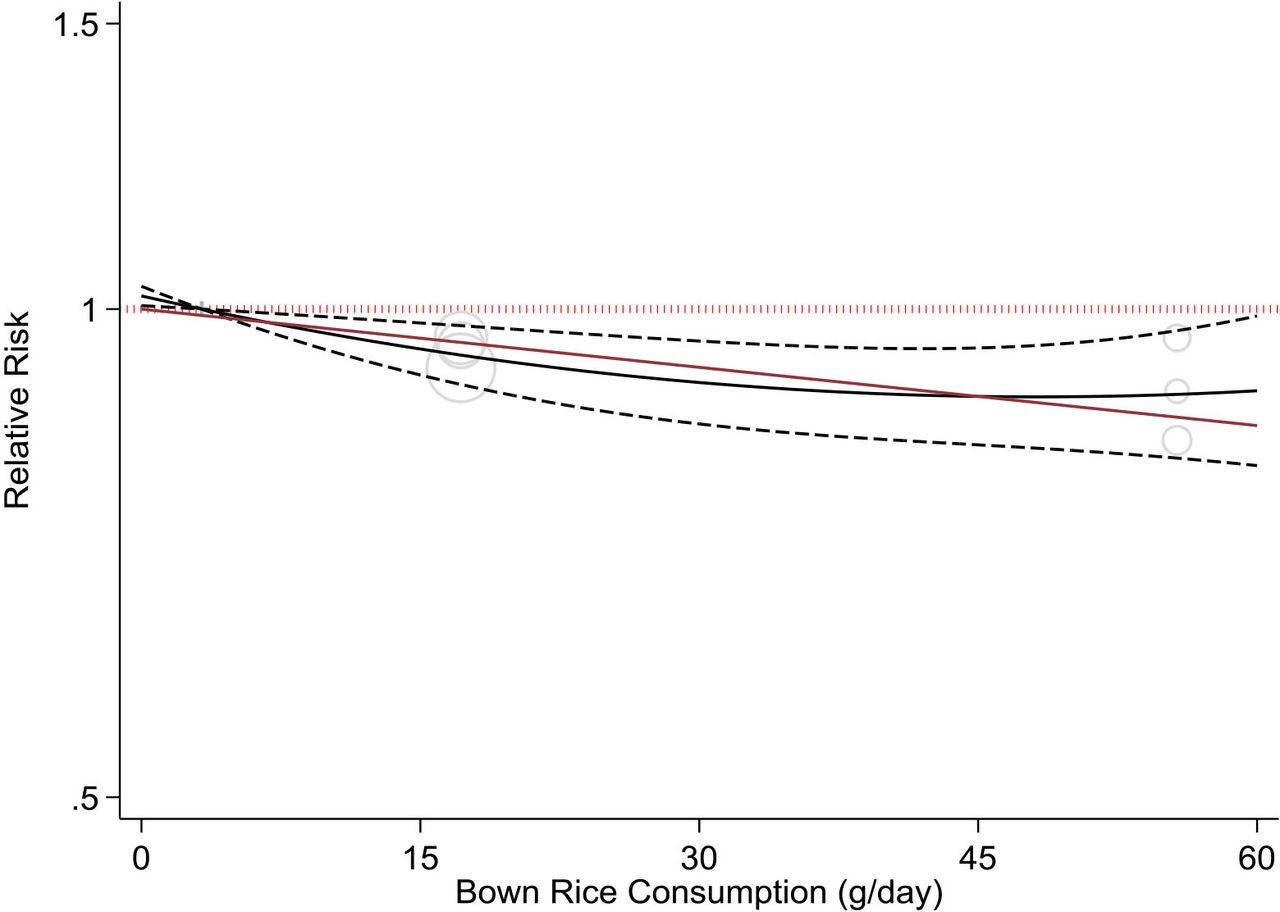
The non-linear polynomial model for intake of brown rice showed no evidence of non-linearity between brown rice consumption and risk of T2D (p-value for non-linearity=0.13) (figure 5). Each 50 g/d (cooked weight) increment in brown rice intake was associated with a 13% lower risk of T2D (RR: 0.87; 95% CI: 0.80 to 0.94, p value for linearity=0.001).
Dose–response meta-analysis of brown rice consumption and risk of type 2 diabetes (T2D). Non-linear polynomial model for intake of brown rice in relation to risk of T2D. Black solid line represents the point estimates and the black dashed lines the corresponding 95% CIs. The red solid line indicates the exact linear relationship and the red dashed line represents unity. No departure from linearity was observed (p value for non-linearity, 0.13). RR at 50 g/d (cooked weight): 0.88; 95% CI: 0.82 to 0.95. A linear dose–response was observed with each 50 g/d increment associated with a 13% lower risk of T2D (RR: 0.87; 95% CI: 0.80 to 0.94, p value for linearity, 0.001).
Randomised controlled trials
The between-group difference in HDL cholesterol (0.07 mmol/L; 0.00 to 0.13 mmol/L) was statistically significant in favour of the brown rice group with moderate to high heterogeneity detected (I2=69.56 %) (table 3, online supplemental figure 9). Results from the fixed-effects model were similar. There was also a significant between-group difference for systolic blood pressure in favour of the brown rice group (−3.73 mm Hg; −7.04 to −0.41) with high heterogeneity (I2=76.22%), although findings from the fixed-effects model were null, likely due to larger statistical weight being given to smaller studies in the random-effects model (table 3, online supplemental figure 10). No other between-group differences were observed (table 3, online supplemental figures 11–18). However, differences in diastolic blood pressure (−2.26 mm Hg; −4.54 to 0.01; I2=78.55 %), HOMA-IR (−0.14; −0.43 to 0.15; I2=0 %), total cholesterol (−0.07 mmol/L; −0.23 to 0.09 mmol/L; I2=58.37 %), HbA1c (−0.05%; −0.14 to 0.05%; I2=42.66 %), LDL-cholesterol (−0.05 mmol/L; −0.25 to 0.16; I2=82.95%), FBG (−0.06 mmol/L; −0.23 to 0.11; I2=59.56%), and waist circumference (−0.79 cm; −2.11 to 0.53; I2=76.97 %) favoured the brown rice group.
Pooled estimates for between-group difference in type 2 diabetes (T2D) risk factors from RCTs replacing white rice with brown rice
Influence analysis
The influence analysis for cohort studies of white rice intake (online supplemental figure 19) showed a reduction in magnitude of the pooled RR with the omission of the study by Villegas et al (1.10; 95% CI: 0.99 to 1.22) conducted in the Shanghai Women’s health Study. However, results were consistent with the overall pooled RRs, suggesting a higher risk of T2D associated with white rice intake. The lack of substantial differences in the pooled RR with the removal of the individual studies suggested that no individual study had a predominant effect on the meta-analyses. Influence analysis for meta-analyses of RCTs for outcomes that were assessed in all 11 studies (FBG, HDL-cholesterol, LDL-cholesterol and triglycerides) is shown in online supplemental figures 20–23. For FBP, when the study by Bui et al was removed, the pooled estimate increased (online supplemental figure 20); for HDL cholesterol when the study by Mai et al was removed, the pooled estimate decreased (online supplemental figure 21); and for LDL cholesterol when the study by Kazemzadeh et al was removed, the pooled estimate decreased, and when the study by Geng et al was removed, the pooled estimate increased (online supplemental figure 22). However, these changes were not material as the 95% CI of the effect estimates when individual studies were left out overlapped with the overall pooled summary estimate. Influence analysis was not conducted for cohort studies of brown rice or RCTs of other outcomes due to insufficient studies.
Publication bias
The Funnel plot for the meta-analysis of cohort studies of white rice intake and risk of T2D showed an asymmetric shape, suggesting the presence of potential publication bias (online supplemental figure 24). However, according to Egger’s test (p-value, 0.68), the presence of potential publication bias is unlikely. Funnel plots for meta-analyses of RCTs for outcomes that were assessed in all 11 studies (FBG, HDL-cholesterol, LDL-cholesterol and triglycerides) are shown in online supplemental figures 25–28. Based on the shape of the plots, potential publication bias may be present in meta-analyses of HDL-cholesterol and FBG with marginal p-values from Egger’s test. Publication bias was not assessed for cohort studies of brown rice or for RCTs of other outcomes due to insufficient studies.
Strength of the evidence
NutriGrade scores to assess the overall strength of the meta-evidence from cohort studies of white rice and brown rice were 6.3 and 6.4 respectively, suggesting that the strength of the evidence from these meta-analyses was moderate (online supplemental table 4). Across the individual domains of NutriGrade, the following downgrades were applied: risk of bias for studies of white rice based on mean NOS score; heterogeneity for studies of white rice based on I2 ≥40%; publication bias for studies of brown rice since there were <5 studies; and effect size for studies of white rice and brown rice since pooled RRs were 0.80–1.20 comparing extreme categories. NutriGrade scores for RCTs ranged from 5.9 to 6.9 for outcomes that were assessed in all 11 studies, suggesting that the strength of the evidence from these meta-analyses was considered moderate and low. Across individual domains of NutriGrade, the following downgrades were applied: risk of bias for all outcomes based on Cochrane RoB-2; precision for LDL cholesterol, TG’s and FBG since 95% CI of pooled mean difference included the null value; heterogeneity for HDL and LDL cholesterol and FBG based on I2 ≥40%; publication bias for HDL cholesterol and FBG and funding bias for all outcomes since affiliation with private institutions and foundations were noted for some studies (online supplemental table 4).
Discussion
In our meta-analysis of prospective cohort studies of rice intake and risk of T2D, we found a positive association between intake of white rice and risk of T2D. Associations appeared stronger in women compared with men, and in studies conducted in South Asia compared with China and other world regions, although differences across subgroups were not statistically significant. Overall, these findings are consistent with previous meta-analyses that also reported a positive association between white rice intake and risk of T2D.10 11 However, in the present meta-analysis that included a number of additional studies from other countries, we observed a linear dose–response at intake levels above 300 g/day (cooked weight) (~2 servings), suggestive of a threshold. From our subgroup analysis, it appeared that this threshold may be driven by the j-shaped association observed for studies conducted in China. In contrast, a linear dose–response association was observed for studies conducted in South Asia. The reason for this difference is not clear but could relate to regional differences in the type of rice that is consumed, other foods that are consumed with rice and how rice is prepared. It is also possible that ethnic differences in the pathophysiological response to high glycaemic load (GL) diets could be implicated.36 Our meta-analysis also found an inverse association between brown rice and risk of T2D. Results from the dose–response analyses were consistent with each 50 g/day (cooked weight) increment of brown rice associated with a 13% lower risk of T2D.
While the findings of our meta-analyses of cohort studies support the replacement of white rice with brown rice for T2D risk mitigation, findings from our meta-analysis of RCTs replacing white rice with brown rice on T2D risk factors were inconsistent with a significant benefit observed only for HDL-cholesterol and SBP, although findings for SBP were null in the fixed-effects model. These results are in agreement with a previous meta-analysis of RCTs of brown rice on metabolic parameters that also found a benefit on HDL-cholesterol,12 although another meta-analysis of RCTs found no effect of brown rice compared with white rice on HDL-cholesterol.13 Both of these meta-analyses, included fewer studies than ours, and combined study populations with prediabetes and T2D, which could have different effects on metabolism. However, these meta-analyses also found a benefit of brown rice compared with white rice on body weight, which was not assessed in our meta-analysis, suggesting a therapeutic role of brown rice on weight management among patients with prediabetes and T2D.12 Reasons for the discrepant results between our meta-analyses of cohort studies and trials may be due to the low quality and methodological limitations of the included trials including small sample size, high drop-out rates and difficulty monitoring compliance. The duration of the majority of studies ranged from 4 to 16 weeks, which may have been insufficient to detect meaningful changes in clinical indices among predominately healthy populations. In addition, the RCTs included in our meta-analysis evaluated the effect of replacing white rice with brown rice under real-world settings without participant blinding and are more an assessment of intervention delivery rather than causality.
The main difference between brown rice and white rice is in the method of processing. Polishing of white rice strips the outer bran and germ layers of the grain, resulting in the loss of fibre and other nutrients present in the bran, leaving the starchy endosperm. Unlike white rice, brown rice is not milled and contains both the germ and bran. These parts of the grain contain numerous phytochemicals including polyphenols, phytosterols and lignans, as well as vitamins, minerals, essential fatty acids and dietary fibre, many of which have been linked to T2D prevention. A meta-analysis by the WHO found consistent evidence for benefits of consuming dietary fibre and whole grains on several non-communicable diseases including T2D.7 Recent findings from the PURE study found that a high intake of refined grains was associated with higher risk of mortality and cardiovascular disease.37 Brown rice contains nearly exclusively insoluble cereal fibre, which has been consistently associated with improved insulin sensitivity and reduced risk for T2D.38 39 These benefits may be due in part to the production of short-chain fatty acids in the large intestine through fermentation of fibre by gut microbiota.40 Diets high in cereal fibre have also been linked to a low GI and GL, due to slower digestion and absorption of glucose into circulation. Previous studies have shown that diets high in GI and GL can lead to an increased glycaemic response and insulin resistance41 and have been associated with higher risk of cardiometabolic diseases and death.42 43 The GI of brown rice is generally lower than white rice, however, values can vary depending on the milling process, strain of rice, growing conditions and method of preparation.6 44 45 In our meta-analysis of RCTs, six of the nine studies specified the strain of rice or processing method, which could impact the glycaemic response. For example, in the study by Malik et al30 parboiled brown rice was used, which undergoes a premilling process that often leads to a lower GI although differences in parboiling techniques can yield differential impacts on GI.46 A previous feeding trial demonstrated that parboiled brown rice but not brown rice reduced postprandial blood glucose levels compared with white rice47 and a meta-analysis of RCTs found that pregerminated brown rice has better functional effects on the lipid profile and FBG compared with brown rice.13 The adverse effects of high GI and GL diets tend to be more pronounced in individuals with excess adiposity, who are more likely to have insulin-resistance compared with lean individuals.48 Since our meta-analysis was conducted among predominantly healthy populations and we were unable to stratify by weight status given the available data, we were not able to explore that relation.
Subgroup findings from our meta-analysis showed that the positive association between white rice and risk of T2D was strongest in studies conducted in South Asia compared with studies in Chinese populations or other parts of the world, although differences were not statistically significant. Of note, three of the four studies conducted among Chinese populations showed no association between white rice and risk of T2D. This could be due in part to intake of vegetables, meat and seafood with rice in mixed dishes that is typical in the Chinese diet, which can reduce dietary GL. In countries in South Asia, such as India, high intakes of white rice are consumed in the context of diets low in protein and other nutrients, which may be a key regional driver of T2D risk.17 The differential associations between white rice and T2D risk across Asian populations warrants further investigation.
This systematic review and meta-analysis on rice intake and risk of T2D is the most comprehensive synthesis of the evidence to date that includes findings from both prospective cohort studies of hard endpoints and trials of intermediate cardiometabolic risk factors. Key strengths include the large sample size and long duration of follow-up of cohort studies from different parts of the world. We also used systematic methods including risk of bias and evidence grading specific for nutrition research, conducted categorical and dose–response analyses and a number of sensitivity analyses to assess the robustness of our results.
Rice, predominantly consumed as a refined grain, is a staple food for more than 50% of the world’s population.49 Our findings have broad implications given the widespread consumption of rice particularly in LMICs where T2D and related comorbidities are rapidly rising. However, several limitations should be noted. Only three cohorts with data on brown rice consumption8 were included in the meta-analysis, all of which were conducted among predominantly white health professionals in the USA with fairly low intake. Although these studies were adjusted for a number of lifestyle factors, residual confounding remains a concern and generalisability of the findings to other populations is limited. We had too few studies to conduct subgroup analyses for cohort studies of brown rice and RCT outcomes. Our categorisation of geographic regions into China, South Asia and the rest of the world may have masked the effects of cultural variation in the diet in individual countries and ethnic/racial variations in T2D risk as we were unable to extract data on ethnicity. Despite conducting several subgroup analyses, heterogeneity persisted in our meta-analysis of white rice intake in cohort studies. Although individual cohort studies adjusted for a number of confounders including diet quality, residual confounding remains a concern, particularly by socioeconomic status. However, the majority of cohort studies were considered to be of good or fair quality, while RCTs were considered to have low or some concern for risk of bias. Finally, the overall strength of the meta-evidence from cohort studies was considered moderate and moderate and low for RCTs. There are no RCTs with hard endpoints on this topic, thus the assessment of rice intake on T2D risk relies on observational studies and trials of limited quality on intermediate risk factors. As randomised trials comparing brown rice with white rice on T2D incidence as the endpoint may not be feasible, further RCTs on intermediate risk factors and cohort studies comparing white rice with brown rice and other whole grains would be useful.
In conclusion, this systematic review and meta-analyses provides additional support for a positive association between white rice intake and risk of T2D. Findings also suggest that brown rice is inversely associated with risk of T2D, although results are based on limited data. Replacing white rice with brown rice or other whole grains has the potential to be a low-cost and feasible lifestyle strategy to improve diet quality and help reduce T2D risk.
Supplemental material
Data availability statement
Data are available upon reasonable request. The study data set can be requested from VSM: vasanti.malik@utoronto.ca.
Ethics statements
Patient consent for publication
References
Supplementary materials
Supplementary Data
This web only file has been produced by the BMJ Publishing Group from an electronic file supplied by the author(s) and has not been edited for content.
Footnotes
Contributors VSM conceived of the study. JY and VSM wrote the study protocol and designed the analysis. JY registered the protocol and conducted the literature search. JY, MT, SJ and VSM assessed the eligibility of studies for inclusion in the analysis. JY and VSM had access to, and verified, the underlying data from all original research articles. Statistical analyses and evidence grading were done by JY with guidance from TK and checked by VSM. JY and BB wrote the first draft of the manuscript. SV, VR, AP, SB, QS, WW, FBH, DJAJ and VSM interpreted the data and critically reviewed the manuscript for important intellectual content. VSM had final responsibility to submit the manuscript for publication and is the guarantor.
Funding This study received no external funding. VSM is supported by the Canada Research Chair programme. We thank authors who provided additional data for meta-analysis.
Competing interests DJAJ has received research grants from Loblaw Companies, the Almond Board of California, Soy Nutrition Institute (SNI) and the Canadian Institutes of Health Research (CIHR). He has received in-kind supplies for trials as a research support from the Almond board of California, Walnut Council of California, the Peanut Institute, Barilla, Unilever, Unico, Primo, Loblaw Companies, Quaker (Pepsico), Pristine Gourmet, Bunge Limited, Kellogg Canada, WhiteWave Foods. He has been on the speaker's panel, served on the scientific advisory board and/or received travel support and/or honoraria from Nutritional Fundamentals for Health (NFH)-Nutramedica, Saint Barnabas Medical Center, The University of Chicago, 2020 China Glycaemic Index (GI) International Conference, Atlantic Pain Conference, Academy of Life Long Learning, Loblaw Companies, Diet Quality Photo Navigation (DQPN), Better Therapeutics (FareWell), Verywell, True Health Initiative (THI), Heali AI Corp, Institute of Food Technologists (IFT), Soy Nutrition Institute (SNI), Herbalife Nutrition Institute (HNI), Herbalife International, Pacific Health Laboratories, Nutritional Fundamentals for Health (NFH), the Soy Foods Association of North America, the Nutrition Foundation of Italy (NFI), the Toronto Knowledge Translation Group (St. Michael's Hospital), the Canadian College of Naturopathic Medicine, The Hospital for Sick Children, the Canadian Nutrition Society (CNS) and the American Society of Nutrition (ASN). He is a member of the International Carbohydrate Quality Consortium (ICQC). His wife, Alexandra L Jenkins, is a director and partner of INQUIS Clinical Research for the Food Industry, his two daughters, Wendy Jenkins and Amy Jenkins, have published a vegetarian book that promotes the use of the low glycaemic index plant foods advocated here, The Portfolio Diet for Cardiovascular Risk Reduction (Academic Press/Elsevier 2020 ISBN:978-0-12-810510-8) and his sister, Caroline Brydson, received funding through a grant from the St. Michael's Hospital Foundation to develop a cookbook for one of his studies. He is also vegan. VSM and SV are involved in the production and distribution of brown rice. VSM has developed a healthier variety of white rice and is involved in studies on glycaemic index of various rice varieties. TK has received research support from the International Life Science Institute (ILSI), and the National Honey Board. VSM is a consultant for the Nutrition Guidance Expert Advisory Group for the WHO. SB is a scientific consultant for Layer IV for work that is unrelated to this manuscript. There are no other financial or personal conflicts of interest to disclose that are related to the contents of this manuscript. The funding sources had no role in study design; in the collection, analysis and interpretation of data; in the writing of the report or in the decision to submit the article for publication. The authors are not affiliated with the funding institutions.
Patient and public involvement Patients and/or the public were not involved in the design, or conduct, or reporting or dissemination plans of this research.
Provenance and peer review Not commissioned; externally peer reviewed.
Supplemental material This content has been supplied by the author(s). It has not been vetted by BMJ Publishing Group Limited (BMJ) and may not have been peer-reviewed. Any opinions or recommendations discussed are solely those of the author(s) and are not endorsed by BMJ. BMJ disclaims all liability and responsibility arising from any reliance placed on the content. Where the content includes any translated material, BMJ does not warrant the accuracy and reliability of the translations (including but not limited to local regulations, clinical guidelines, terminology, drug names and drug dosages), and is not responsible for any error and/or omissions arising from translation and adaptation or otherwise.