Article Text

Abstract
Objective To describe the chronological genomic evolution of SARS-CoV-2 and its impact on public health in the Middle East and North Africa (MENA) region.
Methods This study analysed all available SARS-CoV-2 genomic sequences, metadata and rates of COVID-19 infection from the MENA region retrieved from the Global Initiative on Sharing All Influenza Data database from January 2020 to August 2021. Inferential and descriptive statistics were conducted to describe the epidemiology of SARS-CoV-2.
Results Genomic surveillance of SARS-CoV-2 in the MENA region indicated that the variants in January 2020 predominately belonged to the G, GR, GH or O clades and that the most common variant of concern was Alpha. By August 2021, however, the GK clade dominated (57.4% of all sequenced genomes), followed by the G clade (18.7%) and the GR clade (11.6%). In August, the most commonly sequenced variants of concern were Delta in the Middle East region (91%); Alpha (44.3%) followed by Delta (29.7%) and Beta (25.3%) in the North Africa region; and Alpha (88.9%), followed by Delta (10%) in the fragile and conflict-affected regions of MENA. The mean proportion of the variants of concern among the total sequenced samples differed significantly by country (F=1.93, P=0.0112) but not by major MENA region (F=0.14, P=0.27) or by vaccination coverage (F=1.84, P=0.176).
Conclusion This analysis of the genomic surveillance of SARS-CoV-2 provides an essential description the virus evolution and its impact on public health safety in the MENA region. As of August 2021, the Delta variant showed a genomic advantage in the MENA region. The MENA region includes several fragile and conflict-affected countries with extremely low levels of vaccination coverage and little genomic surveillance, which may soon exacerbate the existing health crisis within those countries and globally.
- COVID-19
- health economics
- health policy
Data availability statement
Data are available on reasonable request.
This is an open access article distributed in accordance with the Creative Commons Attribution Non Commercial (CC BY-NC 4.0) license, which permits others to distribute, remix, adapt, build upon this work non-commercially, and license their derivative works on different terms, provided the original work is properly cited, appropriate credit is given, any changes made indicated, and the use is non-commercial. See: http://creativecommons.org/licenses/by-nc/4.0/.
Statistics from Altmetric.com
Strengths and limitations of this study
The study included 69 571 metadata sequences collected from many countries in the Middle East and North Africa (MENA) region.
To our knowledge, this study is the first to assess conflict-affected regions, providing a rare look into how the pandemic progressed in such regions relative to non-conflict-affected regions.
The study analysed the SARS-CoV-2 genome along with vaccination data, public health restrictions and economic burnout in the MENA region.
Some low-income or conflict-affected countries reported no or low numbers of samples; therefore, their genomic analysis is under-represented in this study, which may bias the results.
Introduction
The most catastrophic pandemic of the modern world in terms of numbers of lives lost and health system, economic and social challenges began late in 2019.1 Since then, approximately 249 million people have been infected with SARS-CoV-2, and more than 5 million deaths caused by the resulting COVID-19 have been reported worldwide.2 As of 31 August 2021, the Middle East and North Africa (MENA) region reported 19 million infections and approximately 289 000 deaths.3 The economic, political and ideological diversity of the MENA region have led to differences in the ability of the countries to respond to the pandemic and in the preparedness of each country’s healthcare system.4 5 The Gulf countries demonstrated strict management strategies, implementing social distancing, increasing the health system capacity and expanding COVID-19 infection testing and vaccination.6 Other countries considered fragile or conflict-affected, including Yemen, Syria, Lebanon, Iraq, Palestine, Libya and Somalia, have experienced widespread outbreaks, high incidence and high mortality rates while reporting low numbers of detected cases owing to a lack of reliable information and underprepared healthcare systems and health management.7–9 The diversity in implementing restrictions, such as full or partial lockdowns, travel suspension, and school and workplace closure, in the MENA region is reflected by the total numbers of infections in each country.4
The ability of the SARS-CoV-2 virus to continually evolve at the genomic level may enable increased transmissibility, escape from diagnostic assay detection or immunity, and decreased susceptibility to therapeutics.10 Thus, genomic surveillance plays a key role in public health epidemiology, surveillance and outbreak control.11 Public health officials have shown great interest in routine genetic sequencing to track both the emergence and impact of the SARS-CoV-2 variants.12 The WHO has taken the lead during the pandemic on monitoring and assessing the virus variants and has categorised them according to their anticipated global impact as variants of concern (VOCs) or variants of interest (VOIs).13 By July 2021, WHO had designated four VOCs, Alpha, Beta, Gamma, and Delta, and seven VOIs, and the continued emergence of new variants was expected.10 These VOCs showed increased transmissibility and increased virulence or caused a change in clinical presentation, or there has been a decrease in the effectiveness of public health measures, such as vaccination, pharmaceutical treatment or social distancing.14 The countries in the MENA region are conducting genomic surveillance as a means of contributing to the global effort to control the pandemic and to inform decisions about when to take steps toward lifting pandemic-directed restrictions.
This analysis summarises the genomic surveillance of SARS-CoV-2 in the MENA region from January 2020 to August 2021, assessing the association of the evolution and circulation of the virus with public health actions and safety.
Methods
Data collection strategy
The reporting of this study follows the Strengthening the Reporting of Observational Studies in Epidemiology reporting guideline. A standard search was conducted of the Global Initiative on Sharing All Influenza Data (GISAID) database to retrieve all available sequences from the MENA region.15 The metadata were accessed between May and August 2021, with August 31 as the cut-off date for submission. The metadata extracted from the portal included the sample collection date, defined clade and VOCs or VOIs detected. Clades were assigned using the GISAID nomenclature, which categorises clades as L, S, V, G, GK, GH, GV, GRY and O (for unclassified genome).16 The VOCs were classified using the WHO assignment of Alpha (B.1.1.7), Beta (B.1.351), Gamma (P.1), and Delta (B.1.617.2), and the VOIs were classified as Epsilon, Zeta, Eta, Theta, Iota, Kappa and Lambda.17 In the search box, a country and a month timeframe were selected, and the results were collected as an entry in the primary dataset. Metadata for 69 571 genomic sequences were retrieved from the GISAID database.
Inclusion and exclusion criteria
The search criteria for the countries in the MENA regions encompassed Algeria, Bahrain, Djibouti, Egypt, Iran, Iraq, Jordan, Kuwait, Lebanon, Libya, Morocco, Oman, Palestine, Qatar, Saudi Arabia, Sudan, South Sudan, Somalia, Syria, Tunisia, UAE, Turkey and Yemen. Genomic data were excluded from the analysis if the collection date was not completed, or the data quality was insufficient to define the clade or VOC/VOI. The main sampling bias in our study was the distribution of sequences retrieved from different countries. Countries with no sequences available in the GISAID portal, namely, Yemen and Sudan, were excluded. The exclusion criteria also included viruses isolated from organisms other than humans. The final sample size for analysis after application of the exclusion criteria was 67 393. The total numbers of sequences per country were as follows: Algeria, 46; Bahrain, 710; Djibouti, 139; Egypt, 928; Iran, 479; Iraq, 245; Jordan, 688; Kuwait, 200; Lebanon, 1019; Libya, 22; Morocco, 35; Oman, 461; Palestine, 150; Qatar, 2910; Saudi Arabia, 1096; South Sudan, 87; Somalia, 24; Tunisia, 132; UAE, 1849 and Turkey, 56 173.
Collection of disease epidemiology, vaccination, testing capacity and lockdown data
Disease epidemiologic data, including the total number of confirmed COVID-19 infection cases and the total number of deaths, were obtained from the Johns Hopkins University coronavirus dashboard (https://github.com/CSSEGISandData/COVID-19) accessed on 31 August 2021.18 Lockdown data for the MENA region countries were primarily collected from two meta-analyses, with data from Turkey and Djibouti obtained from the Overseas Security Advisory Council and US Embassy websites.19–22 For vaccination data, we collected the information from the live COVID-19 vaccination portal and modelled with the COVID-19 Vax model.23 24 The lockdown metadata for the MENA region countries are shown in online supplemental appendix S1. The daily COVID-19 test results per thousand people were collected from the ‘Our World in Data’ website.25 The MENA countries were divided into three main groups: (1) fragile or undergoing conflict, which included Syria, Lebanon, Yemen, Iraq, Palestine, Libya and Somalia; (2) the North African region, which included all MENA countries located in Africa (Algeria, Tunisia, Morocco, Egypt, Sudan, South Sudan and Djibouti) and (3) the Middle East region, which included Saudi Arabia, Qatar, UAE, Oman, Bahrain, Iran, Iraq, Jordan, Kuwait and Turkey.
Supplemental material
Statistical analysis
All data collected were stored and analysed using SAS (V.9.4) software and GraphPad Prisma (V.9.0). Inferential and descriptive statistics were conducted to assess epidemiologic characteristics of SARS-CoV-2 in the MENA region. The χ2 test was used for categorical variables when appropriate. Univariable and multivariate analyses were conducted to identify factors associated with the mean of the proportion of the VOCs that composed the total genomes sequenced. All reported p values are two tailed and were considered to be statistically significant at p<0.05.
Viral phylodynamic and phylogeographical analyses
Only regions with high-vaccination coverage and complete sequences were selected for these analyses. From each country, we used the earliest samples of good quality, with a maximum number of 20 samples per country. The sample metadata and acknowledgments are included in online supplemental appendix S2. The total number of samples retrieved was 331; however, after alignment, only 257 samples were included in the phylodynamic analysis. For the phylodynamic analysis, we used a Bayesian Evolutionary Analysis Sampling Tree (BEAST V.2.6.6).26 The analysis was conducted with activated tip dates, the Jukes and Cantor 1969 model (JC69) and a strict clock model. The phylogenetic tree was visualised using the interactive Tree of Life online tool.27 For the phylogeographical analysis, we used Nextstrain V.3.2.2 and the Augur pipeline.28
Supplemental material
Results
Distribution of SARS-CoV-2 clades and VOCs in the MENA region by date
Figure 1 shows the distribution of reported COVID-19 infections in the Gulf area of the MENA region, namely, Bahrain, Oman, Kuwait, Saudi Arabia, Qatar and the UAE. In Bahrain, the first cases of COVID-19 infection were detected in February 2020, and the first sequenced cases belonged to the GR and O clades. In October 2020, the cases were primarily infections by variants belonging to the GR clade. The first appearance of a VOI or VOC was in March 2021, and it was the Alpha (B.1.1.7) variant. The predominance of this variant was replaced in April by the Delta (B.1.617.2) variant. The highest numbers of recorded COVID-19 cases and deaths were reported in May 2021, with the Delta variant being the predominant VOI. In Oman, the first cases were detected in March 2020. The most common clade in 2020 was the GR clade, but in 2021, the G clade was most common. The first appearance of a VOI or VOC was in January 2021, again it was the Alpha variant. The highest numbers of COVID-19 infections and deaths were reported in June 2021. During that time, the most common clade was G, and no VOIs or VOCs were detected. The first cases reported in Kuwait were in March 2020, and the first sequenced variants were from the O clade. The first appearance of a VOI or VOC was in January 2021, and once again, it was the Alpha variant. However, from April through November 2021, the main VOC or VOI was Delta. The highest numbers of COVID-19 cases and deaths were reported in June 2021, and the most common VOI was Delta. In Saudi Arabia, the first cases were detected in February 2020, and they belonged to the GH clade. The first appearances of VOIs or VOCs were in April 2021, and they were the Alpha and (B.1.351) Beta variants. The highest numbers of cases and deaths were reported in June 2020, and the dominant clades were O and GR. In Qatar, the first cases were reported in February 2020, and the first sequenced variants belonged to the O, GR and V clades. From May 2020 to December, the variants belonged primarily to the G clade. The first appearances of VOIs VOCs were detected in December 2020, and they were the Alpha and Beta variants. The highest numbers of deaths were reported in April 2021, and the dominant VOI was Beta. The first COVID-19 cases detected in the UAE were in February 2020. The most common clade was the GR clade. The first appearance of a VOI or VOC was in November 2020, which is the earliest in the MENA region, and this earliest detected variant was Alpha. The highest numbers of COVID-19-related deaths and infections were reported in April 2021, and the dominant VOI was Beta. Most of the lockdowns among the Gulf area countries started between May and June 2020. However, Oman and Kuwait also conducted lockdowns in 2021, attempting to slow increases in the number of infections.

Timeline for the distribution for the detected clades, variants of interest (VOIs) and numbers of COVID-19 infections and related deaths from the first detected SARS-CoV-2 infection until August 2021 in the Gulf area by country. The left y-axis depicts the numbers of clades (represented in the plot by bars), monthly deaths (represented by the red line), and infections by variants of concern (VOC; represented by the blue line). The right y-axis depicts the numbers of infections each month (yellow line). Light-red shaded vertical rectangles represent the reported lockdown periods.
Figure 2 illustrates the distribution of reported COVID-19 infections in the remaining Middle East countries, namely, Iraq, Lebanon, Palestine, Jordan, Turkey and Iran. In Iraq, COVID-19 infection cases were first detected in February 2020, and the first sequenced variants belonged to the O and GH clades. The first VOC appeared a year later, in February 2021, and the dominant variant was Alpha. The number of infections and deaths continued to rise at that time, with the Alpha variant dominating, and the variants belonged to the GR clade. In Lebanon, the first cases were detected in February 2020, and the clade most common until April 2021 was GR. The VOIs or VOCs first appeared in January 2021, and the earliest variant was Alpha. The peak numbers of deaths was in March 2021, and most people were infected with either the Alpha or Delta variants. In Palestine, the first COVID-19 cases were seen in March 2020. The dominant clade for the sequenced variants in 2020 was GR. The first appearance of the VOIs or VOCs was reported in February 2021, and the earliest variant was Alpha. Peak numbers of infections and deaths were in March 2021, and the dominant variant was Alpha. In Jordan, the first cases were detected in March 2020, and the most common clade for the sequenced variants was GR. VOIs or VOCs appeared in December 2020, and the earliest variant was Alpha. The peak numbers of infections and deaths were reported in March 2021, and Alpha was the dominant variant. In Turkey, the first infections were detected in March 2020. The first sequenced cases belonged to the GR clade although both the GR and GH clades dominated in 2020. The first appearance of VOIs or VOCs was reported in December 2020. The earliest variant was Alpha and it was the common VOI or VOCs from December 2020 to May 2021, when it was replaced by the Delta variant. Peak numbers of infections and deaths were reported in April 2021, and the dominant variant was Alpha. In Iran, the first infections were detected in February 2020. The most common clade of the variants sequenced in 2020 was O. The first appearance of a VOI or VOC was detected in January 2021, and the earliest reported variant was Alpha. The peak numbers of infections and deaths were reported in April 2021, and the dominant variant was Delta. Most lockdowns for these countries started between May and June 2020, except for Jordan, which started a lockdown in 2020.
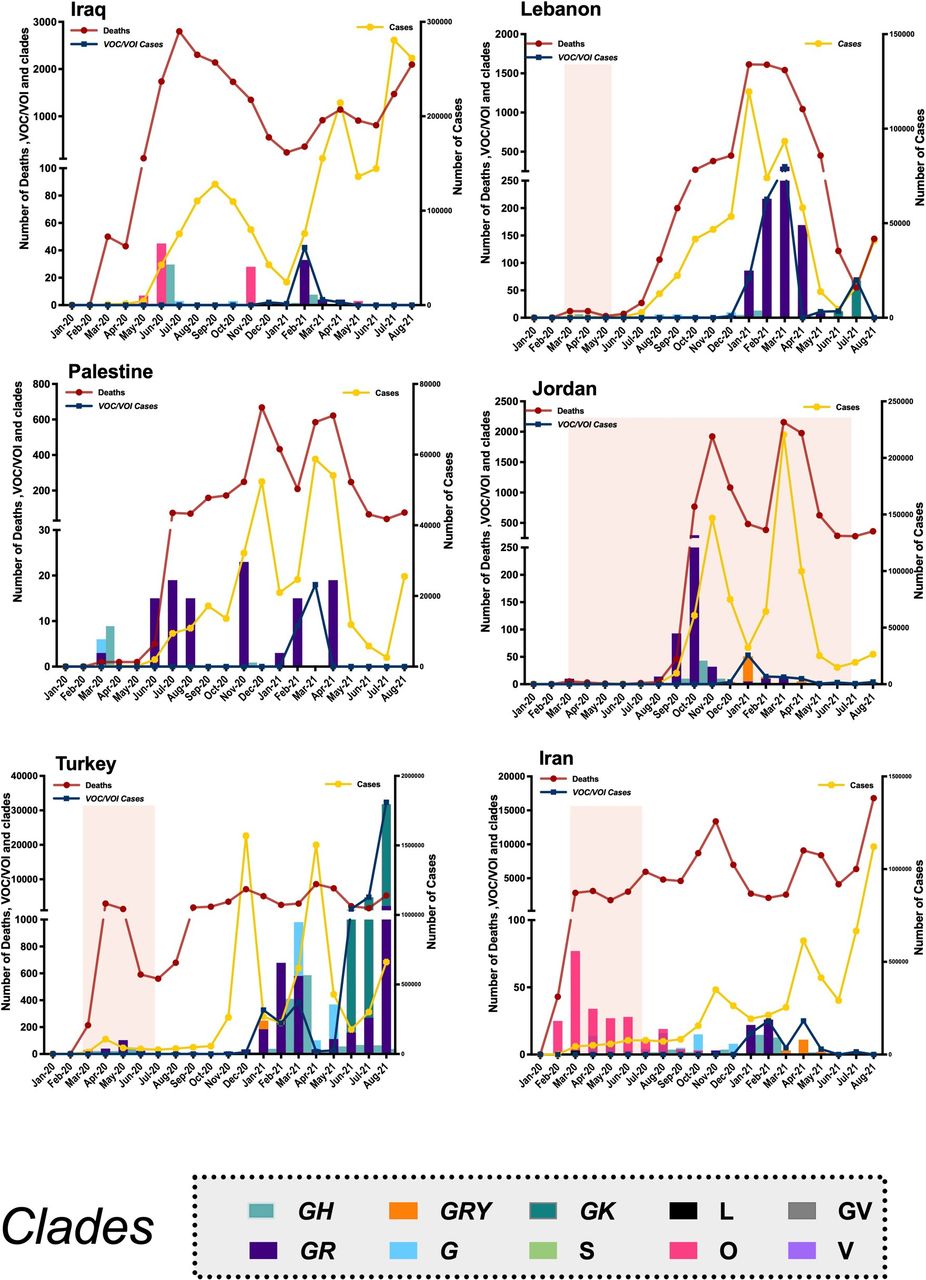
Timeline for the distribution for the detected clades, variants of interest (VOIs) and numbers of COVID-19 infections and related deaths from the first detected SARS-CoV-2 infection until August 2021 in the Levant area, Turkey and Iran. The left y-axis depicts the numbers of clades (represented in the plot by bars), monthly deaths (represented by the red line), and infections by variants of concern (VOCs; represented by the blue line). The right y-axis depicts the numbers of infections each month (yellow line). Light-red shaded vertical rectangles represent the reported lockdown periods.
Figure 3 shows the distribution of SARS-CoV-2 in the African Countries of the MENA region: Egypt, Algeria, Libya, Djibouti, Tunisia, Morocco, South Sudan and Somalia. For most of these countries, fewer than 100 sequences a month were determined. In Egypt, the first COVID-19 infections were reported in March 2020, and the first sequenced cases belonged to the G clade, with most sequences in 2020 belonging to the GR and GH clades. VOIs and VOCS were not reported in Egypt. The highest numbers of infections and deaths were observed in June 2021, when the dominant clade was GH. In Algeria, the first infections were detected in March 2020, and they belonged to the GH clade. The first appearance of a VOI or VOC was in January 2020, and the earliest variant observed was Delta. Peak numbers of deaths were reported in June 2021, when Delta remained the dominant VOI. In Morocco, the first cases were detected in February 2020, whereas genomic surveillance was first used in July 2020. Many of the sequenced variants belonged to the G and O clades. VOIs or VOCs were not detected in Morocco. In Tunisia, the first infections were detected in March 2020, with many of the sequenced variants belonging to the GH and O clades. VOIs and VOCs first appeared in February 2021, and the earliest was the Alpha variant. Most variants detected among infected persons and persons who died in Tunisia belonged to the GH clade. The most common VOIs or VOCs were Alpha and Beta. In Libya, the first infections were detected in July 2020 and the first sequenced variants belonged to the S clade. The first appearance of the VOIs or VOCs was in February 2020, and the earliest detected was the Alpha variant. The peak number of cases and deaths were reported in June 2021, when the dominant VOI or VOC was Alpha. In Djibouti, the first infections were reported in April 2020, with the first sequenced cases belonging to the GR and GH clades. The first appearance of the VOIs or VOCs was in February 2021, and the earliest detected was the Alpha variant. The peak numbers of infections and deaths were reported in April 2021, and the dominant VOIs were Alpha and Delta. In Somalia, the first infections were detected in March 2020, and the first sequenced variants were from the V clade. The first appearance of a VOI or VOC was in February 2021, and the earliest detected variant was Alpha. Peak numbers of infections and deaths were in March 2021, and the dominant VOI was Alpha. In South Sudan, the first infections were detected in May 2020; the variants were first sequenced in August 2020 and belonged to the S clade. VOIs or VOCs first appeared in January 2021, and the earliest was the Beta variant. Peak numbers of infections and deaths were in February and March 2021, and the dominant VOI was Delta. Lockdowns in the African region for many countries occurred during the summer of 2020, including Algeria, which also instituted additional measures owing to increased infections and delays in vaccine uptake.
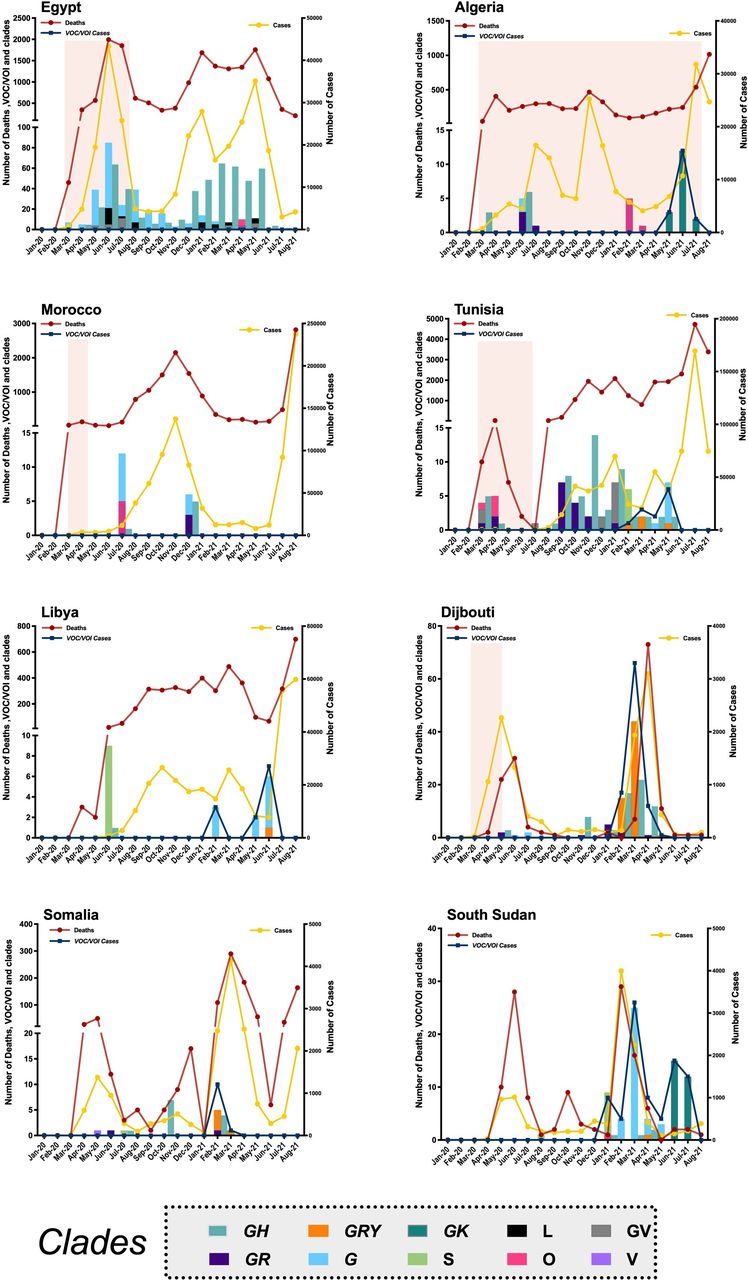
Timeline for the distribution for the detected clades, variants of interest (VOIs) and numbers of COVID-19 infections and related deaths from the first detected SARS-CoV-2 infection until August 2021 in the North Africa area by country. The left y-axis depicts the numbers of clades (represented in the plot by bars), monthly deaths (represented by the red line) and infections by variants of concern (VOCs; represented by the blue line). The right y-axis depicts the numbers of infections each month (yellow line). Light-red shaded vertical rectangles represent the reported lockdown periods.
SARS-CoV-2 genomic surveillance in the MENA region
For the fragile and conflict-affected countries in the MENA region, figure 4A.1, shows the distribution of clades over time, with the mean percentage of the total VOCs among the total sequenced samples. In 2020, the most common clades were GR and GH. The VOCs and VOIs were first detected in December 2020 and continued to rise to be approximately 90% of the total sequenced genomes in March 2021; most of the infections were caused by the Alpha variant. The overall distribution of VOCs by percentage in the region is shown in figure 4A.2. In these countries, Alpha was the most dominant VOC (~88.9%), followed by Delta (~10%). For the Middle East region, figure 4B.1, shows the distribution of clades over time, giving the mean percentage of VOCs among the total sequenced samples). In 2020, the most common clades were GR and GH. Infections by VOCs and VOIs were first reported in November 2020 and continued to rise to peak at approximately 65% of the total sequenced samples in July 2021, with Delta being the most common VOC. The overall distribution of VOCs by percentage in the region is shown in figure 4B.2. In this region, Delta was the dominant VOC (~91%), followed by Alpha (~5.9%). For the North Africa region, figure 4C.1 shows the distribution of clades over time with the mean percentage of the total VOCs among the total sequenced samples. In 2020, the most common clades were G and GH. VOCs and VOIs first appeared in December 2020 and continued to rise to be approximately 65% of the total samples in May 2021, with the Delta and Alpha variants being the most commonly detected. The overall distribution of VOCs by percentage in the region is shown in figure 4C.2. In this region, the most dominant VOC was Delta (~42.5%), followed by Alpha (~36. %) and Beta (~20.7%).

(A.1) Timeline for the distribution of clades with the mean percentage of VOCs detected from the total sequenced samples in fragile and conflicted region. (A.2) Pie chart representing the percentages of VOCs detected in fragile and conflicted region. (B.1) Timeline for the distribution of clades with the mean percentage of VOCs detected from the total sequenced samples in the Middle East region. (B.2) Pie chart representing the percentages of VOCs detected in the Middle East region. (C.1) Timeline for the distribution of clades with the mean percentage of VOCs detected from the total sequenced samples in the North African region. (C.2) Pie chart representing the percentages of VOCs detected in the North African region. VOCs, variants of concern.
The distribution of the VOCS and non-VOCs by date in the major MENA regions is shown in table 1. The association of the presence of VOC (vs non-VOCS) with region was statistically significant (X2=13 874, p<0.0001). The results of the analyses indicated that from November through August, the distribution of cases by VOC status differed for the three major regions. In the Middle East, infections by VOCs were increasing, while their numbers did not increase to the same levels in North Africa and the fragile or conflict-affected countries. We also assessed the effect of vaccination coverage and VOC status by major region (table 1). Countries with high-coverage vaccination programmes in the Middle East reported higher numbers of VOCs, while countries with low vaccination coverage detected higher numbers of non-VOCs. In the North Africa region, most of the infections were by non-VOCs for both vaccination groups. None of the fragile or conflict-affected countries had a vaccination coverage of 40%, but the highest number of infections were reported as being from VOCs. All of the conflicted countries individually showed a higher number of non-VOCs, except for Lebanon, which reported a higher number of VOCs and thus skewed the distribution. The number of samples with VOCs in the conflict-affected region without Lebanon was 89, and the number of samples with non-VOCs in these regions was 330.
Cumulative numbers of infections by date and variant status in the major MENA regions.
Table 2 shows the mean distributions of VOCs and clades by major region. The Middle East region reported the most VOCs overall, and the most frequently reported VOC was Delta (91%). The association between region and VOCs was statistically significant (p<0.0001), with different VOCs reported in each region. For both North Africa and the fragile and conflict-affected countries, the Alpha variant was most common, and a significant association was found between clades and region. Most of the clades were detected in the Middle East, except for the L clade, which was detected primarily in the North Africa region (55.2%). For the Middle East, the most frequently reported clades were GK (59%), G (18.8%) and GR (10.6%). For the North African region, the most common clades were GH (45.6%) and G (27.4%). In the fragile and conflict-affected countries, GR (67.3%), O (8.2%) and G (2.3%) were the most common clades.
Infections by variant of concern and clades and variant of interest in the major MENA regions
Chronological distribution of pooled SARS-CoV-2 clade and VOC data in the MENA region
Data from all countries in the MENA regions were pooled and analysed. The distribution of the pooled clade data is shown in figure 5. Data for first cases were collected in February 2020, and many of these infections belonged to the O clade. In 2020, the GR clade was the most common, followed by the GH clade. In 2021, from January to March, the most common clades were GR, G and GH, and from May 2021 to August, the G and GK clades dominated. The proportion of VOCs for variants sequenced in the MENA region from November 2020 to August 2021 is shown in figure 6. In November 2020, approximately 99% of the infections were not caused by VOCs. In January 2021, the Alpha variant was competing with non-VOCs, each causing 50% of the reported infections. In March, the Delta variant was first detected, and the percentage of sequenced variants that were Delta increased through July, with the percentage in August 2021 being nearly 80%.
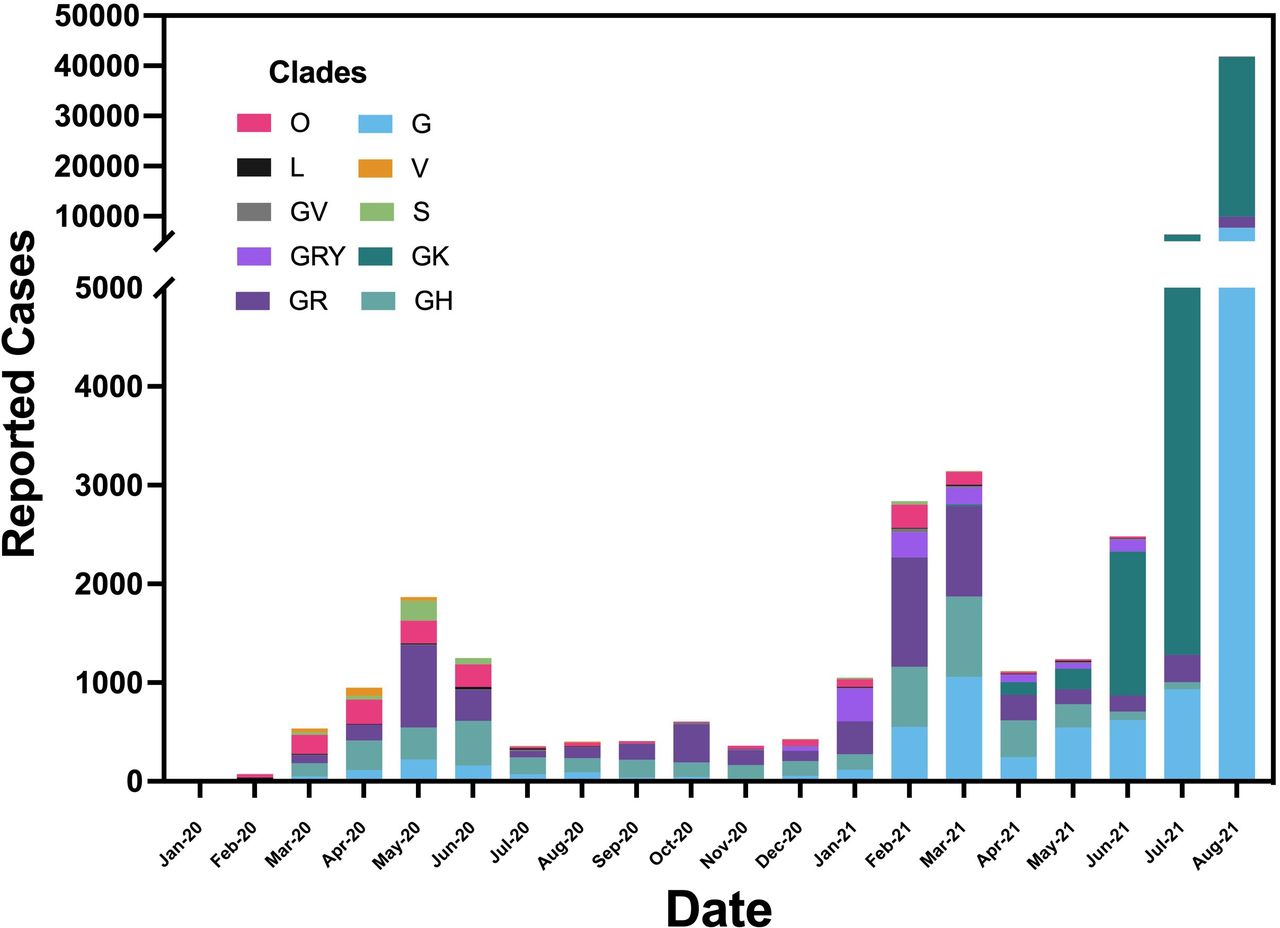
Timeline for the distribution of the pooled clades in the MENA region. Cases were first detected in February 2020. Bar colours represent the number of reported infections belonging to each clade by month. MENA, Middle East and North Africa.

The percentage of VOC status for samples sequenced in the MENA region from November 2020 to August 2021. In November 2020, approximately 99% of infections were caused by variants that were not VOC. However, in August 2021, the percentage of sequenced genomes that were the Delta variant was approximately 80%. MENA, Middle East and North Africa; VOC, variants of concern.
Impacts of vaccination status and VOCs in the MENA region
A summary of the available COVID-19 vaccination information in the MENA region by country is given in table 3. In the Middle East Region, the countries having the highest percentage of the total population with at least one vaccine dose were UAE (84.93%) and Qatar (79.14%), whereas those with the lowest were Iran (21.48%) and Kuwait (33.55%). The only countries in the MENA region that reached a total percentage of the population vaccinated with two doses above 70% by August 2021 were UAE and Qatar. In the North Africa region, the countries having the highest percentage of the total population with at least one vaccine dose were Morocco (49.22%) and Tunisia (35.02%), whereas those with the lowest were South Sudan (0.98%) and Sudan (1.43%). In the fragile and conflict-affected countries, the highest percentage of the total population with at least one vaccine dose were Palestine (26.96%) and Lebanon (19.99%), whereas the lowest were Yemen (0.97%) and Somalia (1.19%).
Vaccination coverage and testing capacity for each country in the MENA region
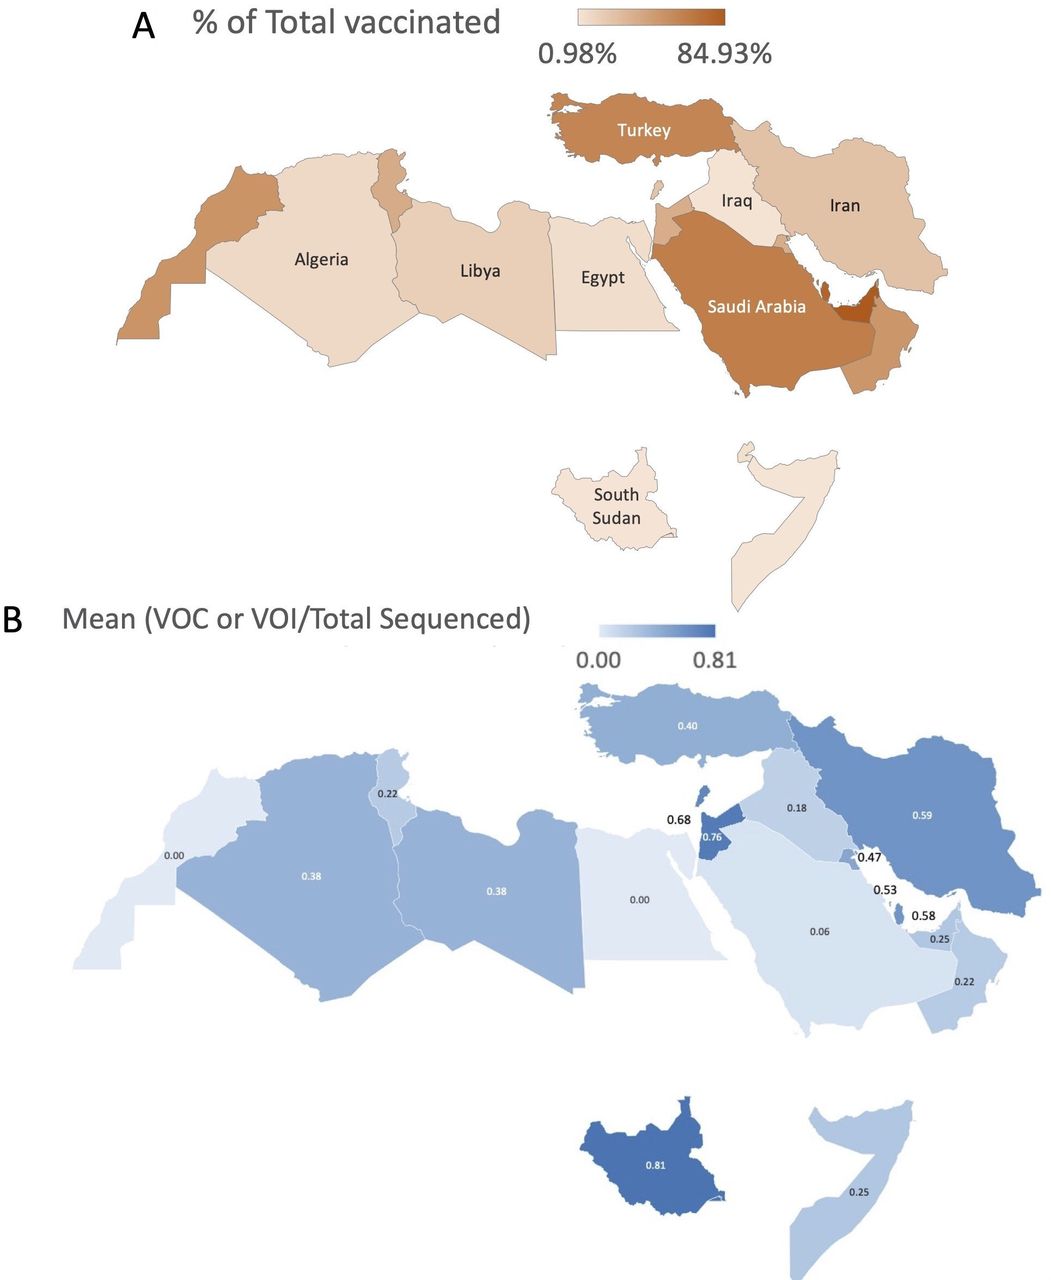
The vaccination coverage and mean percentage of sequenced variants that were VOCs in each country of the MENA region are illustrated in figure 7. Figure 7A shows the distribution of percentage of the total population in each country that received in the MENA region. Overall, the countries with the highest percentages of the total population receiving at least one vaccination were in the Gulf area, Turkey and Morocco, whereas the lowest percentages were in the fragile and conflicted-affected countries. The highest (mean) percentages of all the sequenced samples that were VOCs were in South Sudan (81%), Jordan (76%), Lebanon (68%), Bahrain (53%) and Qatar (58%), whereas the lowest were in Morocco (0%), Egypt (0%) and Saudi Arabia (6%). The percentages of the total sequenced genomes that were VOCs were significantly different by country (F=1.93, p=0.0112, R=0.088) but not by major MENA region (F=0.14, p=0.27, R=0.006) nor by vaccination coverage (F=1.84, p=0.176, R=0.005). The testing capacity per thousand cases in The MENA region indicated that the top countries were UAE (29.9), followed by Qatar (6.3) and Bahrain (3.2), and the lowest countries were Egypt (0.13) and Morocco (0.18). Furthermore, many countries, including Oman, Algeria, Sudan, South Sudan, Lebanon, Palestine, Yemen, Somalia and Libya, had no data available.

Maps of the MENA region showing (A) the percentage of the total population in each country that received ≥1 COVID-19 vaccination. In the Middle East region, higher percentages of vaccinated people were found in the Gulf area and Turkey; and (B) Percentages of the total sequenced genomes in each country that that were attributed to variants of concern (VOC) or variants of interest (VOI). MENA, Middle East and North Africa.
Phylodynamic and phylogeographical analyses of SARS-CoV-2 in the MENA region
Figure 8A shows the phylodynamic tree of SARS-CoV-2 based on a Bayesian model with respect to time. The analysis includes two main branches. The colour-coded subbranches were constructed to make interpretation clearer and to distinguish the subgroups.

Summary of the phylodynamic and phylogeographical analysis of SARs-CoV-2 in the MENA region. (A) Phylogenetic tree showing SARs-CoV-2 in the MENA region. The phylogenetic analysis used 251 sequences from the GISAID portal. Colour codes distinguish various subbranches of coronaviruses in the region. The phylogenetic tree was constructed using BEAST and the gamma model, with ITOL tool for visualisation. (B) Distribution of SARs-CoV-2 in the MENA region by transmission. The analysis shows ancestral SARs-CoV-2 strains first imported to Iran and then to the Gulf countries and North Africa countries and lastly to the Levant region. An animation can be viewed at https://nextstrain.org/community/obeiddx/MENA/ncov. GISAID, Global Initiative on Sharing All Influenza Data; ITOL, interactive tree of life; MENA, Middle East and North Africa.
The first group (light-greenish blue) mainly included samples from Saudi Arabia, Morocco and the Levant countries. The second group (light-purple) included samples from the Gulf countries Turkey and Iraq. The third group (light-brown) included samples only from Lebanon. The fourth group (pink) included samples from Gulf countries (primarily Saudi Arabia and Qatar), North Africa countries and Palestine. The fifth branch (light-blue), which was the largest group, included most of the Iraqi samples in the upper subgroup and a mixed sample from the North Africa countries Egypt and Morocco, Levant countries, Iran and the Gulf countries of Qatar, UAE, Saudi Arabia and Oman in the second subgroup. A Somalin sample was located in the same branch.
For the lower main branch, the first group (yellow) shared an ancestral strain from Saudi Arabia and then branched to primarily Lebanon but included other countries (Kuwait, Algeria, Tunisia and Oman). The second group (light-red) was divided into two main subgroups. The first subgroup included mainly the Levant region, North Africa and UAE. The second subgroup included Levant countries, Gulf countries and Egypt. Two samples from Djibouti were also in that subgroup. The third group (light-orange) branched from a Moroccan sample to Djibouti, Iraq, Egypt, Somalia, Iran, Qatar and Tunisia. The fourth main branch (light-green) included many conserved branches. One of the conserved groups primarily included samples from Djibouti, with another branch showing samples only from Iraq and the rest of the branches having samples mainly from the Gulf and Levant countries. Overall, only a few countries showed highly conserved subgroups, such as Djibouti, Lebanon and Iraq. Other countries, specifically Saudi Arabia, Qatar, UAE and Morocco, were distributed across many branches.
Figure 8B shows the phylogeographical analysis of SARS-CoV-2 using the Nextstrain pipeline. The map gives the distribution of clades with transmission lines. The results indicated that the first cases from the ancestral strains were brought from China to Iran, and then there were many lines from Iran to the rest of the Gulf countries and Turkey. Morocco, Saudi Arabia, Qatar and Lebanon harboured early strains associated with travellers, but none directly from China. Many of Moroccan samples were connected to UAE samples. An animation of the transmission analysis can be viewed on a Nextstrain webpage at https://nextstrain.org/community/obeiddx/MENA/ncov.
Discussion
This study described the genomic distribution of SARS-CoV-2 and COVID-19 epidemiology in the MENA region from January 2020 to August 2021. Our key findings indicated that all countries in the Gulf Cooperation Council, the first SARS-CoV-2 infections were variants belonging to the GR or O clade, except Saudi Arabia, in which the first detected variants belonged to the GH clade. In the remaining Middle East countries, the first variants also belong predominantly to the GR clade, except for Iraq and Iran, in which the variants belonged to the O clade. Overall, the number of sequenced samples in the MENA region was lowest in the African countries. The distribution of clades in the African region differed by country: the G clade first appeared in Egypt and Morocco, while the GH clade was detected in Algeria and Tunisia, and the S clade was detected in Libya and South Sudan. Other African countries showed distinctive first clades compared with other MENA region countries, such as the GR clade in Djibouti and the V clade in Somalia. Analysis of the Middle East region alone showed that the SAR-CoV-2 variants predominately belonged to the GR and GH clades. Although Alpha was the first VOC detected in the region, by August 2021, the most common VOC was Delta, comprising nearly ~91% of all VOC samples. In the North African region, the first cases of SARS-CoV-2 belonged to the G and GH clades. Not only was Alpha the first variant detected, it was also most predominant VOC (~44.3%), followed by Delta (~29.7 %), and Beta (~25.3%). In the fragile and conflict-affected regions, the most common clades were GR and GH, and similar to the rest of the MENA region, Alpha was the first VOC and also the predominant variant (~88.9%), followed by Delta (~10%).
In another study analysing the chronologic development of SARS-CoV-2 variants worldwide, samples that were sequenced up to January 2021 showed that the most common clades globally were GR (34%), followed by GV (22.3%), and GH (21.4%).29 We found that as of August 2021, most variants belonged to the GK clade (57.4% of the total samples), followed by the G (18.7%), GR (11.6%), and GH (6.8%) clades. The GV clade was not common in the MENA region, with only 160 cases overall. The first variants detected in the MENA region belonged to the GH and S clades and were detected among European travellers to Qatar and UAE in January 2020.
Our analyses of vaccination coverage and VOC vs non-VOC status by MENA region indicated that countries with high-coverage vaccination programmes had more cases with VOCs, whereas countries with low coverage had higher numbers of non-VOC cases. These findings suggest that the Delta variant may have adapted and transmitted more successfully than the other virus lineages in population with high vaccination coverage. The distribution in the MENA regions of VOCs versus non-VOC by date was significantly different (χ2=13 874, p<0.0001). Additionally, in the Middle East, infections attributable to VOCs were increasing, while the numbers were not as high in North Africa and in the fragile and conflict-affected countries (except for Lebanon). An analysis of each country, however, shows a different pattern for the association of vaccination coverage with the emergence of infections attributable to VOCs. Higher vaccination coverage in some countries, such as Saudi Arabia and the UAE, was not associated with more cases attributable to VOCs, and lower vaccination coverage in other countries, such as South Sudan and Jordan, had more infections by VOCs. These statistically significant associations were found only for countries, not for overall regions.
The evolution of SARS-CoV-2 can be viewed as being driven by three factors: virulence, transmissibility and immune evasion. The success of the current VOCs appears to be a trade-off between increasing transmissibility and immunogenic adaptation of the host.30 Many international studies have shown Delta was the dominating SAR-CoV-2 variant in 2020. France reported in June 2020 an estimated transmission advantage of 66% for Delta over Alpha. The Delta variant also showed a greater transmission advantage than the other VOCs, while Alpha had the least advantage.31 Similarly in the UK, the Alpha variant was originally found in approximately 80% of all samples but by August 2020, Delta was detected in 96% of the samples. A similar domination of the Delta variant has been reported worldwide.32 33
The fitness of the Delta variant can be shown by its estimated reproduction number of R0=5.08 compared with an R0=2.8 for the ancestral strain.34 This superior capability of the Delta variant over all the other variants that have emerged to date is linked to the P681R mutation, which enhance virus replication by increased full-length spike cleavage that leads to increased infection via cell surface entry.35 As of 2 April 2022, the Delta variant was overtaken by yet another variant: Omicron. The Omicron variant B.1.1.529 was first detected in South Africa November 2021.36 The first Omicron variant subtype was B.A.1; in March 2022, the dominating subtype circulating throughout the world was B.A.2.37 This continuous evolution of the virus is especially a threat to countries with low income and low vaccination rates.
Countries in the MENA region with low vaccination rates and many cases of infection with the Delta variant are at high risk of increasing hospital admissions and emergency attendance.38 The dominance of the Delta variant is also a concerned due to its association with vaccine breakthrough cases reported in Washington state in the US, with almost 85% of the vaccine breakthrough cases being positive for Delta.33 In Saudi Arabia, most (71%) breakthrough cases involved VOCs, and breakthrough infections were also common among patients who received one dose of the Oxford-AstraZeneca vaccination.39
From a bioinformatics perspective, one study found that SARS-CoV-2 infections in the Middle East region originated in Iran.40 At the beginning of the pandemic, Qom city, Iran, hosted a religious event conducted as a pilgrimage, and infection was spread to the Middle East before travel suspension was instituted.41 Another bioinformatics study analysing the MENA region has shown Dubai, UAE, to be a travel hub for SARS-CoV-2, with numerous infections introduced from both Iran and Europe.42 In Africa, there were more than 211 separate presentations of the virus, of which 43% were from Europe.43 Our phylogeographical analysis also indicated that Iran was the first country in which the ancestral strain from China was detected. Then UAE, Saudi Arabia, Morocco, Qatar and Lebanon served as hot spots spreading active infections across many countries in the MENA region. Our phylodynamic analysis showed that some of the samples from Lebanon, Djibouti and Iraq were conserved independently from other countries.
Genomic surveillance has and will continue to play a vital role in enhancing the response of public health affairs during the pandemic. Examples of countries with excellent genomic surveillance are Palestine, Libya and Lebanon. In Syria, Yemen and Sudan, no genomic sequences were collected, whereas Iraq and Somalia used international collaboration to conduct genomic surveillance. However, many countries are currently facing vaccination coverage challenges, especially in the MENA region, and in the fragile and conflict-affected countries, more humanitarian assistance is required.
Public health officers in African regions hit hard by the Ebola endemic in the last decade learnt the importance of international collaboration. Unfortunately, extensive collaborations of COVID-19 network laboratories do not include any North Africa countries, indicating a weak link in SARS-CoV-2 surveillance in low-income countries in Africa.44 Furthermore, a major challenge that plays a significant role in public health decisions in the MENA region is data sharing and its direct impact on economic growth. Although some high-income countries, such as the Gulf Cooperation Council countries, can generate high-coverage surveillance of the virus, many countries choose not to share these data with the global community or even with other countries in the MENA region, claiming sensitive internal affairs issues.45 By contrast, Qatar has a robust genomic surveillance programme and has shared their findings each month during the pandemic.
Our study has some limitations. The genomic sequences assessed in this study were collected from the GISAID database; however, because the samples were processed using different sequencing platforms and methods, any effects across the analysis were likely negligible. The data were diverse across the months, with some countries reporting low numbers of samples sequenced. Host data were not integrated into our analysis owing to samples uploaded to GISAID with no metadata. No data were available from some fragile and conflict-affected countries, including Yemen and Syria. Moreover, the genomic data were also limited by testing capacity and the availability of sequencing resources, which remain a major challenge in some low-income countries.
In conclusion, this study contributes to the knowledge on the evolution and circulation patterns of SARS-CoV-2 in the MENA region. The MENA region is one of the most highly populated areas in the world. Overall, our findings suggest multiple international introductions of SARS-CoV-2 variants from European travellers to Qatar and UAE and ancestral strains from Iran. By the summer of 2021, the genomic advantage for the Delta variant enabled it to dominate the other variants in the MENA region, as well as globally. Because the MENA area includes many fragile and conflict-affected countries, genomic surveillance is not prioritised in already strained health systems with low levels of testing and low numbers of vaccinations. This health crisis along with economic and political burnout in fragile countries could lead to catastrophic consequences in terms of human lives and rights if no actions are taken by world leaders.
Data availability statement
Data are available on reasonable request.
Ethics statements
Patient consent for publication
Ethics approval
This study was approved by the ethics committee which waived the need for obtaining informed patient consent because all data are publicly available.
Acknowledgments
The authors acknowledge with thanks the support of Aroob Alhumaidy for her bioinformatic resources support.
References
Supplementary materials
Supplementary Data
This web only file has been produced by the BMJ Publishing Group from an electronic file supplied by the author(s) and has not been edited for content.
Footnotes
Twitter @obeiddx92
Contributors DO, RA and FaA: Conceptualisation, MAl, BA, FeA and MAb: helped in methodology. All authors were involved in manuscript writing and methodology, analysis was done by DO. FaA and AAA-Q edited the final manuscript. All authors read and approved the contents of the manuscript.
Funding This work was fully funded by a King Faisal Specialist Hospital and Research Centre COVID-19 grant (RAC #2200009).
Map disclaimer The inclusion of any map (including the depiction of any boundaries therein), or of any geographic or locational reference, does not imply the expression of any opinion whatsoever on the part of BMJ concerning the legal status of any country, territory, jurisdiction or area or of its authorities. Any such expression remains solely that of the relevant source and is not endorsed by BMJ. Maps are provided without any warranty of any kind, either express or implied.
Competing interests None declared.
Patient and public involvement Patients and/or the public were not involved in the design, or conduct, or reporting, or dissemination plans of this research.
Provenance and peer review Not commissioned; externally peer reviewed.
Supplemental material This content has been supplied by the author(s). It has not been vetted by BMJ Publishing Group Limited (BMJ) and may not have been peer-reviewed. Any opinions or recommendations discussed are solely those of the author(s) and are not endorsed by BMJ. BMJ disclaims all liability and responsibility arising from any reliance placed on the content. Where the content includes any translated material, BMJ does not warrant the accuracy and reliability of the translations (including but not limited to local regulations, clinical guidelines, terminology, drug names and drug dosages), and is not responsible for any error and/or omissions arising from translation and adaptation or otherwise.