Article Text

Abstract
Objectives To quantify the impact of the COVID-19 pandemic on life expectancy in Chile categorised by rural and urban areas, and to correlate life expectancy changes with socioeconomic factors at the municipal level.
Design Retrospective cross-sectional demographic analysis using aggregated national all-cause death data stratified by year, sex and municipality during the period 2010–2020.
Setting and population Chilean population by age, sex and municipality from 2002 to 2020.
Main outcome measures Stratified mortality rates using a Bayesian methodology. These were based on vital and demographic statistics from the national institute of statistics and department of vital statistics of ministry of health. With this, we assessed the unequal impact of the pandemic in 2020 on life expectancy across Chilean municipalities for males and females and analysed previous mortality trends since 2010.
Results Life expectancy declined for both males and females in 2020 compared with 2019. Urban areas were the most affected, with males losing 1.89 years and females 1.33 years. The strength of the decline in life expectancy correlated positively with indicators of social deprivation and poverty. Also, inequality in life expectancy between municipalities increased, largely due to excess mortality among the working-age population in socially disadvantaged municipalities.
Conclusions Not only do people in poorer areas live shorter lives, they also have been substantially more affected by the COVID-19 pandemic, leading to increased population health inequalities. Quantifying the impact of the COVID-19 pandemic on life expectancy provides a more comprehensive picture of the toll.
- COVID-19
- demography
- health policy
- public health
Data availability statement
Data are available in a public, open access repository. This analysis used publicly available data. All data are available at https://doi.org/10.5281/zenodo.6797737 and scripts generating results are available at http://www.github.com/gomena/life-expectancy-chile.
This is an open access article distributed in accordance with the Creative Commons Attribution Non Commercial (CC BY-NC 4.0) license, which permits others to distribute, remix, adapt, build upon this work non-commercially, and license their derivative works on different terms, provided the original work is properly cited, appropriate credit is given, any changes made indicated, and the use is non-commercial. See: http://creativecommons.org/licenses/by-nc/4.0/.
Statistics from Altmetric.com
Strengths and limitations of this study
We study mortality and life expectancy patterns in Chile at the subnational level.
Hierarchical Bayesian modelling was used to estimate reliable mortality levels and life expectancy.
The study is limited by the small number of death counts in some areas, which increases uncertainty around estimates.
Data quality may be a limitation for the study, which we try to overcome with the Bayesian estimation of mortality.
Introduction
Most Latin American countries experienced substantial progress in reducing premature mortality while increasing health standards over the last century and into the first fifteen years of the 21st century.1 2 But this progress has been reversed, as Latin American countries have been severely affected by the COVID-19 pandemic.3 The region became the hotspot of the pandemic in June 2020 and by March 2022 more than one and a half million COVID-19 deaths have been reported.4
After decades of sustained improvements in life expectancy, leading to levels comparable to low mortality countries, Chile experienced losses in this indicator in 2020 due to increased excess mortality during the COVID-19 pandemic (11 months for females and 1.3 years among males).5 While national figures are important and informative, they conceal heterogeneity at the subnational level, which can be substantial. Evidence from Latin American countries suggests that the COVID-19 pandemic has disproportionately affected disadvantaged groups with low socioeconomic status with large regional variation.6–10 In the context of Santiago, Chile’s capital, the observed worse outcomes in more deprived areas were explained by the combination of lower access to healthcare, poorer baseline health status of individuals, higher exposure to Sars-COV2 because of a reduced compliance with shelter-in-place orders (in turn, reflecting the inability to work from home), and by an ineffective epidemic surveillance system whose resources were predominantly allocated to more affluent areas, hampering early containment efforts.6
One key question is how the interplay of social and demographic factors at a more granular geographical scale affected life expectancy during the first year of the pandemic. Focusing on differences in mortality by age, sex, social deprivation and urbanity, we aimed at exploring two main hypotheses. First, life expectancy has been affected differently for females and males by urbanity status. Since COVID-19 first waves concentrated their impact on urban centres in Chile,6 we expect that declines of life expectancy were larger in urban areas. Also, since COVID-19 outcomes are typically worse among males at the national level,11 12 we expect larger drops in life expectancy among males in urban areas. Second, larger life expectancy losses were more predominant in socially deprived areas. This hypothesis stems from the known negative correlation between poverty and life expectancy.13 But because of the intricate relation between COVID-19 deaths by age and social deprivation, it is not straightforward to determine whether this correlation became stronger during the pandemic. In support of this hypothesis, recent research in Chile’s Capital showed a strong negative correlation between excess deaths and socioeconomic status. This correlation was particularly stark among younger age-groups but eventually evened out for the elderly.6 Since younger ages affect more life expectancy, it is likely that excess young-age mortality may have increased inequality in life expectancy. Alternatively, since death rates increased exponentially with age and losses in life expectancy in low mortality countries have been attributed mostly to mortality above age 60,5 it is likely that the pandemic in 2020 was such a strong shock that excess mortality differentials decreased, leading to reducing inequalities between municipalities.
This article contributes towards a more comprehensive understanding of the COVID-19 pandemic’s burden on population health by estimating life expectancy across Chilean municipalities by sex using a powerful Bayesian methodology.14 We contextualise our results with past trends of progress and disparities in life expectancy, and comment on the the relevance of acknowledging such persisting disparities in the design of social security mechanisms. Our study is a step towards explaining the varied impacts of the pandemic by analysing trends in life expectancy over age at a more granular level and by correlating life expectancy losses with indicators of poverty in Chile.
Study data and methods
Data
We used data on births and deaths by age, sex and municipality from publicly available vital statistics.15 These data were complemented with official population counts by age (single years of age from 0 to 89 and collapsed in 90+), sex and municipality from the 2002 and 2017 censuses available from the National Institute of Statistics.16 We also used official population projections between 2002 and 2020 centred at the 2017 census.17 Unlike censuses, these projections collapsed all ages greater than 80 in one single group. We only observed minor changes in our estimates based on whether the open ended interval started at 80 or 90, but we did observe that life expectancy estimates based on 2017 projections were substantially higher than the ones based on the 2017 census. We explain this by a possible inadequacy of the official projection for later years. Because of this reason, we considered two alternative population estimates for 2017 onwards. The first one assumes that population counts remain fixed for years 2018, 2019 and 2020. In the second one, we projected forward the population using the cohort component method18 with 2017 as baseline assuming zero migration. We also used census data to classify municipalities as urban or non-urban,19 if the following two conditions held: (1) population density greater than 70 people per square kilometre and (2) the proportion of people living in an urban environment is greater than 88%. Chile is made up of 366 municipalities and according to this criteria, 35% are classified as urban, making up for 65% of the population (17 539 805 as per the 2017 census) (see online supplemental tables 1–3 for details). Data on poverty and crowdedness were taken from the CASEN (National Socioeconomic Characterization Survey, in spanish) survey by the Chilean Ministry of Social Development and Family.20 CASEN is the most comprehensive official poverty survey available in Chile. For poverty, we used the ‘multidimensional poverty’ indicator. In CASEN, a household is defined to suffer from multidimensional poverty if it accumulates 22.5% of deprivation according to a weighted score that takes into account 15 variables including income, access to healthcare, labour, social security, housing and social cohesion among others. Likewise, a household is considered crowded if there are 2.5 or more people per room. All data used in our analyses have been compiled and made publicly available.21
Supplemental material
Mortality estimation
We performed mortality analyses at the municipality level since this is the finest spatial unit at which age and sex specific demographic data and covariates (poverty, crowdedness) are available. By considering municipalities as units we are able to investigate the variation of the resulting distribution of mortality and its relation with other covariates (eg, age, urbanity status, poverty). Age-specific death rates for each municipality by sex were estimated implementing a recently developed methodology14 based on a hierarchical Bayesian model22 using population and death counts. There are two main advantages to this Bayesian methodology: first, the fact that municipality specific rates are assumed to be samples from a population with global parameters enables the sharing of information between municipalities, helping to smooth out the noisy estimates that would otherwise be obtained if we relied only on empirical counts. This is important because of the increased likelihood of low death counts on each strata in small municipalities. Second, by appealing to the Bayesian methodology we immediately obtain credible intervals for each of our estimates (https://www.zotero.org/google-docs/?AxNbvW).
Life tables
Life tables were calculated using the age specific death rates estimated in the Bayesian procedure following standard techniques.18 From these, period life expectancy at birth, temporary life expectancy between ages 20 and 65, and remaining life expectancy at age 65 were obtained. Life expectancy at birth refers to the average years a cohort of newborns is expected to live given the current mortality conditions. Similarly, life expectancy at age 65 refers to the average years individuals aged 65 are expected to live if they were to experience the current mortality conditions throughout their lives. Given the emerging evidence about how younger age groups below age 65 have also been affected by the pandemic in the context of Chile, we constructed a measure to capture average longevity over working ages through temporary life expectancy. Temporary life expectancy between ages 20 and 65 refers to the average years lived between these ages given prevalent mortality conditions.23 For example, if no one were to die between these ages, then the temporary life expectancy would be the full 45 years. To complement our analysis we also consider the probability of dying before age 65 as an indicator of premature mortality.
Measuring heterogeneity
We leverage the availability of life expectancy estimates at the municipality level to conceive a fictitious population where each municipality is a sample. We quantify the heterogeneity of this population through the Gini coefficient.24 The Gini coefficient is a standard indicator of inequality employed in social sciences. In the context of this paper, the Gini coefficient expresses the degree of inequality in life expectancy across municipalities. With our methodology, we can seamlessly quantify temporal changes of the Gini for different strata (male/female, urban/non-urban) and report credible intervals.
Patient and public involvement
No patients were involved in this paper, all the analyses are based on aggregated data.
Results
Trends in life expectancy at birth and survivorship below age 65
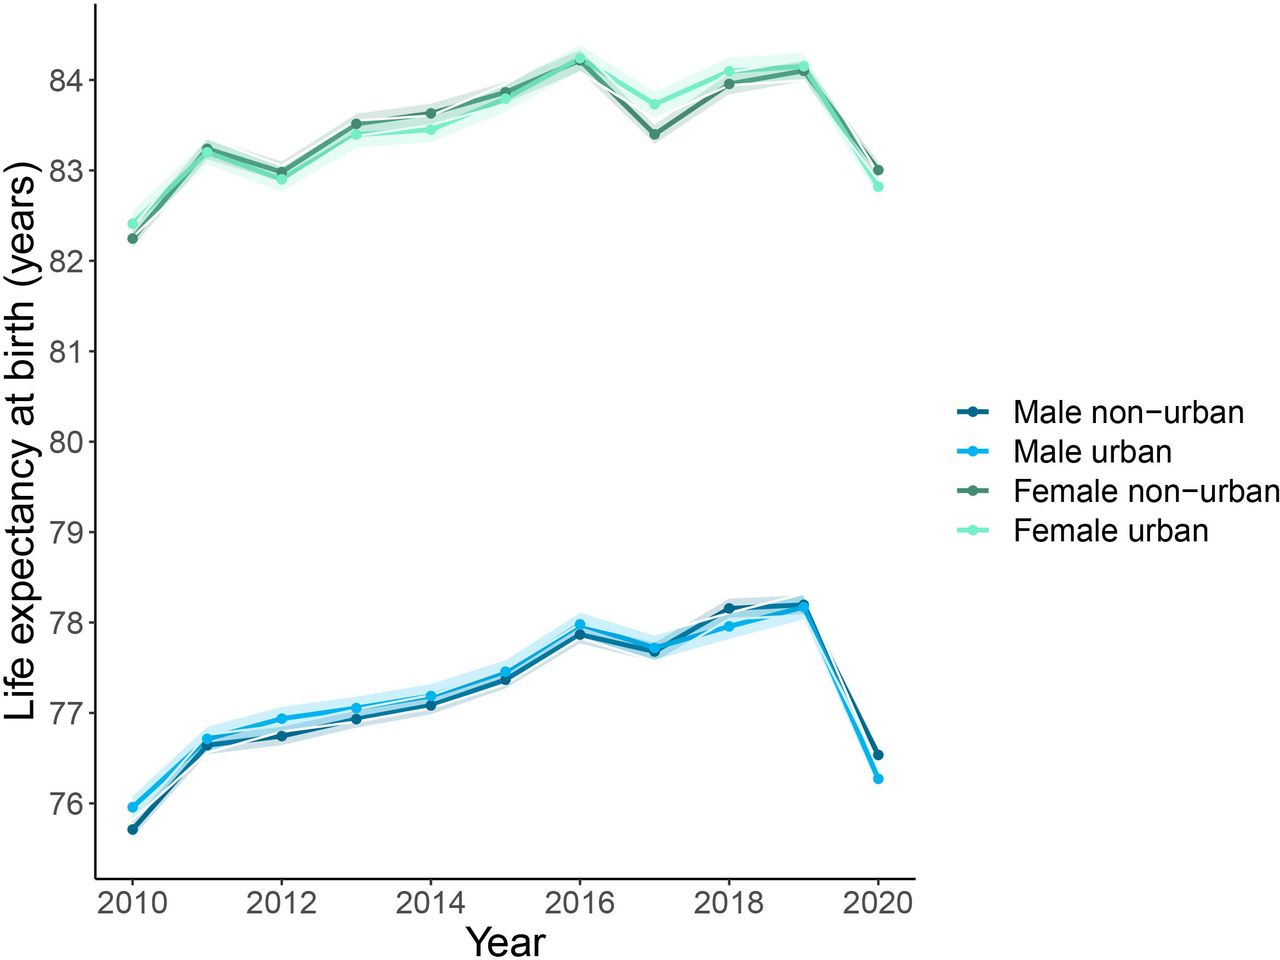
Males and females from both urban and non-urban areas experienced steady increases in life expectancy at birth from 2010 to 2019. Females showed higher life expectancy at birth than males in all groups. In contrast, higher mortality during 2020 led to sharp decreases in life expectancy at birth (figure 1) compared with 2019. Life expectancy among males in urban and non-urban areas declined by 1.89 (95% CI 1.68 to 2.09) and 1.66 (95% CI 1.50 to 1.80) years, respectively. Among females, life expectancy losses were 1.33 (95% CI 1.11 to 1.55) and 1.10 (95% CI 0.92 to 1.28) years, respectively. The magnitude of the decline from 2019 to 2020 offset most gains in life expectancy experienced in the last decade, especially in urban areas. In fact, 68% of the municipalities analysed ended up with lower life expectancy than in 2015, and this number rose to 75% in urban municipalities. In terms of individuals, 76% (non-urban) and 78% (urban) of the population lived in a municipality that faced a decline in life expectancy compared with 2015.

Life expectancy at birth by sex and condition of urban and non-urban in Chile. Solid lines correspond to estimates based on the entire population on each group, with bands indicating 95% credible regions.
Declines in the probability of surviving to age 65 (figure 2) between 2019 and 2020 indicate that changes in life expectancy cannot be fully attributed to increased mortality in older age groups only. While mortality above age 65 has been documented as one of the main contributors to declines in life expectancy internationally, substantial increases in mortality below age 65 are apparent in our results, especially among males in urban areas.

Probabiltiy of not surviving to 65 years by sex and condition of urban and non-urban in Chile. Solid lines correspond to estimates based on the entire population on each group, with bands indicating 95% credible regions.
Changes in disparities in life expectancy during the COVID-19 pandemic in 2020
Figure 3 shows the time evolution of the inequality in life expectancies across municipalities, and shows the striking impact of COVID-19 on this quantity. Inequality increased in urban areas from 2019 to 2020, with changes oscillating around 25%, a rate not seen in the recent past. The magnitude of increase is much larger in male and female life expectancy between ages 20 and 65 from urban areas (50.9% and 50.6% for males and females, respectively). Contrarily, in non-urban areas we do not observe changes deviating significantly from usual year-to-year fluctuations. Altogether, these results indicate not only that mortality during 2020 became more unequal, but that this inequality was driven mostly by the younger age group.

Time evolution (2002–2020 period) of the heterogeneity in life expectancy at birth (left), between 20 and 65 years (centre) and at 65 years (right). (A) Histograms of life expectancies over time, for male/female and urban/non-urban divisions. (B) Time evolution of Gini of the corresponding histograms in (A). (C) Relative yearly changes in the Gini’s with respect to previous years. Bars represent 95% credible intervals in (B, C).
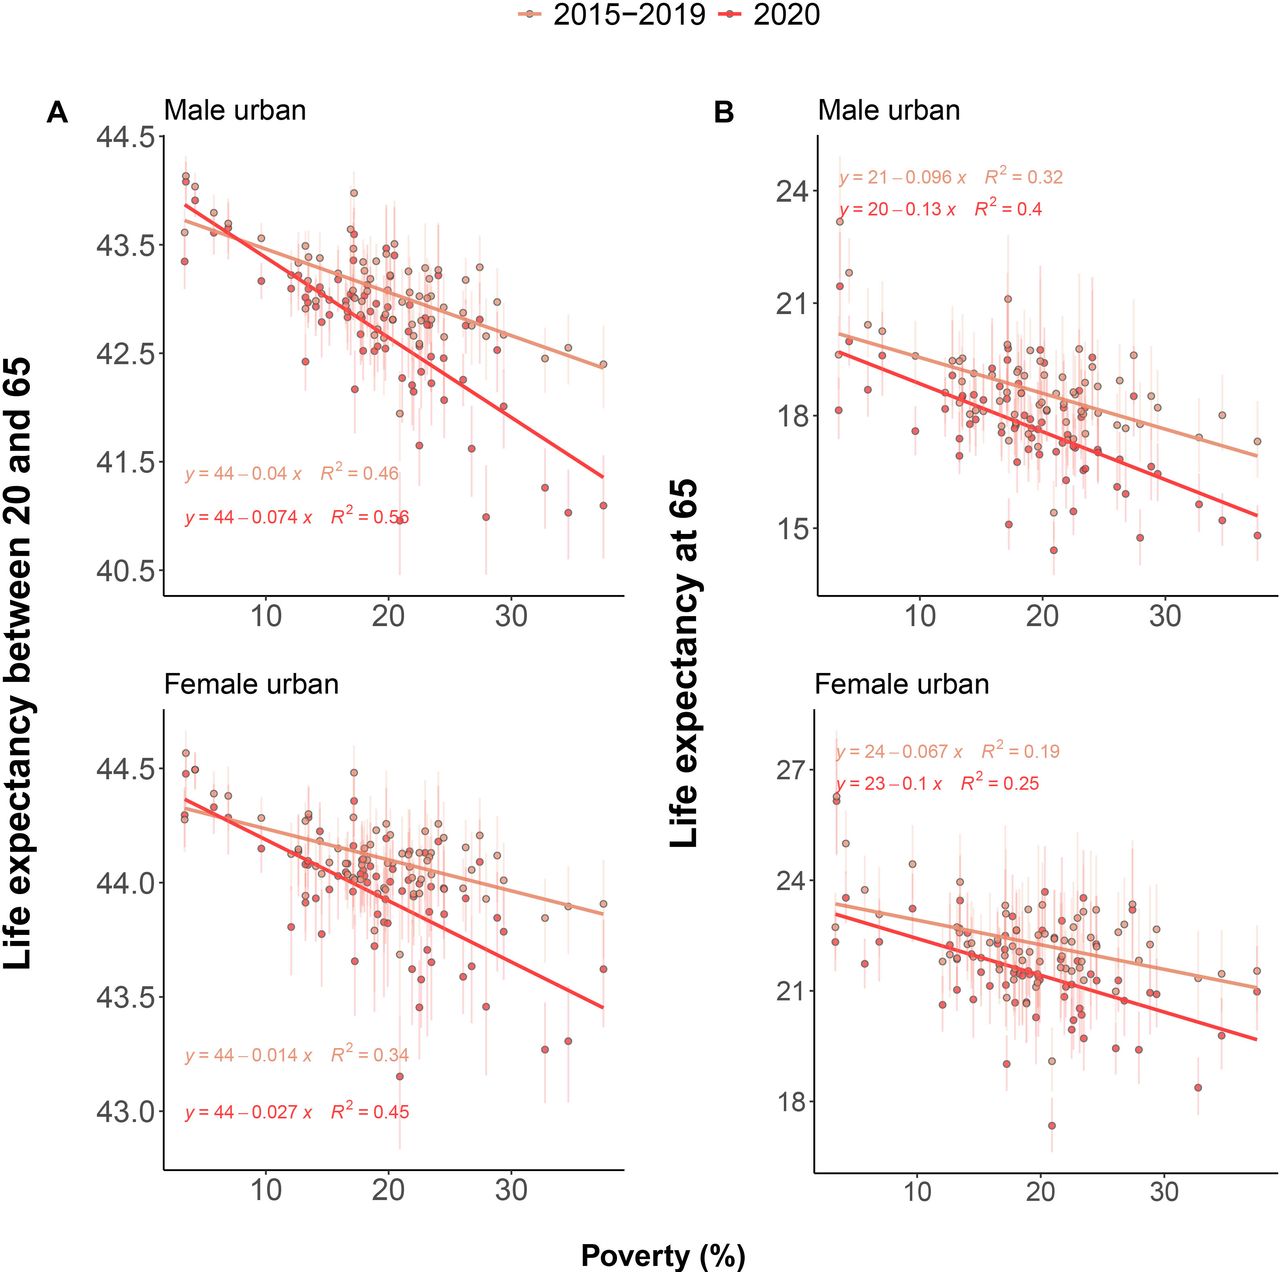
Histograms in figure 3 suggest that the abrupt increase in inequality during 2020 can be attributed to heavier left tails of the life expectancy distribution, indicating an increase in the amount of municipalities with a much lower-than-average life expectancy. To better understand the factors driving this spike in inequality, we investigated how declines in life expectancy during 2020 correlated with social deprivation indicators including poverty and crowdedness focusing only on mortality above age 20 across urban areas. Figure 4 shows the negative association between poverty and life expectancy between age 20 ang 65, and life expectancy at age 65. To underscore how the relationship changed in the course of 2020, we stratified the results juxtaposing the previous 5 years (2015–2019) with 2019–2020. Results show a strong historical negative correlation between life expectancies in both age groups, sexes and poverty levels. Males in the top poverty decile have a 4.39 years lower life expectancy than in the bottom decile. They also live on average 0.92 less years between 20 and 65, and 2.22 from 65 onwards. For females, these numbers are 2.51, 0.31 and 1.55 years. During 2020, the slope decreased, suggesting that those municipalities with higher levels of poverty experienced greater losses in life expectancy. This dependency was stronger in the younger age group.
Changes in inequality of mortality in 2020 with respect to recent history were stronger in younger age groups. A Comparison between 2015 and 2019 and 2020 of the average years lived between 20 and 65, for males and females, as a function of poverty. (B) Same as in (A), but with life expectancy at 65.
In contrast, while life expectancy at 65 declined during 2020, this decline was less unequal over the poverty gradient, consistent with the hypothesis that this group contributed less to inequality in changes in life expectancy. To formalise these observations, we performed regression analyses to model the interactions between year and poverty level through varying intercepts and slopes. We only found significant changes in the slope for average years lived between 20 and 65. For males, this translated into an additional difference of 0.78 years between the highest and lowest poverty deciles (p=0). For females, this difference was 0.30 (p<0.001).
Discussion
Urban areas that are exposed to higher poverty or social disadvantages experienced larger losses in life expectancy during the COVID-19 crisis in 2020 in Chile. Our results reveal that losses were unevenly shared across municipalities, over age, and by sex, leading to increasing inequality in life expectancy across regions in Chile. Moreover, consistent with previous research on increased mortality at younger ages in 2020 in deprived municipalities in Chile’s capital,6 our research shows that working age mortality was one of the main drivers of increasing inequality in life expectancy across Chile.
Analysis of life expectancy in 2020 compared with the previous 5 years (2015–2019) show that poorer urban municipalities suffered a double burden. Not only did they show lower levels of life expectancy but they also experienced greater losses in life expectancy. This is consistent with previous research documenting larger mortality increases for the lower educated groups in Chile’s capital.25 Furthermore, when we disaggregate by age groups, we observe that the association between life expectancy for working age individuals (between ages 20 and 65) and levels of poverty became stronger compared with previous years. This is consistent with previous evidence had documented a positive association between income and life expectancy at retirement.26 This suggests that even if the burden of mortality during the COVID-19 crisis has been concentrated at older ages,27 contributing substantially to life expectancy declines during 2020,28 inequalities in life expectancy were largely driven by increased mortality in working ages at higher levels of poverty. A potential explanation is that the working age population’s availability to work from home and be less exposed to heightened risk of COVID-19 and its consequences varies across poverty levels. Deprived populations in Chile’s capital experienced higher fatality rates as a consequence of worse baseline individual health status and to an overwhelmed healthcare system.6 Similarly, evidence from the USA suggests that those individuals with less availability to work from home had higher death rates compared with those that could afford working from home in 2020.29
An open question is whether this sudden increase in inequality amounts to a shock that will be followed by a recovery to pre-pandemic levels, or whether these changes will persist in the long term. Beyond the immediate increase in premature mortality, this is relevant because failing to acknowledge inequalities in mortality may compromise the progressiveness and actuarial fairness of social security and public pension systems in the long term,30 31 which could be translated into higher mortality in the future. Similarly, the scars left by the pandemic, including a weak health system, may increase mortality from multiple causes of death. For example, postponed cancer treatments and failure to detect other chronic degenerative diseases timely may lead to lower levels of life expectancy in the long term than it was projected. This highlights the need for accurate and timely data on other causes of death. Future analysis should focus on analysing the consequences of the COVID-19 pandemic, including multiple causes of death and diseases to study the direct impacts from COVID-19 mortality as well as the indirect impacts through other pathways of diseases and conditions.32 Our research, in this sense, provides a first outlook by focusing on all-cause mortality.
As shown by our results, the case of Chile underscores the dire widening of an already large mortality gap between those living in deprived conditions and those living with higher income during the COVID-19 crisis. Evidence shows that the health consequences of external shocks such a pandemic or an economic crisis are not spread equally across social deprivation levels.33 The COVID-19 pandemic reminds us of the ever-present risk of such events, whose cumulative impact may partially explain the ever-existing gaps in mortality. Therefore, the way that this crisis has exposed the vulnerabilities of socially deprived populations is a call to challenge the monolithic view of a country’s demographics in the design of social security systems. New strategies incorporating a public health perspective that considers widening inequalities should be implemented to minimise the impacts of the COVID-19 pandemic on the health status of the Chilean population both immediately and in the long term.
Limitations
This study had several limitations. First, while Chile’s vital registration is one of the most reliable in Latin America, there are likely to be inaccuracies in mortality registration due to age misreporting and coverage across municipalities, as well as systematic age overstatement.34 Delays in recording deaths may lead to incompleteness issues especially in urban areas. Our results on life expectancy declines and mortality inequalities may be considered a lower bound because of these issues. The effect of systematic age overstatement is likely to affect our results too. However, there is no information on what the age pattern of overstatement is during the pandemic. To mitigate these inaccuracies and their effects on life expectancy estimates, we used a hierarchical Bayesian model that helped to retrieve a reasonable mortality profile across regions. Another limitation is that because of the low number of deaths observed in some municipalities, the degree of uncertainty around the estimates was very high, not allowing us to include them in our analysis with confidence. We excluded municipalities by sex with less than 16 000 people (as per the 2017 census), as we observed that life expectancy estimates were unstable even with our adopted Bayesian methodology. However, we grouped them together and reproduced all results to avoid systematic exclusion. Results were consistent and are shown in online supplemental figure 1. Almost all of these were non-urban municipalities. Some other six municipalities were excluded in 2004 based on a visual inspection of mortality trends that were clearly indicative of coding errors in the mortality database (see online supplemental figure 2) during that year. Despite these limitations, we used the most reliable data for Chile and state-of-the-art methodologies to gauge mortality dynamics across Chile. Additionally, our results are limited in that stratified population counts are typically model-based estimates (except at census years), and might be biased. We studied the effect of alternative population estimates in final outcome measures, as described in online supplemental figures 3–15. Finally, because of our observational study design, we are only able to measure associations but not proper causal effects of poverty in mortality.
Data availability statement
Data are available in a public, open access repository. This analysis used publicly available data. All data are available at https://doi.org/10.5281/zenodo.6797737 and scripts generating results are available at http://www.github.com/gomena/life-expectancy-chile.
Ethics statements
Patient consent for publication
Ethics approval
This research project does not require ethics approval as it uses only macro data that are freely available online.
Acknowledgments
We are grateful to Alberto Palloni and the Health Inequality reading group at LCDS for comments on earlier versions of the manuscript, and to Monica Alexander and Ameer Dharamshi for sharing their code related to reference 14. We thank the two reviewers for their careful reading of the paper and comments/suggestions that helped improve the paper
References
Supplementary materials
Supplementary Data
This web only file has been produced by the BMJ Publishing Group from an electronic file supplied by the author(s) and has not been edited for content.
Footnotes
Contributors GM: data curation, software, validation; GM and JMA: formal analysis, investigation, conceptualisation, methodology, project administration, resources, validation, visualisation, writing (original draft), and writing (review and editing). GM: guarantor, accepts full responsibility for the finished work had access to the data, and controlled the decision to publish.
Funding JMA acknowledges support by European Union Horizon 2020 research and innovation programme under the Marie Sklodowska-Curie grant agreement No 896821, ROCKWOOL Foundation’s grant on excess deaths, and the Leverhulme Trust Centre grant.
Competing interests None declared.
Patient and public involvement Patients and/or the public were not involved in the design, or conduct, or reporting, or dissemination plans of this research.
Provenance and peer review Not commissioned; externally peer reviewed.
Supplemental material This content has been supplied by the author(s). It has not been vetted by BMJ Publishing Group Limited (BMJ) and may not have been peer-reviewed. Any opinions or recommendations discussed are solely those of the author(s) and are not endorsed by BMJ. BMJ disclaims all liability and responsibility arising from any reliance placed on the content. Where the content includes any translated material, BMJ does not warrant the accuracy and reliability of the translations (including but not limited to local regulations, clinical guidelines, terminology, drug names and drug dosages), and is not responsible for any error and/or omissions arising from translation and adaptation or otherwise.